
Share your thoughts
placeholder
Article
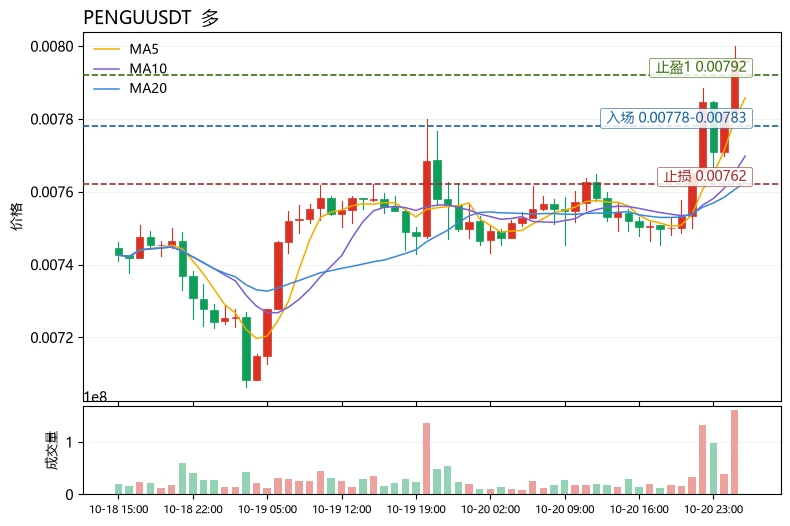
SKYAI’s 95% short signal is screaming, but the 15m RSI just hit 65—who’s buying this fake bounce?

$SKYAI /USDT - SHORT

Trade Plan:
Entry: 0.06033 – 0.06095
SL: 0.06357
TP1: 0.05844
TP2: 0.05698
TP3: 0.05478

Why this setup?
Why now? The 4h timeframe is loading a bearish cannon, and the daily trend confirms the floor is giving way.
- Entry zone: 0.06064 (tight range 0.06033–0.06095) is your launchpad.
- Targets: TP1 at 0.05844, TP2 at 0.05698—that’s a 6% drop from here.
- Stop at 0.06357 is wide enough to breathe, but tight enough to punish dreamers.
- ATR (1h) at 0.001221 means vo
SKYAI+6.39%
Most traders will ignore HOME/USDT right now—that’s exactly why I’m watching it.

HOME/USDT - SHORT

Trade Plan:
Entry: 0.0061 – 0.0061
SL: 0.0062
TP1: 0.0060
TP2: 0.0060
TP3: 0.0059

Why this setup?
Why now? The 4h signal screams SHORT with 95% confidence, but the 15m RSI (51.28) hasn’t confirmed weakness yet. That’s the trap—waiting for exhaustion that already happened on the 1D bearish trend. Entry at 0.0061, TP1/TP2 stacked at 0.0060, TP3 at 0.0059. The ATR (4.4e-05) says moves are tight, but the trend says they’re relentless. Price is sitting at a pivot—if 0.0061 breaks, the slide is m
HOME+1.50%
$ETH Signal】Long | 1H Bollinger upper band breakout + MACD momentum expansion
$ETH RSI(1H)64.05, with the price at 2482.53 holding above the 1H Bollinger upper band at 2481.64.
The 1H MACD histogram is 3.87, while the 4H MACD histogram is 0.47 and remains in a bullish crossover state, with short-term momentum clearly dominant. EMA20/50 are tightly clustered around 2454-2462, and the price is above all moving averages. The order book Bid/Ask ratio is 0.70, with sell orders relatively heavy, so chasing longs directly carries a high risk of getting wicked. OI is stable, the funding rate is 0.005
post-image
ETH+1.02%
BTC+0.05%
SOL+1.57%
This was purely the market being in a good mood and casually scattering some gold coins, with one happening to land right on my head. During the repeated intraday swings, $XRP fell just short every time it pushed higher. The candlesticks looked limp, but when I looked at the trading volume, buying pressure had actually been quietly strengthening all along. When everyone was afraid to move, I instead felt it was time to act.

The long position signaled at 1.3845 is now at 1.4149, +204.92%. Feeling good, brothers. This kind of bottoming structure tests your patience the most, but as long as you
post-image
XRP+1.09%
BTC+0.03%
ZEC-1.52%
Watching the price push higher, outsiders are anxious to chase, while those already holding positions are also torn over whether to exit. The approach for this $PROLOGUE trade is simple: once the price entered a rapid rally, I took 70% off the table and set a protective stop for the remaining position, letting it run on its own. The reason is that the more rapid the rally, the faster the pullback often arrives. By putting the bulk of the profit in the pocket first, it becomes easier to view subsequent volatility calmly.
Looking back at the entry point, the decision to go long was fairly clear
post-image
PROLOGUE-27.36%
LAB+2.32%
BTC+0.03%
Everyone’s long $CL /USDT at 91.78—except the 4h tape just whispered a secret.

$CL /USDT - SHORT

Trade Plan:
Entry: 91.69 – 91.87
SL: 92.60
TP1: 91.17
TP2: 90.76
TP3: 90.14

Why this setup?
Why now?
- 1D is range-bound, so no breakout fuel—only mean reversion.
- 15m RSI at 60.4 is fading; momentum is stalling right at resistance.
- ATR (1h) at 0.34 means tight stops—but TP1 at 91.17 is a 0.6% drop that respects the range floor.
- Confidence is weak (55), so this is a scalp, not a saga.

Debate:
Are you fading the 91.78 pop for TP1, or does the range fake you out into 92.39 first?
CL+0.88%
Bonk Guy might be up $5m but there's only $2m in the LP so good luck with that
Bonk Guy might be up $10m but don't forget about taxes, he'll be left with maybe a couple mil
Bonk Guy is up $20m but it's impossible for him to sell with everyone watching his wallet
Bonk Guy is up $50m but there's more to life than money fml I'd be up how much if I had just longed???
BONK+0.58%
A few days ago, my hand trembled slightly as I set a stop-loss before bed. Looking at it this morning, I had simply scared myself. When $ETH plunged intraday, I saw that the pullback held and knew someone was catching it below.
Once the pullback held and buying gradually strengthened, it would have been hard to justify staying out of this setup. I opened a long at 2451.64, set the stop-loss, and stopped watching the chart.
Now the market has given us the answer: it surged straight to 2478.11, with +187.77% unrealized profit sitting there. Feels good, brothers. That was a satisfying bite of me
post-image
ETH+1.02%
BTC+0.03%
XRP+1.09%
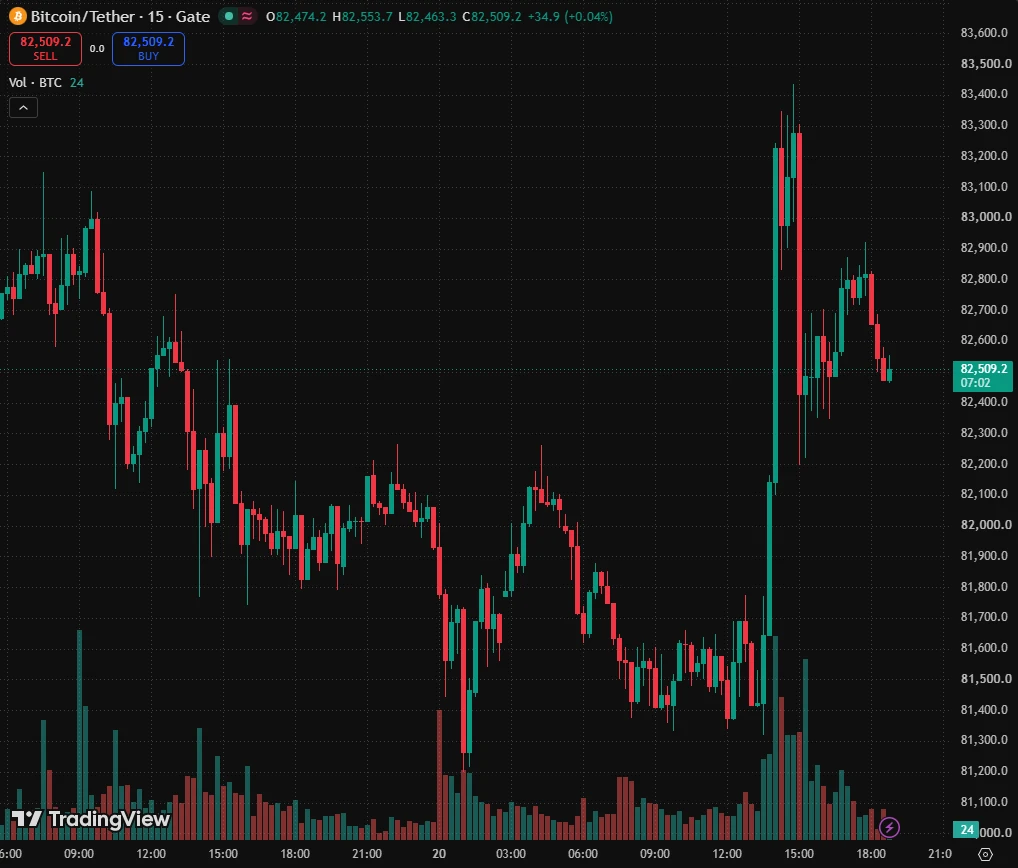
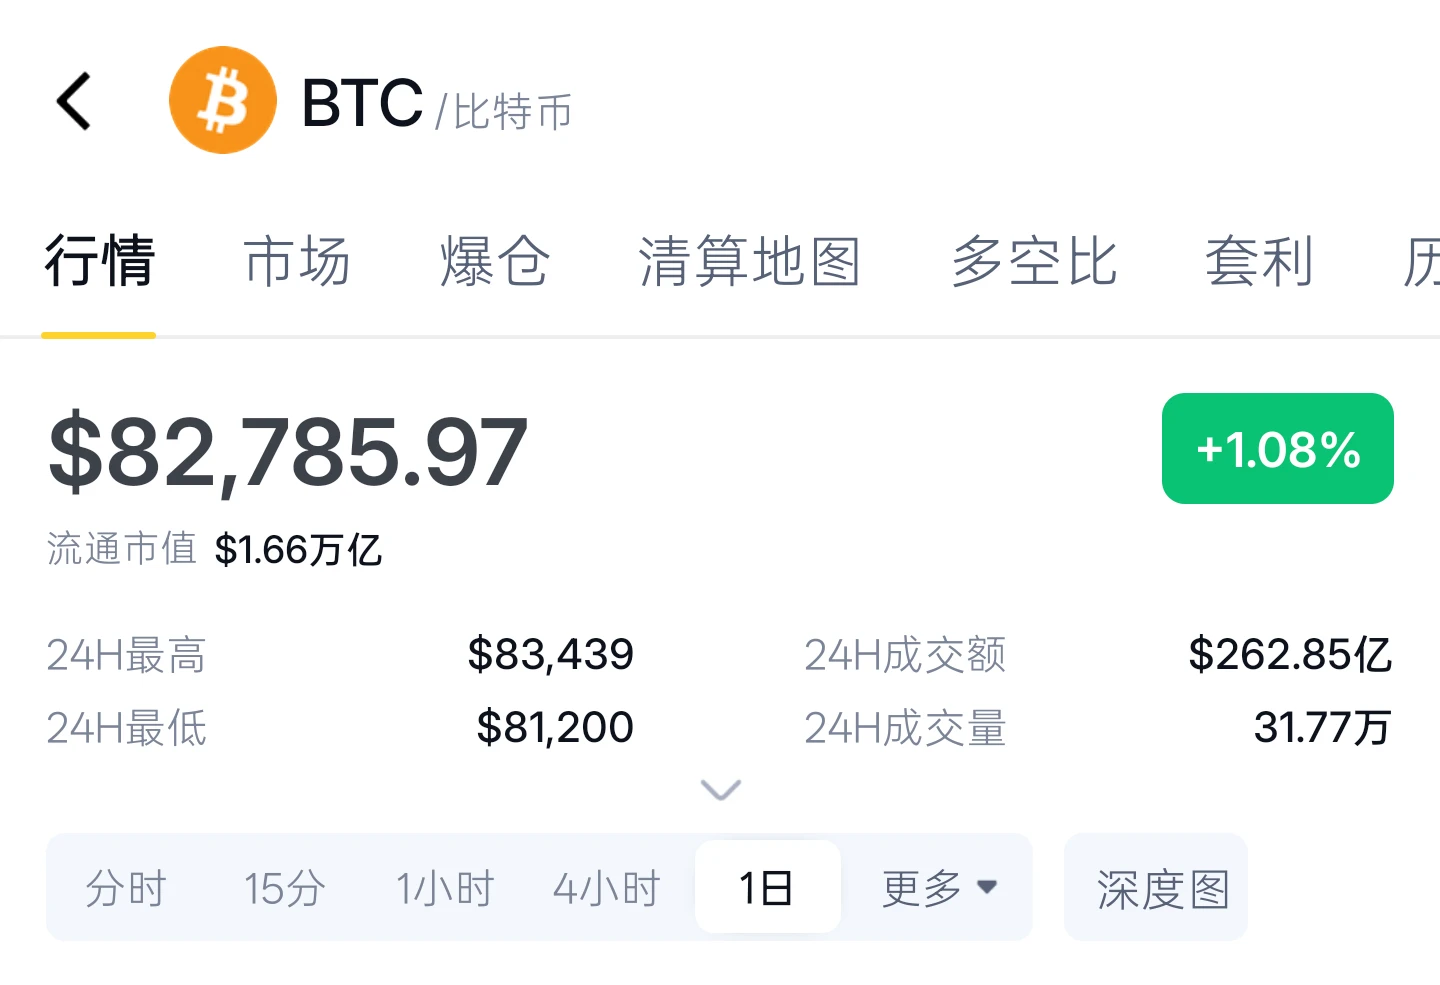
Bull-Bear Divide Deepens Around $82K! B.TOP Founder Sells All His BTC
live-cover
LIVE88
Most traders think XLM is dead—what if the range itself is the trap?

$XLM /USDT - SHORT

Trade Plan:
Entry: 0.18423 – 0.18501
SL: 0.18837
TP1: 0.18181
TP2: 0.17993
TP3: 0.17712

Why this setup?
- 4h bias is SHORT with 55% confidence—not a slam dunk, but a lean.
- Price sits at 0.18462, right at the range midpoint—no momentum, just indecision.
- RSI 15m at 58 shows weak bounce, but ATR 1h (0.00156) says volatility is shrinking—breakouts will be sharp.
- Targets: TP1 at 0.18181, TP2 at 0.17993—that's a 2.5% drop from here. In a range, the middle is the worst place to be long.

Debate:
post-image
XLM+2.65%
$meme wow 😮
0x385f4f8ae47651ce5f58f5265395a669f8281e18
post-image
MEME+5.78%
Web3 and crypto continue to evolve at an incredible pace new ideas, protocols and use cases are emerging every day. But in a market where innovation is constant novelty alone won’t create lasting value.
The projects that truly stand out will be those that go beyond speculation solve meaningful real-world problems, simplify adoption and bring more people into the digital economy.
The future of Web3 won’t be defined by whom makes the most noise.
It will be defined by whom builds what people actually need.
#Web3
post-image
Everyone’s cheering DOGE at 0.0908, but the 4H tape just whispered a secret the crowd missed.

$DOGE /USDT - SHORT

Trade Plan:
Entry: 0.09055 – 0.09123
SL: 0.09417
TP1: 0.08843
TP2: 0.08679
TP3: 0.08432

Why this setup?
Why now? The 1D is range-bound, not trending—so rallies are rentals, not ownership. RSI on the 15m is hot at 60, but that’s exhaustion fuel, not ignition. With ATR at 0.0013, the squeeze is coiled. The primary path targets 0.0884 (TP1) then 0.0867 (TP2)—a 4.5% drop from here. The alternate longs only trigger if we break 0.0912 with force, but confidence sits at 55% SHORT, m
DOGE+7.01%
$ASTEROID liquidated over 600 million in long positions.
post-image
ASTEROID-13.88%
People often ask how to hold onto a position when the market is rallying. Honestly, it’s not about stubbornly holding on; each stage requires its own approach. I decided to go long on $SUI not out of a momentary impulse, but because the price held up after repeatedly retesting key levels, with the structure temporarily favoring the bulls, so I chose to enter around 0.7630 to test a long.

The hardest part during the consolidation wasn’t judging the direction, but keeping my hands steady and not making impulsive moves. Once the price started rising again and short-term room opened up, I first
post-image
SUI+5.45%
XRP+1.09%
ZEC-1.52%
Oil Prices and CPI Data Could Shape the Next Direction Across Global Markets
live-cover
LIVE397
Everyone’s watching the 1D trend—but 95% confidence shorts on $LAB /USDT are the quiet exit liquidity.

$LAB /USDT - SHORT

Trade Plan:
Entry: 0.07491 – 0.07539
SL: 0.07742
TP1: 0.07345
TP2: 0.07232
TP3: 0.07062

Why this setup?
Why now? The 4h structure is breaking, and the 1D trend is already bearish—this isn’t a guess.
- RSI 15m at 58.79 shows a weak bounce, not a reversal.
- Entry zone 0.07515–0.07539 aligns with the last defense before TP1 at 0.07345.
- ATR 1h (0.000944) says volatility is compressing—breakouts punish late longs.

Debate:
If the 1D trend is bearish and confidenc
LAB+2.32%
MARKET ALERT - PEPE/USDT
analysis and trading opportunities.
​4-Hour Timeframe Analysis (TF 4H)
​Market Condition: The price is at 0.000003631, above the 20 EMA (0.000003567) and 50 EMA (0.000003583). This indicates a short-term rebound and positive consolidation above the 200 EMA (0.000003337), which is acting as strong support.
​Trading Opportunity: Potential Long (Buy) if the price holds above the 50 EMA. The nearest resistance target is in the 0.000004153 to 0.000004558 range. Set the Stop Loss (SL) below the 200 EMA, around 0.000003300.
​1-Day Timeframe Analysis (TF 1D)
​Market Condition:
post-image
PEPE+1.20%
BTC+0.03%
ETH+1.02%
  • 3
Everyone’s long PEPE while the 4h chart whispers a different secret.

PEPE/USDT - SHORT

Trade Plan:
Entry: 0 – 0
SL: 0
TP1: 0
TP2: 0
TP3: 0

Why this setup?
- Signal says SHORT with 55% confidence—not a scream, but a warning.
- 1D trend is *range*, not breakout—so buying tops here is gambling.
- RSI on 15m at 57 shows a dead bounce, no fuel for a push higher.
- Why now? The “waiting” status means the trap is set—patience beats impulse.

Debate:
Are you fading this range or riding the fakeout—what’s your PEPE play before 19:00 UTC?
PEPE+1.31%
Everyone’s staring at WLD’s 0.397—but the real trap is the 0.387 invalidation line.

WLD/USDT - SHORT

Trade Plan:
Entry: 0.396 – 0.398
SL: 0.408
TP1: 0.389
TP2: 0.383
TP3: 0.375

Why this setup?
Why now? The 4h frame is armed for a short, yet confidence is only 55—that’s hesitation, not conviction. RSI(15m) at 48.57 is dead neutral, so no momentum push. ATR(1h) at 0.0046 means volatility is thin; this range could snap violently. Entry at 0.397 with TP1 at 0.389 is a 2% scalp, but TP3 at 0.375 is 5.5%—that’s the real prize if the daily range breaks down.

Debate:
Will WLD respect the 0.387
WLD+4.22%
Load More

Join 40 M users in our growing community

⚡️ Join 40 M users in the crypto craze discussion

💬 Engage with your favorite top creators

👍 See what interests you

View More