Share your thoughts
placeholder
Article
Layout for Bitcoin, Ethereum, and Dogecoin
live-cover
LIVE3,124
  • 1
This trend is so obvious I don’t even need to think—the account is partying on its own.

When I opened the charts this morning, OKB had already pulled back to around 89.13. It was moving sideways at the bottom without breaking down, while buying pressure was also strengthening. I casually went long with a small position, but I didn’t expect it not to give even a decent pullback.

The price went straight to 115.2, with the return already reaching +717.77%. This round of waiting wasn’t in vain—every candle afterward kept providing answers. It really feels great.

Don’t let profits inflate, an
post-image
OKB+3.14%
BNB+2.40%
BTC+0.13%
#RedBullTradingTourSeason6
The Red Bull Trading Tour continues for Season 6. Gate has partnered with Red Bull Racing again and the prize pool remains 60,000 GT, with F1 race tickets and official Red Bull models still available. Participation and volume tied to the campaign stay elevated.
The structure keeps barriers low. New users can claim a position voucher on registration, VIP registration carries its own exclusive reward, and daily sharing tasks unlock additional vouchers. Volume feeds directly into the ranking and the GT distribution. The mix of cash-equivalent rewards, physical merchand
GT+7.13%
  • 1
$SNDK What Does SanDisk’s Inclusion in MSCI Mean?
On August 12, 2026, MSCI announced its quarterly index review results. Effective after the close on August 31, 2026, SanDisk (SNDK) was added to the MSCI All Country World Index (ACWI). Also added were 55 companies including Carpenter Technology (CRS) and ATI Inc (ATI), while another 92 were ruthlessly removed. SanDisk reversed its late-session decline and rose more than 5%, entering the MSCI global index after today’s close.
The ETF tracking MSCI World is the iShares MSCI World series, while ACWI corresponds to the iShares MSCI ACWI ETF (ACWIU
SNDK+11.88%
  • 5
The privacy sector is really strong this time. That day, after catching a wave of zec, I casually chased dash.
I took a look today when I had some free time. Even zen, with its Christmas tree structure, is pumping.
All I can say is, the market is really full of fomo.
$ZEC $DASH #美国8月非农超预期
ZEC+15.55%
DASH+4.61%
  • 7
  • 2
#Share My Holding Returns#BTCReclaims80K Hopefully we make a profit, bro. Small capital is fine; what matters is trading.
post-image
#GateTops7DayNetInflowsGlobally
DefiLlama data shows Gate recorded 78.19 million dollars in net inflows over the past seven days, placing it first among global centralized exchanges for the period. The ranking arrives while broader market activity has been mixed and capital continues to rotate between venues.
Net inflows of this size usually reflect a combination of new capital entering the platform and existing users consolidating balances rather than moving funds elsewhere. When an exchange leads the seven-day list it often coincides with product launches, competitive fee or reward structur
BTC+0.11%
  • 2
$$EPIC 15 minutes ago it was still sitting at 0.3657, and now it has shot straight up to 0.4440, with $21 million in 24-hour trading volume—this is no longer a rise; someone is grabbing tokens by the sack. If you didn't get in earlier, the risk of chasing higher and the anxiety of missing out are now fifty-fifty. Weigh it yourself.
Let's start with the projection: 0.4783 is today's high and also the resistance level. If this is a launch after a shakeout, a pullback that holds above 0.42 would be the best entry for the next leg; but if volume contracts and it breaks below 0.40, the trapped hold
EPIC+21.30%
#BTCReclaims80K
$BTC ‌ ‌
Bitcoin is currently trading around **$79,913**, sitting right at the doorstep of the highly psychological **$80,000** level after a sharp rejection from the $82,000 zone earlier this week.
Here’s the complete, up-to-date technical picture:
Price Action Summary
- Current Price: **~$79,913**
- Recent High (Sept 3-4): **$82,200 – $82,300**
- Recent Low (pullback): **~$78,650**
- 24h Range: Tightening between $79,400 – $80,200
BTC is attempting a clean reclaim of the $80k handle after failing to hold above it following the strong rally from the mid-$77k area.
Key Techni
post-image
BTC+0.11%
Everyone’s staring at the green candle, but the 4H clock is ticking against ENA.

$ENA /USDT - SHORT

Trade Plan:
Entry: 0.17464 – 0.17672
SL: 0.18571
TP1: 0.16816
TP2: 0.16314
TP3: 0.15562

Why this setup?
- 1D is range-bound, not bullish—so rallies are for selling, not chasing.
- RSI at 49 on the 15m shows zero momentum; we’re stuck in no-man’s land.
- ATR (0.00418) is thin—meaning the next move will be violent, and the path of least resistance is DOWN toward TP1 at 0.16816.
- Why now? The entry is armed at 0.17568, and with a 55% short confidence, the market is giving us a low-risk
ENA+6.45%
[ New Streamer ] ETH Market Talk
live-cover
LIVE2,029
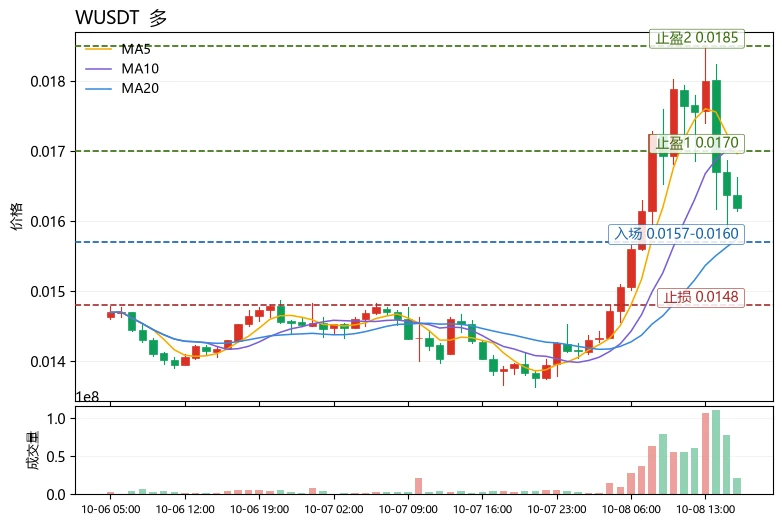
IOST surged 25% in 25 minutes on $22 million in trading volume, with a massive bullish candle directly breaking through the previous high. But remember, retail traders chasing this kind of move are just carrying the market maker’s sedan; my system only trades pullback confirmations.
The core battle points in the current market: 0.0008 is today’s bull-bear dividing line, 0.0007 below is the dense support zone, and 0.00085 above is the area where trapped holders may be released. A 30% 24h range indicates extremely high market-maker control. With this kind of coin, either stay out, or participate
IOST+24.94%
#Web3SecurityGuide
Web3 security remains one of the most critical skills for anyone interacting with decentralized applications, wallets, or on-chain assets. Unlike traditional finance, most losses in this space are irreversible. Once funds leave a compromised wallet or a malicious contract is approved, recovery options are extremely limited. A practical security approach therefore focuses on prevention rather than reaction.
The foundation of Web3 security begins with wallet management. Hardware wallets remain the strongest option for storing significant value because private keys never leave
post-image
Everyone’s watching HOME bounce—but the 4h tape is screaming something else entirely.

$HOME /USDT - SHORT

Trade Plan:
Entry: 0.00615 – 0.00617
SL: 0.00627
TP1: 0.00608
TP2: 0.00602
TP3: 0.00594

Why this setup?
- 1D trend is bearish, yet 15m RSI sits at 57.6—that’s a dead-cat wiggle, not a reversal.
- Price is pinned at 0.00616, right at the invalidation line. A rejection here fuels the short engine.
- With ATR at 0.000045, the path to TP1 (0.00608) is a 1.3% glide—low effort, high probability.
- Why now? The 4h structure is primed for a liquidity sweep below 0.00615 before the dail
HOME+0.65%
$ZIVIDEND coded
Be early
It's already on FOMO 👇👇👇
post-image
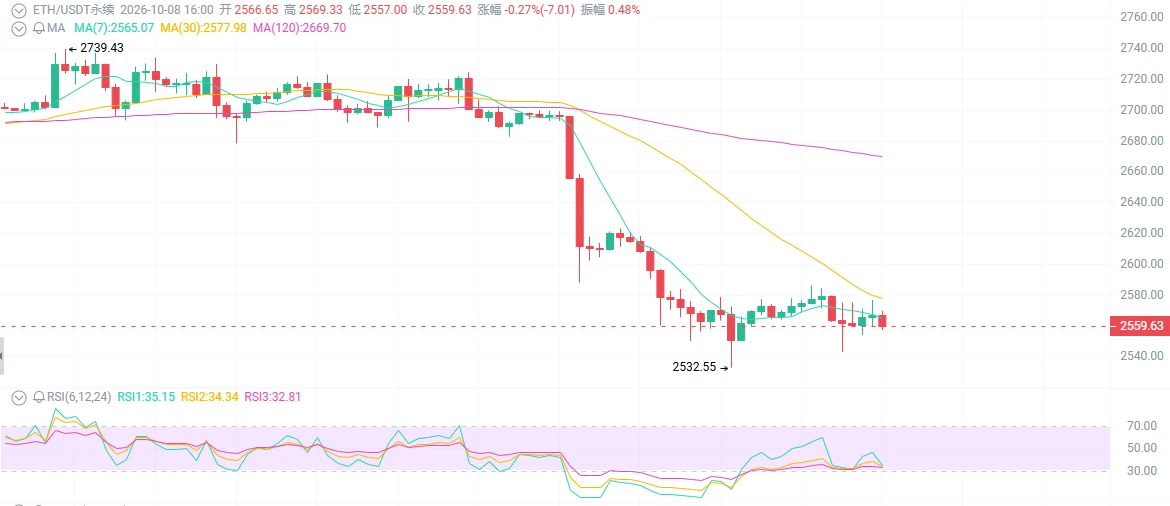
September 6 BTC and ETH Market Analysis
Today's Market Outlook
After the sharp rise, the market has entered high-level sideways consolidation and shakeout, with bulls and bears pulling against each other. Don't chase rallies or panic-sell. BTC is stable, while ETH has greater elasticity and more intense volatility. Right now, the easiest mistake is to impulsively take a heavy position on one bullish candle and panic-cut losses on one bearish candle, so position management comes first.
BTC
Trend: Range-bound consolidation, awaiting a directional move; no one-way market
✅ Long: Enter at 76600, s
post-image
BTC+0.13%
ETH+1.60%
JUST IN: Serenity warns storage shortages persist with potential for wider gaps and price upside into year-end; market rotates between bottleneck sectors while fundamentals stay intact. $SNTY
post-image
#USELESSSurgesAnother67%
USELESS is currently trading near 0.25 after another sharp upward move that registered approximately 67 percent gains in a recent 24-hour window.
The token, a Solana-based meme coin, has shown repeated strength over the past week. Market data places the current price in the 0.248 to 0.252 range, with a market capitalization around 249 to 252 million dollars. Twenty-four-hour trading volume has remained elevated, frequently exceeding 140 to 150 million dollars on spot markets and significantly higher when futures volume is included. This level of activity indicates gen
post-image
Falcon_Official
#USELESSSurgesAnother67%
$USELESS
MOMENTUM IS STILL RUNNING
USELESS has once again become one of the most aggressive momentum stories in the market. After its explosive multi-day rally, the token is now trading around $0.22, following a powerful move that previously pushed price toward the $0.25–$0.28 region. The latest market data shows just how extreme the move has become: USELESS has gained roughly 250%+ over seven days, while 24-hour trading volume has expanded above $200M.
THE BIGGER PICTURE
What makes this setup interesting is that USELESS is not simply experiencing a one-candle pump. The rally has developed across several sessions, with price moving from roughly $0.06–$0.07 at the beginning of the recent acceleration toward the $0.20+ area. Recent daily data shows gains of approximately 31.8% on Aug. 31, 24.8% on Sept. 1, 9.7% on Sept. 2, and 68.1% on Sept. 3, followed by another strong session on Sept. 4.
$0.22 IS THE NEW BATTLEFIELD
At the current $0.22 area, the chart is entering a completely different phase. Buyers have already demonstrated extraordinary strength, but the question now is whether they can maintain that momentum after such a rapid expansion.
The first level I would watch is $0.25. This remains the major psychological barrier because it represents a clean round number and sits close to the recent high zone. A strong daily close above $0.25, supported by sustained volume, would strengthen the continuation setup.
UPSIDE LEVELS
If USELESS successfully reclaims and holds $0.25, the next area to watch would be approximately $0.258–$0.26. A clean break there could put $0.30 back into focus.
Above $0.30, the $0.31–$0.312 region becomes an important technical target. From $0.22, a move to $0.25 would represent roughly 13.6%, while $0.30 would require about 36.4% upside. Reaching $0.312 would mean approximately 41.8% from the current level.
BUT THE CHART IS EXTREMELY HOT
This is where traders need to separate trend strength from risk. USELESS has already moved several hundred percent in a very short period, and current market activity confirms that speculation is intense.
The latest 24-hour range has been extremely wide, with market data showing price moving between roughly $0.18 and $0.28. That means double-digit percentage swings can happen quickly, even without a major fundamental change.
After such a vertical rally, chasing every green candle becomes increasingly dangerous. A strong asset can continue higher, but the probability of sharp profit-taking also increases as early buyers lock in gains.
THE SUPPORT MAP HAS CHANGED
For me, the most important question is whether previous breakout areas can become support.
The first zone is $0.21–$0.20. Holding this region after the recent acceleration would be constructive because it would show that buyers are defending the new higher price structure.
Below that, I would watch $0.18–$0.176. This area becomes much more important if the current momentum starts cooling. A controlled retracement into this region would not automatically destroy the larger rally.
The next deeper zone is around $0.15. Losing that level with heavy volume would suggest that the market is moving from healthy consolidation into a much deeper correction.
VOLUME TELLS THE STORY
The volume expansion is one of the strongest parts of the current setup. Current market data places USELESS around $220M+ in 24-hour trading volume, showing that this rally is happening alongside substantial market participation rather than disappearing liquidity.
But volume needs to be interpreted together with price. If buyers continue producing higher highs while volume remains elevated, momentum can continue. If price repeatedly fails near $0.25–$0.26 while selling volume increases, that would be a very different signal.
THE OVERBOUGHT PROBLEM
Momentum indicators are another reason I would avoid blindly chasing the current move. Previous technical readings already showed RSI entering an extremely overbought area, while MACD and moving averages remained strongly bullish.
That combination tells an important story: the trend is strong, but the entry risk is also rising.
An overbought RSI does not automatically mean price must crash. In powerful momentum markets, RSI can remain elevated for longer than expected. The better signal is whether price starts losing support while momentum indicators roll over.
BULLISH SCENARIO
My bullish scenario is simple: USELESS holds $0.20–$0.21, buyers return with strong volume, and price reclaims $0.25 decisively.
If that happens, $0.26 becomes the first confirmation zone, followed by $0.30 and potentially $0.31–$0.312.
The key is not simply touching $0.25. I want to see acceptance above it rather than another temporary wick followed by immediate rejection.
BEARISH SCENARIO
The risk scenario starts if USELESS repeatedly fails around $0.25 and then loses $0.20 with strong selling pressure.
That could trigger a cooling phase toward $0.18, followed by the $0.15 area if sellers remain aggressive. Such a pullback would not necessarily erase the entire multi-week rally, but it would indicate that the parabolic phase is losing momentum.
MY CURRENT VIEW
At approximately $0.22, USELESS remains one of the strongest momentum charts to watch, but the setup has changed significantly from the beginning of the rally.
The data shows extraordinary seven-day performance, huge trading activity and a market that has already demonstrated its ability to move tens of percent in a single session.
For me, the three levels are clear:
$0.25 — breakout confirmation
$0.20–$0.21 — immediate support
$0.176–$0.18 — deeper trend support
Above $0.25 with strong volume, $0.26 → $0.30 → $0.31+ becomes the upside roadmap.
Below $0.20, I would become much more cautious and wait for the market to establish a new base.
USELESS is still bullish from a momentum perspective, but after a 250%+ seven-day rally, the biggest opportunity may no longer be predicting whether the next candle is green. The real test is whether buyers can convert the explosive move into a sustainable higher-price structure.
If $0.25 breaks and holds, $0.30 comes back into play. If $0.20 breaks, the market may need a serious cooldown first.
@Gate_Square
repost-content-media
USELESS+2.34%
  • 1
$400K to $145M on $STONK
$IOST Signal】4H momentum continuation, 1H low-volume pullback
$IOST 4H RSI above 90, MACD bullish histogram expanding, with price consolidating at elevated levels after breaking above the upper Bollinger Band. 1H MACD histogram narrowing, bid depth share at 0.44, with sell orders clearly dominant. Funding rate 0.01%, OI stable, with no signs of a liquidation cascade for now. The current price of 0.0007782 is within the recommended entry range, while the 1H low at 0.00073 forms short-term support. Dense selling pressure is concentrated at 0.00079-0.00080 above.
🎯Direction: Long
⚡Entry/limit o
post-image
IOST+24.22%
Load More

Join 40 M users in our growing community

⚡️ Join 40 M users in the crypto craze discussion

💬 Engage with your favorite top creators

👍 See what interests you

View More