



Share your thoughts
placeholder
Article
📉 Over a cup of coffee in the early session, $SOXL 's unrealized profit surged sixfold!
Entry: 101.31, MACD golden cross + holding above the 200-day moving average, decisively entering with 50x leverage.
$SAGA
Take profit: first target 122, second target 130; stop loss: 96.50.
Return: +629.82%
$Bull is coming
Trend: Semiconductors are driven by AI infrastructure. The golden cross on September 4 confirmed the bullish trend. Despite a pullback caused by disruptions in U.S. Treasury bonds, the medium-term uptrend structure remains intact. Three-times leveraged ETFs are highly volatile; followi
post-image
SOXL-6.75%
SAGA+20.69%
牛来+42.27%
August 11 Gold Outlook🔥 and Trading Recommendations
Yesterday, the gold market opened at 4404 in the morning session, then first pulled back to 4389 before fluctuating upward. After reaching a daily high of 4435, the market sharply retreated, hitting a daily low of 4312 before consolidating. The daily candle ultimately closed at 4317, forming a large bearish candle with a long upper shadow. Following this pattern, the daily chart shows two bearish candles sandwiching a bullish candle, so today's market is technically under pressure. In terms of price levels,
Rise first in the morning session,
post-image
XAU-1.81%
September 11 BTC Setup
BTC keeps breaking to new lows, making for a very unpleasant chart. It is currently in a sharp drop-and-rebound phase at high levels. The 30-minute MACD shows signs of the green bars contracting and DIF turning upward, indicating momentum for a short-term rebound and recovery. However, the broader bearish trend has not yet reversed. There is oversold rebound momentum in the short term, but the overall structure remains weak, with obvious overhead pressure from trapped positions. Going long is countertrend, so use a strict stop-loss and do not hold losing positions.
Entry
post-image
BTC-1.35%
1⃣After purchasing $uni last time, the whale added another 39,800 $uni one hour ago, nearly the same amount as three days ago, bringing the total to 323,000 worth $1.93 million
2⃣An $vvv address bridged $500,000 to Base and bought 19,600 $VVV in a single transaction via 0x, at an average cost of approximately $25.5
3⃣In addition, 2 million $uai worth $1.52 million were withdrawn yesterday
4⃣An address holding $1,571 worth of $slibnb deposited 795,000 $ASTER from Aster to BN last night, worth $559,000
5⃣An $ONDO multisig address received 25 million $ondo worth $9.44 million from the te
UNI0.00%
VVV+7.15%
UAI-22.36%
ASTER-2.37%
ONDO-2.28%
The short strategy at the 365-day moving average level, with the coin price at 82222, has multiplied the principal 11x in 8 days and successfully come to a close!
Subscription special price: 8.8, today only. Subscribe and get on board—the next big trade is being laid out!
post-image
  • 7
ready for a decade of dormancy?
just remember that ten years of dormancy can turn into something special after
RIP van winkle
post-image
Layout for Bitcoin, Ethereum, and Dogecoin
live-cover
LIVE1,498
solana:6UtY9iTZM5QZVrbzFnNaJntV7oySm9k97mvwnuZcxr would be healthy if we saw it
post-image
SOL-1.37%
#GateTop4MainstreamCEX
Holding the 4 spot globally in August 2026 backed by $40B in spot trading volume and $285B in futures volume reflects strong structural momentum for Gate. While spot trading maintains a consistent foundation, derivatives, high-yield structured products, and TradFi integration are driving its main growth.
1. RWA Perpetuals & Yield Innovation
The primary momentum engine in Gate’s derivatives volume is its aggressive expansion into Real-World Asset (RWA) perpetual contracts and tokenized real-world yields:
RWA Perpetuals Surge: Driven by record demand for tokenized treasur
post-image
  • 11
  • 1
Sandisk’s latest short on Silk Road has again captured over 100 points of downside. Getting the direction right is truly a game-changing lifesaver. The next move is still to short at high levels: short again on a pullback to around 1780, with a target near 1600! $BTC
BTC-1.36%
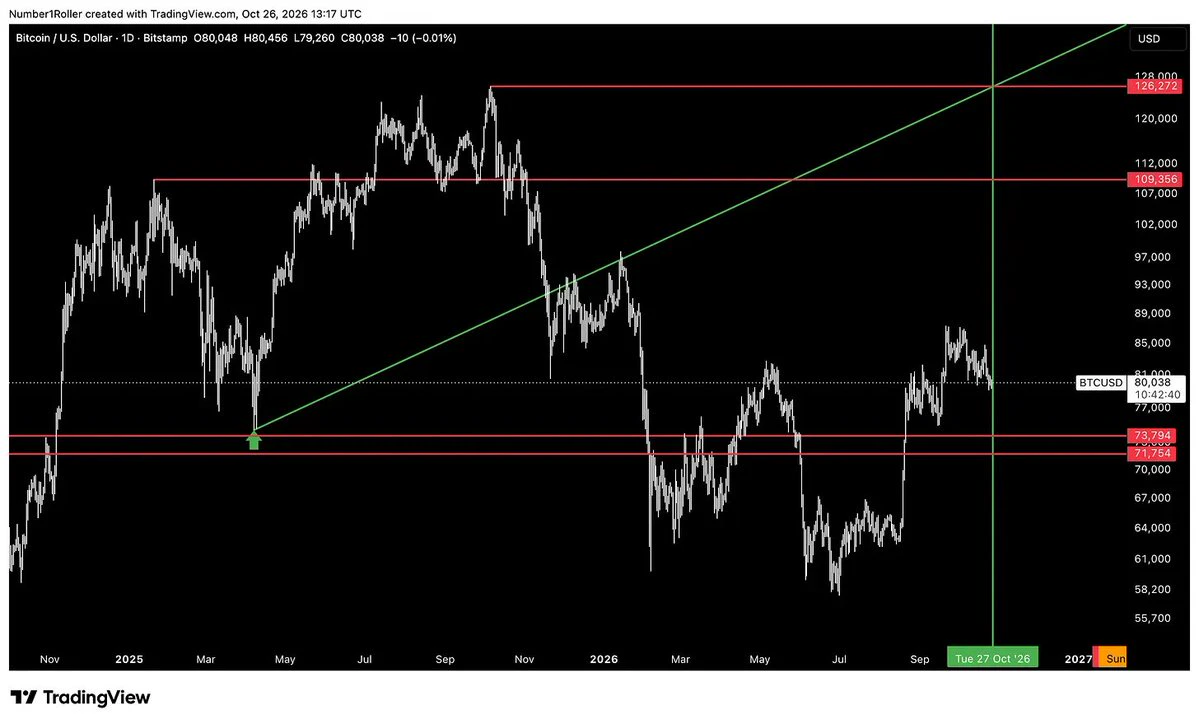
An analysis of BTC’s short-term trend based on Dow Theory, Chan Theory, Elliott Wave Theory, volume-price relationships, order flow, and price action (strategy recommendations)
Comprehensive assessment
Dow Theory shows that the short-term uptrend line has broken; the primary trend remains unchanged but has entered a correction
Chan Theory shows that the downward stroke (80,538→76,513) has greater momentum than segment a, with the price hovering below the lower boundary of the new central range [76,700, 77,550]
Elliott Wave Theory shows that the decline in wave ④-c has reached the c≈a target, a
post-image
BTC-1.36%
A monthslong selloff in government bonds is skidding into dangerous ground, pushing borrowing costs toward levels that some fear will finally damage the stock market and the economy
post-image
I was just about to go to the forum and rant, but then I looked at my account. Never mind—the market is always right.

When I checked the charts after lunch, $PROS ’s long position was still grinding along. I hadn’t had much hope for it, but then it started climbing on its own. From 0.3710 to 0.4719, +535.89% is right there—feeling good, brothers. This move was purely the market being in a good mood and casually tossing out some gold coins, which just happened to land on my head. It feels really great. It was truly sluggish before, but the result is truly sweet.

The market is the ultimate c
post-image
PROS+5.17%
XRP-2.50%
DOGE-2.11%
Warned you solana:6GihmsqNR21azuRuHgbjQxcDoxX7xgs58PQkyxpump is a rug pull
7MCgYMzq3fov6oERdtTMAYbN2U9LZrrSYS1MBhjixZFr
#crypto $sol
post-image
SOL-1.37%
$XAUT 9.11 Gold Outlook
Our strategy at the start of the week was to primarily short on rebounds. After the key level of 4360 was broken, any rebound would present another opportunity to short
The PPI data released last night came in above market expectations, further boosting market expectations for a Federal Reserve rate hike. The US Dollar Index strengthened on this, putting pressure on gold prices and driving them lower. After losing the 4360 level, prices continued downward and broke below this week's low
The market has remained range-bound for a long time, but finally broke in a directio
post-image
XAUT-1.78%
#USTreasuryToBuyBackUpTo6Billion US Treasury is set to buy back up to $6 billion of its own securities, a move that could attract significant attention across global financial markets.
Treasury buybacks are closely watched because they can influence liquidity, demand, and the overall balance of the government bond market. By repurchasing selected securities, the Treasury can help manage outstanding debt and improve the functioning of the market.
For investors, this development is important beyond the bond market. Changes in Treasury supply and liquidity can affect yields, the US dollar, risk a
BTC-1.36%
  • 6
Everyone watching HYPE right now is about to be proven wrong.

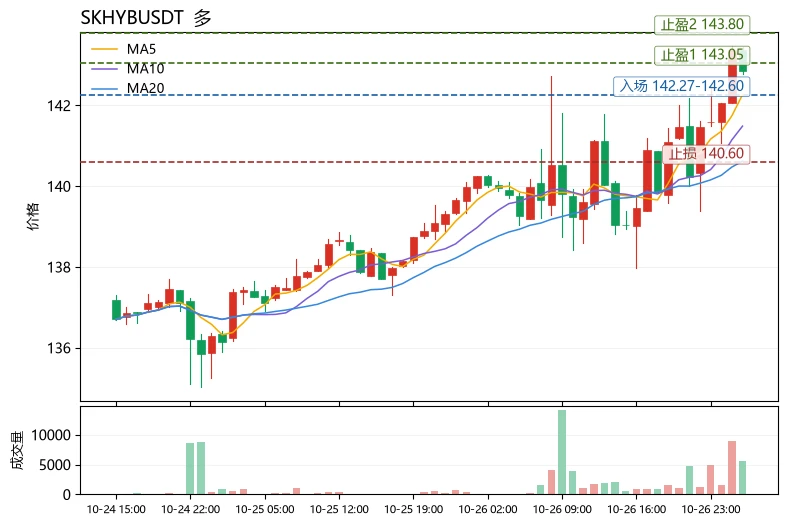
$HYPE /USDT - LONG

Trade Plan:
Entry: 78.872 – 79.418
SL: 75.740
TP1: 81.699
TP2: 83.401
TP3: 85.955

Why this setup?
Why now? The daily trend is bullish, and the 1h price is sitting at 79.145, perfectly inside the entry zone between 78.872 and 79.418. The 15m RSI has dropped to 34.77, signaling a sharp pullback that sets up a powerful rebound. The 1h ATR of 1.091326 shows the market is volatile enough to push from the entry all the way to the first target at 81.699 and then to the second target at 83.401. The line in the sand
HYPE-4.54%
A few days ago, my hand trembled as I set the stop-loss; this morning I realized that was unnecessary filial devotion.
The last thing I saw before bed a few days ago, $ZKC was still churning at a high level, looking like it was about to break out, but the volume was actually very weak.
The overhead resistance was obvious, and the rebound lacked strength. Every time it rose a little, someone dumped, with the lack of follow-through impossible to miss. I judged that the baiting of longs was heavy, and the short thesis remained intact; during the session, I just waited for it to expose itself.
Wh
post-image
ZKC-5.29%
ETH-0.22%
LAB-3.36%
#USStocksRecordSixthLargestWeeklyInflowSince2008 : What It Means for Markets, Investors, and the Road Ahead
Recent fund flow data has put US equities back at the center of global investor attention. Reports citing weekly fund flow statistics indicate that US stocks have recorded their sixth largest weekly inflow since 2008. That is a striking headline, not just because of the size of the number, but because of what it says about sentiment, positioning, and the broader appetite for risk. When money moves into an asset class at this scale, it is rarely random. It usually reflects a combination o
post-image
Load More

Join 40 M users in our growing community

⚡️ Join 40 M users in the crypto craze discussion

💬 Engage with your favorite top creators

👍 See what interests you