Square
Following
Hot
News
Notifications
Profile
Share your thoughts
placeholder
Article
On the 4-hour chart, $SOL short from 68.8. Sellers must hold here. Price is approaching resistance. I want to see a rejection wick, not sideways chop within the zone. If the close is above 69.7, I’ll abandon this idea. On the 4-hour chart, price is 68.8, below the 73.3 EMA50, so sellers remain in control of the trend. The stop distance is 1.3%, and the TP3 target distance is 2.1%, for a 1.6R risk/reward ratio if reached. Short zone 68.70–68.85 | Targets 68.24, 67.88, 67.34 | Stop 69.67 Not investment advice · Do your own research
post-image
SOL-0.77%
Why does $UNI always seem in a hurry to go somewhere else as soon as it reaches a decent price? Everyone waiting for it to break out can only watch it collapse again under pressure. Now sellers don't even have to try very hard.
Popular names:
$COOKIE : Current price 0.007962 - 24-hour change: +12.17%
$ETH : Current price 1,650.66 - 24-hour change: +5.81%
post-image
UNI+3.05%
COOKIE-2.21%
Trenches
IDOL
I
bade
b
IDOL
0x3b...ab07
Market Cap
$.
Change
.
24h Vol
$.
Holders
.
JAGENT
J
bade
b
JAGENT
0x8e...ae15
Market Cap
$.
Change
.
24h Vol
$.
Holders
.
PIEVERSE
P
bade
b
PIEVERSE
0x0e...25a9
Market Cap
$.
Change
.
24h Vol
$.
Holders
.
FIONA
F
bade
b
FIONA
B34n...pump
Market Cap
$.
Change
.
24h Vol
$.
Holders
.
mihao
m
bade
b
mihao
4Cxj...pump
Market Cap
$.
Change
.
24h Vol
$.
Holders
.
#USNOVJoblessClaimsBeatExpectations

WHY HIGHER JOBLESS CLAIMS DO NOT AUTOMATICALLY MEAN THE JOB MARKET IS BREAKING

A common myth in financial markets is that whenever weekly U.S. jobless claims come in higher than economists expected, the job market is suddenly collapsing and a recession is right around the corner. The reality is much more nuanced: in the U.S. Department of Labor report released on November 19, 2026, seasonally adjusted initial jobless claims edged up by 1,000 to 203,000 for the week ending November 14, above consensus estimates around 197,000 to 198,000, yet 203,000 is sti
  • 1
  • 1
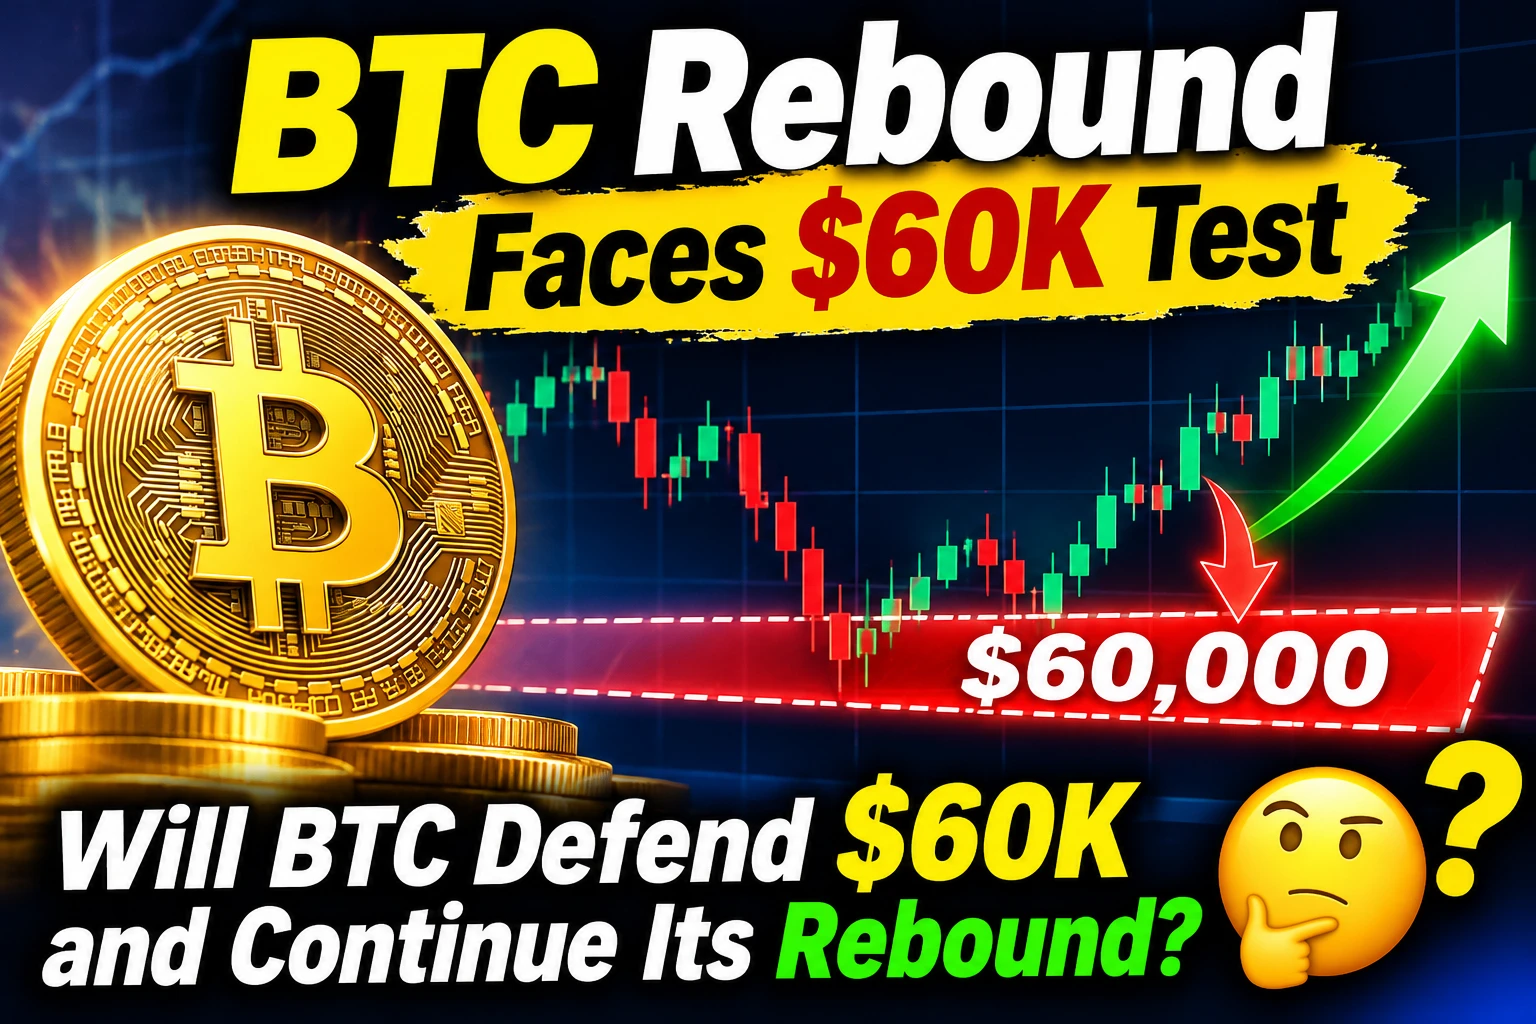
#BTCReboundFaces60KTest 📉 Bitcoin Rebound Faces a $60K Test

Bitcoin’s latest rebound is now facing a critical test as traders watch whether BTC can maintain its recovery or lose momentum.

⚠️ A move toward the $60,000 level could become an important support test and may determine the next major direction for the market.

📊 Traders are closely watching price action, trading volume, and market sentiment for signs of strength or another wave of selling.

₿ Will Bitcoin defend the $60K zone and continue its rebound, or could bears push BTC lower?

#Bitcoin #BTC $NVDA $SMCI ‌
post-image
NVDA-13.84%
SMCI-0.62%
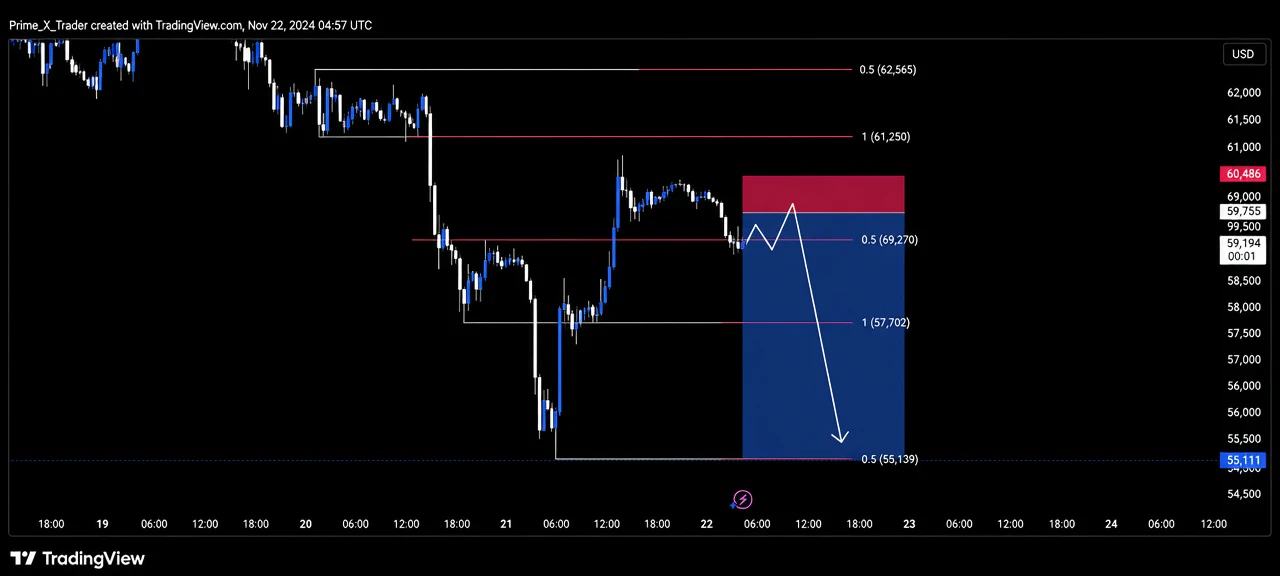
BTCUSD — SELL SETUP

Current Price: 59,194

Direction: Short / Sell

Entry Zone: 59,400 – 59,700

Take Profit Targets

- TP1: 58,500
- TP2: 58,000
- TP3: 57,500

Stop Loss: 60,200 – 60,400

Bearish Continuation Scenario

BTC is trading below the resistance zone, where I’m watching for a potential rejection. Price may attempt a short-term bounce toward 59,400–59,700 before sellers step back in.

If the resistance holds and bearish momentum returns, the downside targets are 58,500, 58,000, and 57,500, with further liquidity potentially sitting near 57,700 and 55,100.

The setup remains condition
post-image
BTC-0.67%
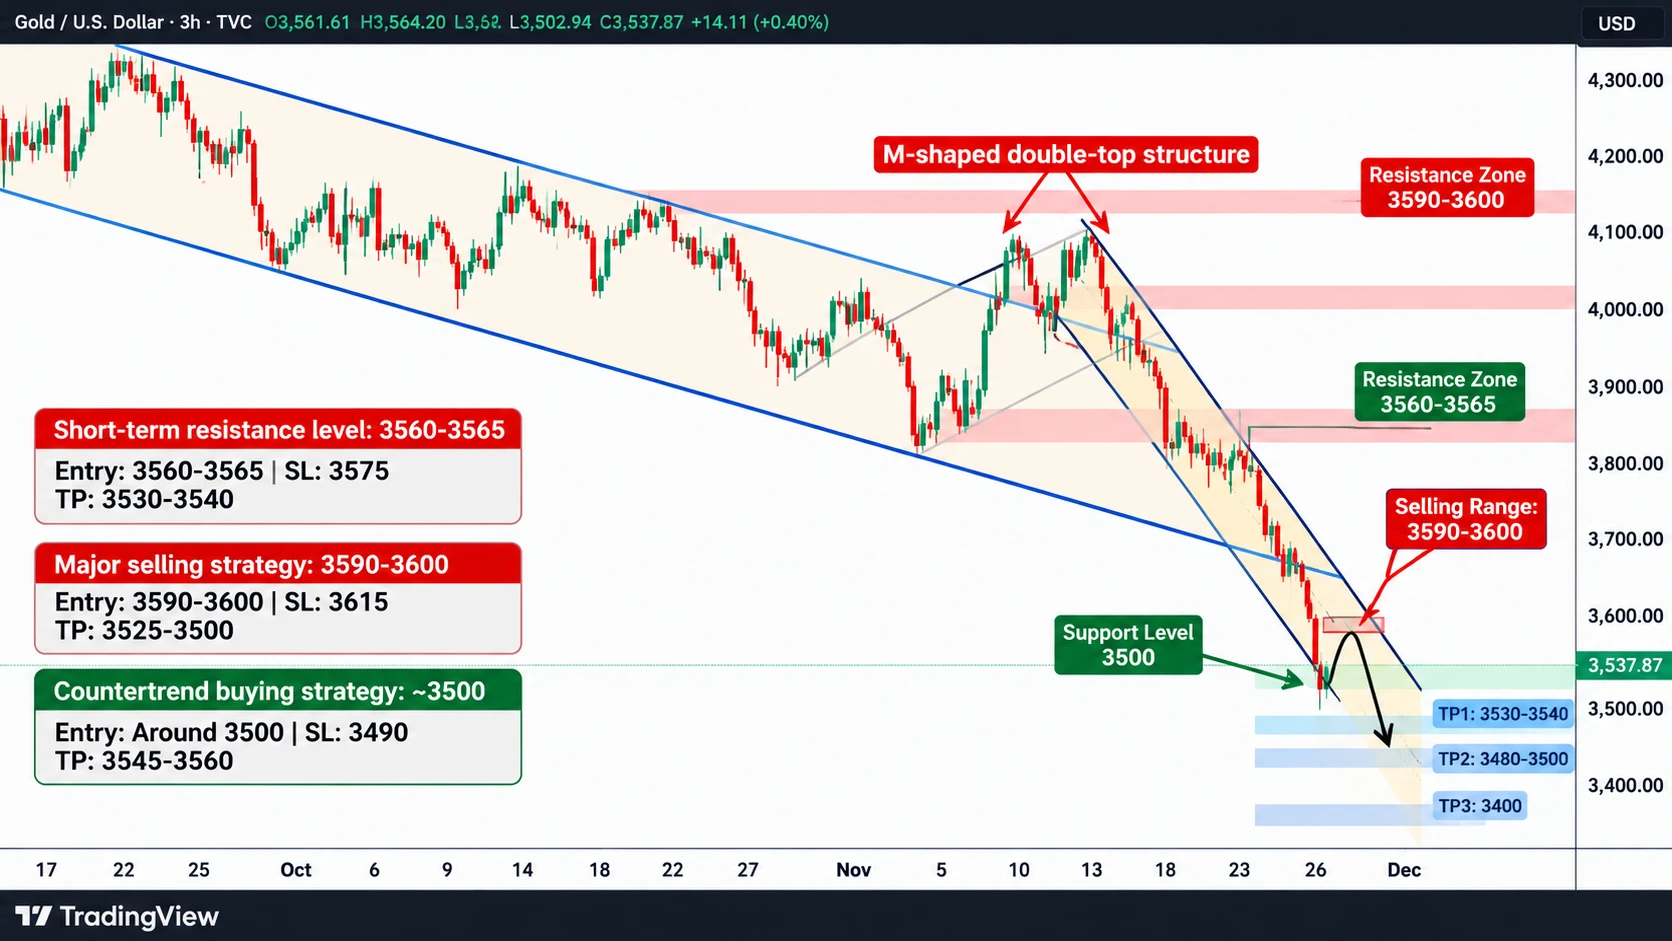
XAU/USD (GOLD) — Weekly Market Outlook & Trading Plan

Gold remains under bearish pressure following the recent sharp sell-off. The former support around 3600 has now shifted into a major resistance zone, making rebound selling the preferred strategy unless price reclaims this level with strong confirmation.

1\. Short-Term Sell Setup

First resistance: 3560–3565

* Entry: 3560–3565

* Stop Loss: 3575

* Take Profit: 3530–3540

If gold reaches this zone and shows rejection, a short position may be considered. If selling momentum accelerates below the target zone, the position could potentially
post-image
XAU+0.38%
#GateDirectIPOPhase3ANTAllocates92100Shares
Gate ANT IPO Access — The Allocation Is Done, Now Comes Price Discovery

The allocation is confirmed, but the real story now shifts from subscription demand to market price discovery.

Gate's Phase 3 Anthropic (ANT) IPO Access allocated 92,100 shares against a total subscription of 152 million USDT, with an issue price of 83 USDT per share.

The round was heavily oversubscribed, but the allocation rate was only around 5.03%, meaning subscribers received a fraction of their requested allocation.

What matters now?

The IPO Cross is the next critica
ANT-8.68%
SPCX-7.38%
$MAGMA Rejected once again, about to drop… Short now with 30x isolated margin leverage… 📉‼️Entry: $0.2470 – $0.2520Take Profit 1: 0.2400Take Profit 2: 0.2300Take Profit 3: 0.2250Final Target: 0.2145Stop Loss: 0.2620Click below to short $MAGMA …👇Strategy rationale: $MAGMA The 2-hour chart shows a pullback after a rapid price rise to around 0.2680. Sellers are starting to enter, and the price is struggling to hold above the 0.2520 area. If resistance holds and the price falls below 0.2400, it could drop further into the 0.2300–0.2145 range. MAGMA ShortSetup Bearish CryptoTrading
post-image
MAGMA-0.57%
Market update and trade with dragon fly official
live-cover
LIVE2,250
AKE+6.39%
SKHY+0.86%
BTC-0.65%
ETH-1.23%
ANT+0.00%
Goats can keep their balance on steep rocky ledges and at astonishing heights, making seemingly impossible leaps.
They navigate rugged terrain with precision, their hooves staying steady on nearly vertical slopes and loose rocks. This natural sense of balance lets them move with ease along cliff edges.
Netflix's SBF "Love Story" is so bad it crashed the market...
post-image
NFLX-2.87%
Above is you online.
Below is the real you.
post-image
#GateAnnualGala 🎉 Gate Annual Gala Is Here!

The Gate Annual Gala is bringing the community together for a special celebration of another exciting year in crypto! 🚀

🏆 From memorable moments and achievements to creators, streamers, and community members, the Gala is a chance to celebrate everyone who has been part of the journey.

✨ Stay tuned for exciting highlights, recognition, rewards, and unforgettable moments from the event.

💙 Let’s celebrate the progress, passion, and future of the crypto community together!

#Gate #GateAnnualGala #Crypto #Web3
post-image
#PCEAndGDPDataNextWeek

According to the U.S. Bureau of Economic Analysis schedule, both releases arrive on Wednesday, November 25, 2026, at 8:30 AM Eastern Time. That double-header puts fresh growth and inflation numbers directly in front of markets ahead of the December 8–9 Federal Reserve meeting.
📊 WHAT HAPPENED

In the prior PCE release covering September 2026, headline PCE rose 0.5 percent month-over-month and 3.6 percent year-over-year, while core PCE—which leaves out volatile food and energy prices—rose 0.3 percent on the month and 3.1 percent over the year. Meanwhile, the advance e
BTC-0.67%
  • 2
  • 1
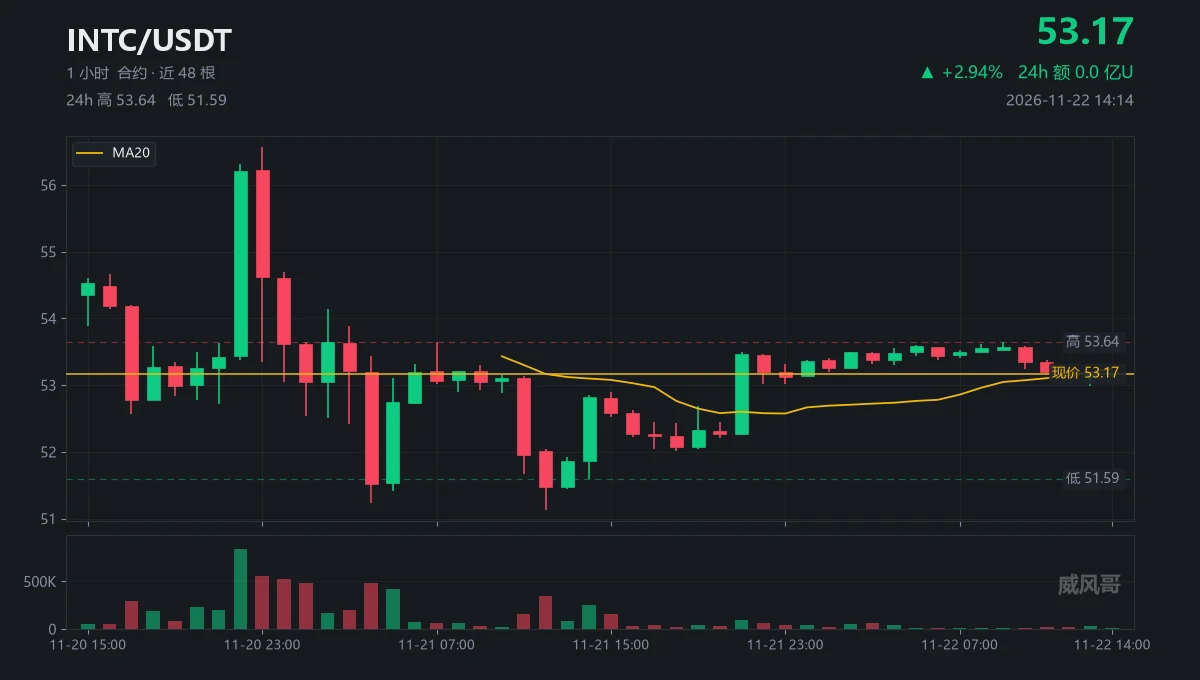
Someone asked me whether 53.5 could hold.
I said to first look at how many times it was tested.
Yesterday at 21:00, it tested 53.5.
Today at 09:00, it tested 53.64, 14 points higher than yesterday.
Then what.
At 10:00, the high was 53.59.
At 11:00, 53.37.
At 12:00, 53.28.
At 13:00, 53.18, while volume was actually the highest in this stretch at 31k contracts.
The highest-volume candle made the weakest move.
$INTC The chart shows 53.17; right now, it’s 53.22, with MA20 at 53.25 still overhead.
My answer: Let’s see if it can get above that level; if it can’t, it’ll just keep grinding.
(Not inves
post-image
INTC+0.05%
  • 2
  • 2
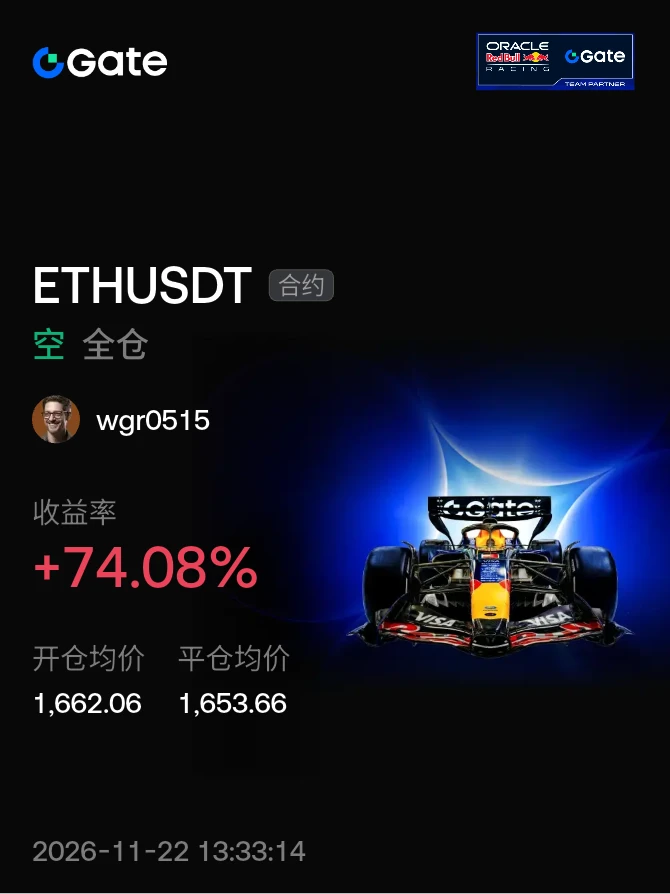
#晒出我的合约收益 The market is currently highly volatile, and the rebound is driven more by short covering after leveraged liquidations and oversold buying than by a fundamental improvement in spot demand. Do not mistake the rebound for a reversal; before the trend is clear, controlling position sizes and avoiding high leverage are the top priorities.$ETH
post-image
ETH-1.23%
🔹 X renowned trader mk4 closed out BTC short positions, capturing nearly $7,000 drop
live-cover
LIVE1,750
NVDA-13.84%
TSLA-7.56%
AAPL-1.83%
META-5.82%
SKHY-13.06%
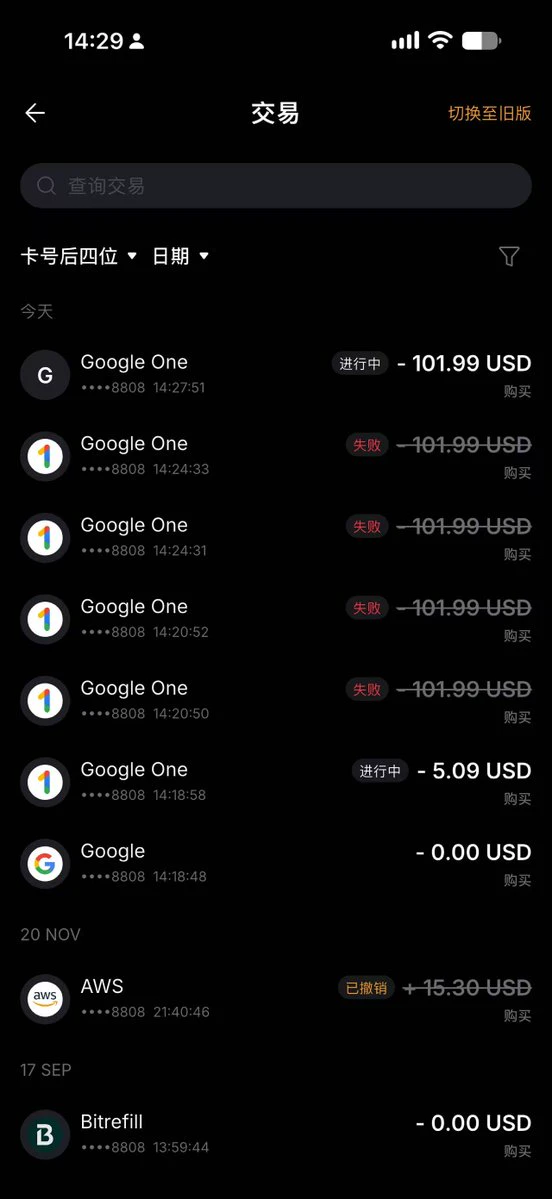
Used a U card to sign up for a year of Google Pro on Black Friday. Let’s see how the Hachimi model performs,
post-image
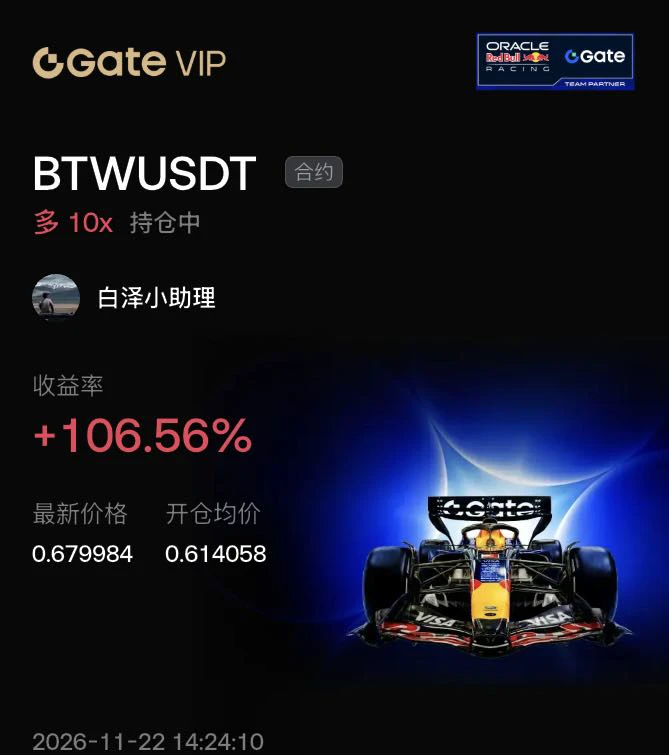
$BTW This is its heaviest overhang.

Total supply is 10 billion tokens, with about 1.51 billion in circulation—just 15%. Its market cap based on circulating supply is only around $1 billion, but based on total supply it’s $6.8 billion, more than 6 times higher.

Of the 85% not yet released, the portions allocated to the team, investors, and ecosystem are still being unlocked monthly. Each unlock adds another batch of extremely low-cost tokens to the market. This happened in October: as soon as an exchange holding campaign ended, it fell 49% before later rebounding.

There’s also heavy overhead
post-image
BTW-7.75%
AKE+6.39%
  • 1
  • 1
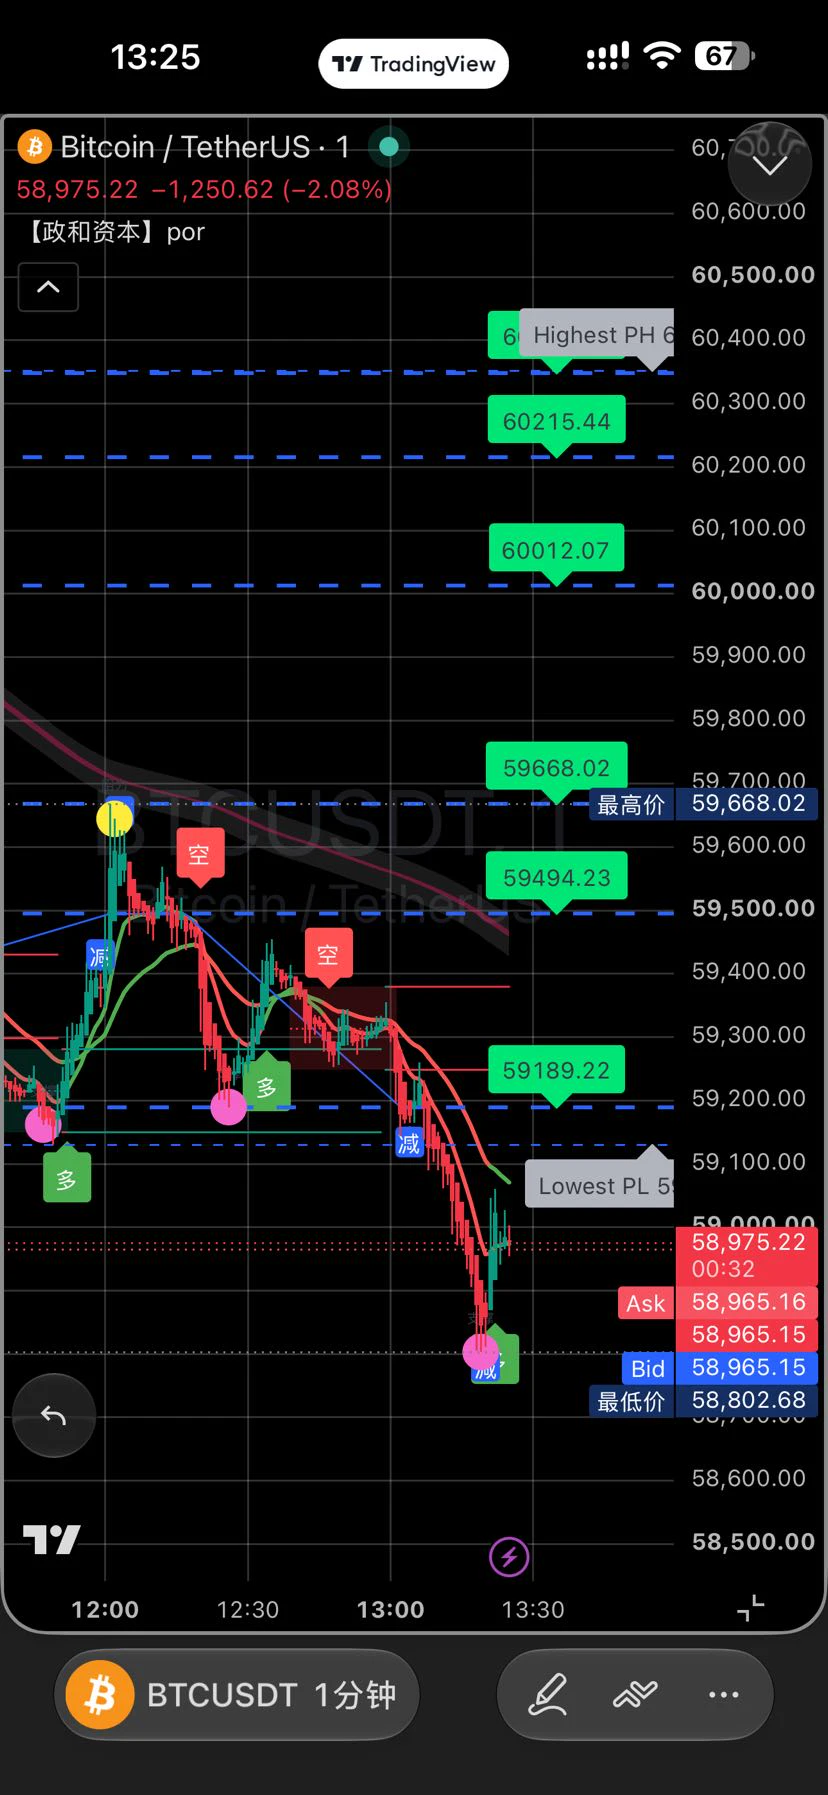
November 22, 2026 (Sunday) BTC Futures Analysis for Today (based on the current range of approximately $59,000–$60,000)
Key view (bearish, oversold rebound)
BTC has fallen sharply from above $75,000, touching near $55,000 over the past two days before rebounding to around $60,000. The daily structure remains bearish, and the RSI is in oversold territory. A short-term technical rebound is possible, but there is clear resistance above. Sunday liquidity is low, so the main strategy is to short rebounds, with buying support pullbacks as a secondary option; keep positions light.
Today's Strategy
1.
post-image
BTC-0.65%
Load More

Join 40 M users in our growing community

⚡️ Join 40 M users in the crypto craze discussion

💬 Engage with your favorite top creators

👍 See what interests you

Trending Topics

BTCReboundFaces60KTest

2.1M Views30.1K Discussing

BTC rebounded from around $55,300 on November 21, briefly reclaiming $60,000 before pulling back to around $59,300. The $60K level is back in focus as traders assess whether the recovery can last. Is this rebound a sign of stabilization or a short-lived recovery? Would reclaiming and holding $60K be enough, or do you need confirmation from trading volume and fund flows?

PCEAndGDPDataNextWeek

258.2K Views2.6K Discussing

GateDirectIPOPhase3ANTAllocates92100Shares

817.6K Views5K Discussing

View More