







Square
Following
Hot
News
Notifications
Profile
Share your thoughts
placeholder
Article
#StakeOnLaunchpoolToShare450KVLX Yield Optimization Protocol: Allocating Capital to the 450,000 VLX Staking Pool

The structural mechanics of wealth preservation during periods of high macroeconomic volatility require a disciplined shift toward non-directional, cash-flow-generating asset classes. As global equity indices navigate intense valuation resets and data-center sector adjustments, maximizing the capital efficiency of idle digital assets becomes a primary operational mandate. Recognizing this need, the official deployment of the Velas (VLX) Launchpool initiative introduces a high-viabi
post-image
VLX+0.00%
Q Long Alert 🤯 Q held support after the pullback. I'm going long here 👇Entry price: 0.02935Stop loss: 0.02825Take profit 1: 0.03027Take profit 2: 0.03118Take profit 3: 0.03210Click here to trade 👇⬆️⬆️ Join me in going long...👇⬆️ $Q
post-image
Trenches
ZIG
Z
bade
b
ZIG
0x8c...1145
Market Cap
$.
Change
.
24h Vol
$.
Holders
.
CLAUDIA
C
bade
b
CLAUDIA
2j5S...W2ZM
Market Cap
$.
Change
.
24h Vol
$.
Holders
.
STONK
S
bade
b
STONK
6GmA...UNgx
Market Cap
$.
Change
.
24h Vol
$.
Holders
.
IDOL
I
bade
b
IDOL
0x3b...ab07
Market Cap
$.
Change
.
24h Vol
$.
Holders
.
FLOAT
F
bade
b
FLOAT
Bv1a...BMmr
Market Cap
$.
Change
.
24h Vol
$.
Holders
.
A truly seasoned trader is not someone who gets it right every time, but someone who has a set of rules to control losses even when their judgment is wrong.

After entering the crypto market, many people continually look for more accurate indicators, better entry signals, and higher win rates.

But one question is often overlooked:

If your judgment is wrong several times in a row, can your account withstand it?

A complete trading risk management system should cover more than just stop-losses. It should encompass the entire process, from planning and execution to review.

Step 1: Define your
post-image
Can 20 consecutive profitable trades prove that a trading strategy works?

Not necessarily.

Without knowing the number of trades, the distribution of losses, the risks taken, and whether the strategy was repeatedly tuned, those 20 winning trades may not tell us much.

What really needs to be verified is not how much money the strategy has made, but whether it has an edge that can be repeated, explained, and tested.

I. Look at the sample size, not just the win rate

Suppose two strategies both have a 70% win rate.

Strategy A has completed only 20 trades, while Strategy B has completed 1,000
post-image
#Ahr999EntersBottomBuyingZone
𝗔𝗵𝗿𝟵𝟵𝟵 𝗙𝗮𝗹𝗹𝘀 𝗕𝗲𝗹𝗼𝘄 𝟬.𝟰𝟱 𝗮𝘁 $𝟳𝟱,𝟳𝟴𝟯: 𝗪𝗵𝗮𝘁 𝘁𝗵𝗲 𝗕𝗼𝘁𝘁𝗼𝗺-𝗕𝘂𝘆𝗶𝗻𝗴 𝗦𝗶𝗴𝗻𝗮𝗹 𝗠𝗲𝗮𝘀𝘂𝗿𝗲𝘀, 𝗪𝗵𝗲𝗿𝗲 𝗶𝘁 𝗦𝗶𝘁𝘀 𝗮𝗻𝗱 𝗪𝗵𝗮𝘁 𝗶𝘁 𝗖𝗮𝗻𝗻𝗼𝘁 𝗣𝗿𝗼𝗺𝗶𝘀𝗲
With Bitcoin at $75,783, the Ahr999 index is back in its bottom-buying zone. The index sat at 0.50 on October 25, touched 0.45 on October 31 and November 1, read 0.44 on November 3 and 0.45 on November 4, per CoinAnk. A price of $75,783 puts it at roughly 0.43 by my math. The signal is back after about 80 days outside the zone, since the previous stretch bel
post-image
BTC-0.67%
NVDA+2.80%
Will Black Monday happen again tomorrow? After the market suffered a brutal sell-off last week, traders are worried that Monday’s open could trigger another wave of massive selling. There are several reasons behind this concern: - Democrats won the election, putting greater pressure on AI stocks. - Concerns about a global AI bubble are intensifying. - The US is reportedly preparing a more limited strike against Iran. - Last week, the VIX posted its third-largest single-day gain in history. - Large funds are rapidly pulling out of AI-related debt investments. - Expectations of another Fed rate
post-image
ZEC+1.16%
BTC-0.67%
💰 Gate Square content mining rewards distributed (10.26 – 11.1)

All content mining rewards for this period have been distributed. Users can go to Assets → Spot Account to check their credited rewards.

Post on Square with a trading pair tag or trading card. Users can click to trade and earn up to 60% in trading fee rebates. Keep creating, keep earning.

View address: https://www.gate.com/social-mining-commission
Event details: https://www.gate.com/announcements/article/102544

‍#内容挖矿 #GateSquare
GateSquare
💰 Gate Square content mining rewards distributed (10.26 – 11.1)

All content mining rewards for this period have been distributed. Users can go to Assets → Spot Account to check their credited rewards.

Post on Square with a trading pair tag or trading card. Users can click to trade and earn up to 60% in trading fee rebates. Keep creating, keep earning.

View address: https://www.gate.com/social-mining-commission
Event details: https://www.gate.com/announcements/article/102544

‍#内容挖矿 #GateSquare
repost-content-media
  • 4
Why do some traders get the market direction right, yet still lose money?

You expect BTC to rise, and the price does rise.

You expect the market to fall, and it really does.

But when you check your account, your returns aren't as good as you expected—or you're still losing money.

What's going wrong?

Because getting the direction right isn't the same as making a profitable trade.

In real trading, there are at least five details that are easy to overlook.

1. You got the direction right, but your entry wasn't ideal

If you chase a move after the price has already risen sharply, the remaini
post-image
BTC-0.65%
🔹 Bitcoin Doesn’t Need Banks, but Strategy Wants to Become a Bitcoin Bank
live-cover
LIVE1,593
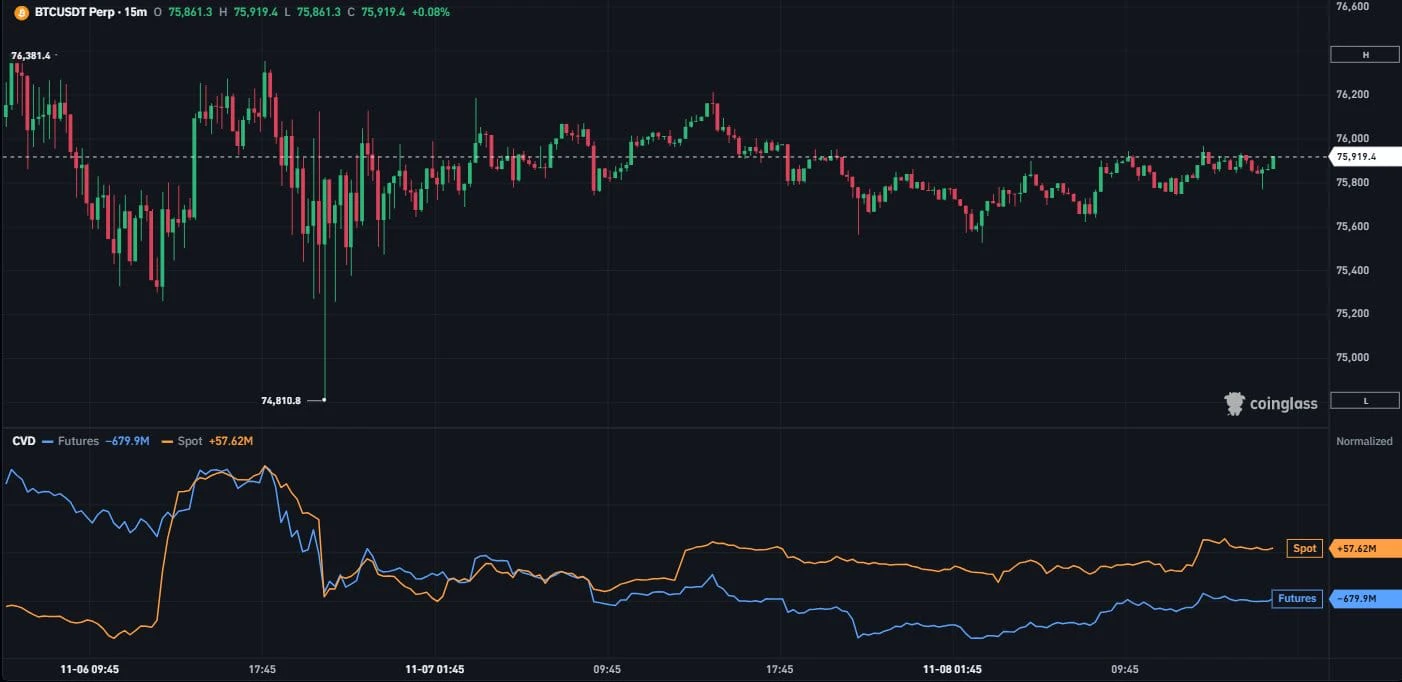
Spot has been bidding $BTC over the weekend.

But, perps are still shorting heavily here.

Until spot bidding accelerates, perps will continue to push Bitcoin down.
#ShareWeekly
post-image
BTC-0.67%
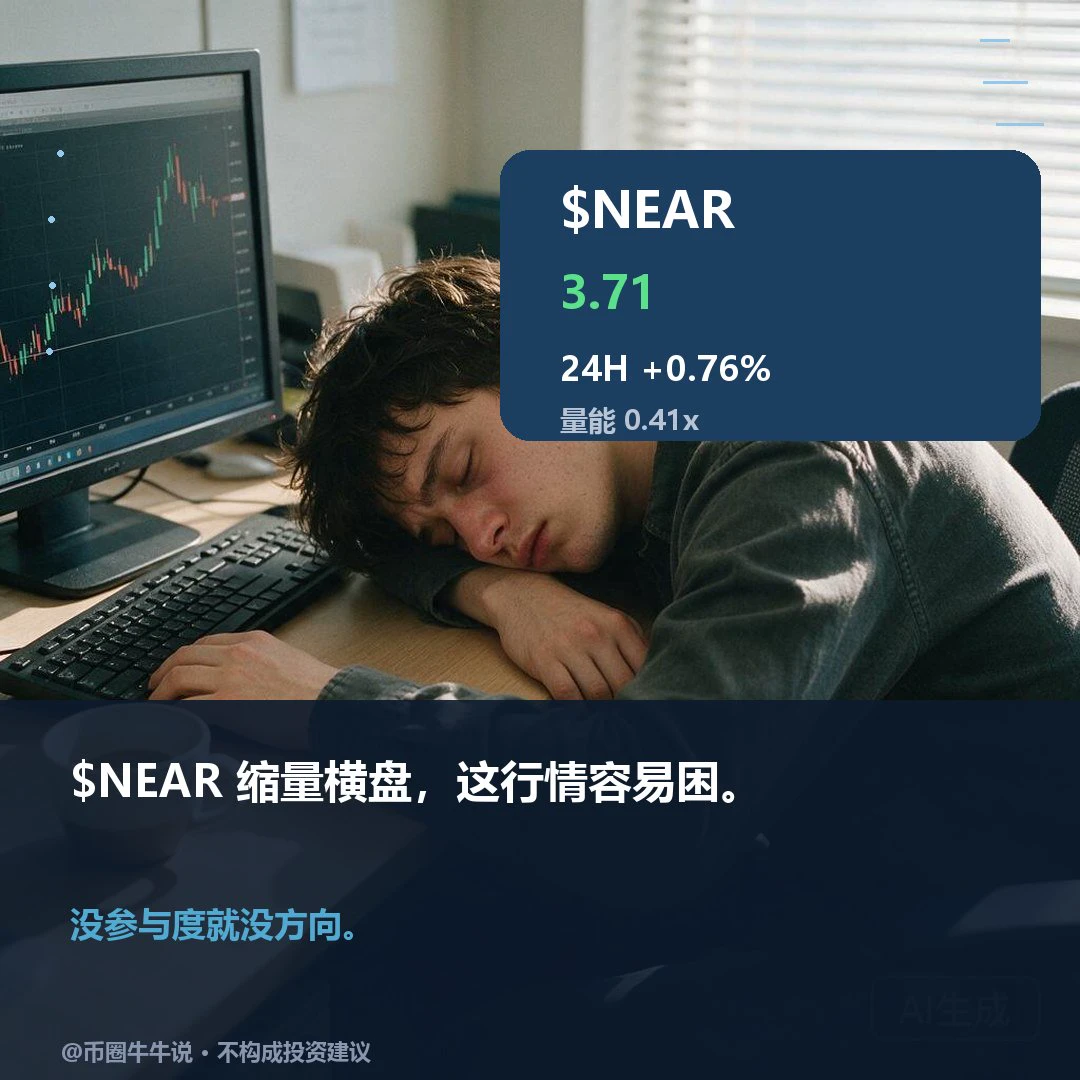
$NEAR Current price: 3.712, 24H +0.76% (3.621–3.746). 1H is relatively strong: RSI 54.67 / EMA20 3.7024, support at 3.621 / resistance at 3.746. 4H is relatively weak: RSI 52.06 / EMA20 3.7579, support at 3.621 / resistance at 4.192. The upside condition is holding above the 3.746 resistance; the downside condition is breaking below the 3.621 support. Review whether price can hold above 3.746 and recover if it loses 3.621; the setup is invalid without confirmation from market participation, with the volume ratio at 0.41x. Market volatility is high; for observation only.
post-image
@白月光888
Follow Bai Yueguang888's livestream and make gains
post-image
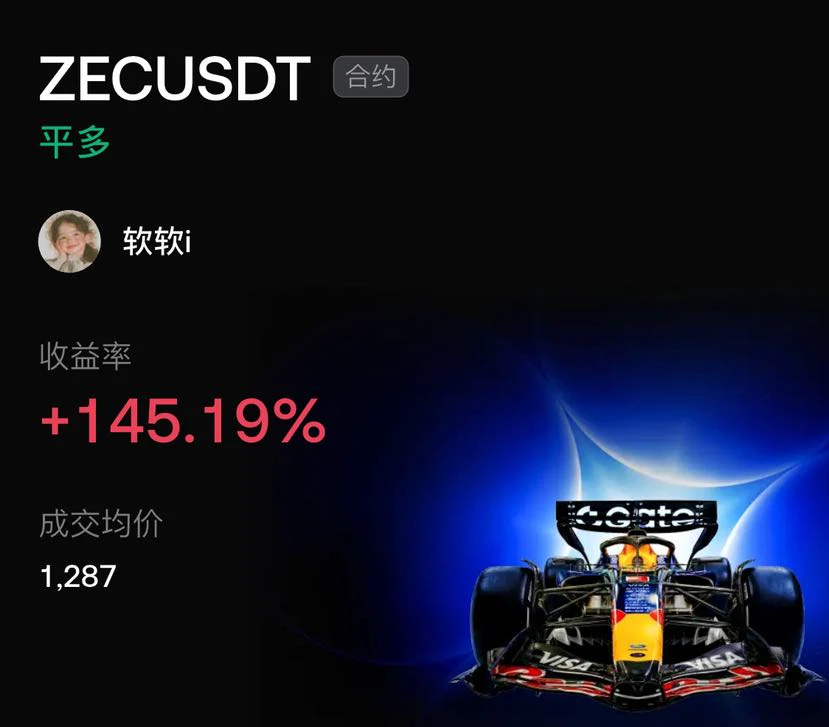
One of the more successful trades these past few days besides HYPE, earning both trading profits and funding fees
post-image
HYPE+0.33%
GT/USDT Analysis: Local Overheating vs. Long-Term Bullish Momentum 🚀 vs 📉

Current Price: 9.88 USDT
Timeframe Focus: 1H / 4H / 1D

Right now, GT is experiencing a strong short-term rally, but technical indicators suggest we might be due for a local cooldown. Here is the breakdown of what to expect next:

TECHNICAL PICTURE (Multi-Timeframe)

🔹 1H Chart (Short-Term: Correction Risk)
The 1-hour timeframe shows extreme overbought conditions. CCI is at a scorching 160.66, and the price is hugging the upper Bollinger Band. RSI is at 65.53. While MACD and Parabolic SAR remain bullish, the risk of
post-image
GT-2.41%
ONDS (Ondas)'s cheap range is 4.89--3.8, with the low reaching 4.38. The lower it goes, the cheaper it gets, and the cheaper it gets, the better the future gains. Figure 2 shares my view. ​​​$ONDS ‌
ONDS+0.20%
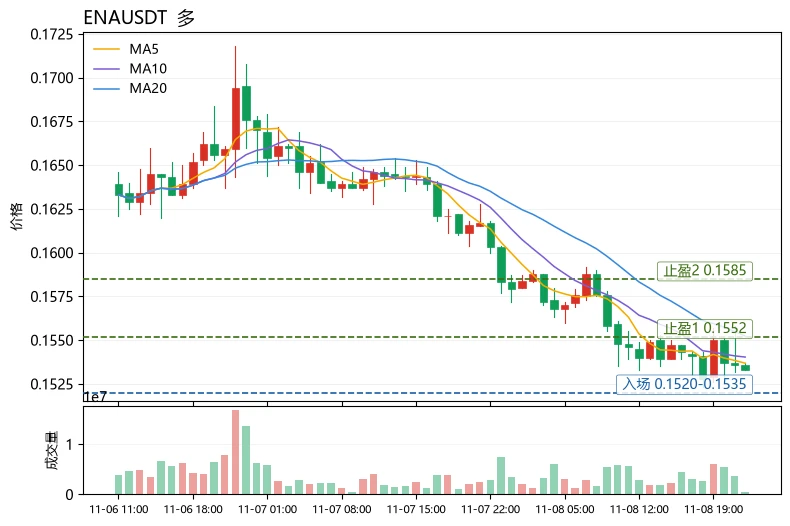
$ENA Current price: 0.1533. The first resistance above is the Bollinger upper band at 0.1585 and MA20 at 0.1552; support below is the Bollinger lower band at 0.1519. The current price is between MA5 at 0.1537 and MA20 at 0.1552, with the moving averages in a bearish alignment. RSI is only 35.3, indicating a weak range; however, the MACD histogram has turned positive at +0.0001458, showing signs of short-term momentum divergence. Meanwhile, the funding rate of -0.0104% indicates crowded shorts, leaving room for a short squeeze rebound. The Fear and Greed Index is at 28, in the fear zone, and th
post-image
ENA+8.12%
QNT+4.79%
UNI+3.05%
🔹 Bitcoin Doesn’t Need Banks, but Strategy Wants to Become a Bitcoin Bank
live-cover
LIVE1,308
$PONS Down 14% in a day, with the low of 0.1617 just one point below the current price. This isn’t a pullback—it’s the bulls’ defenses being picked off one by one. I’m a disciplined buy-the-dip, sell-the-rally trader: plans, not emotions. Let’s put the levels on the table first.
Plan first: scale in between 0.158 and 0.163, with the initial position capped at 30%. If it breaks below 0.155, stop out immediately—no holding on and no averaging down. First take-profit target: 0.178; second target: 0.188–0.190, the previous-high resistance zone. Trim at those levels; don’t get greedy. Position disc
PONS+4.32%
Load More

Join 40 M users in our growing community

⚡️ Join 40 M users in the crypto craze discussion

💬 Engage with your favorite top creators

👍 See what interests you

Trending Topics

USCPIDataIncoming

9.57k Views1.61k Discussing

The U.S. October CPI report will be released on November 10 at 8:30 a.m. ET. September CPI came in at 3.7% year over year, and markets will be watching closely for signs that inflation is cooling, especially in core CPI. A softer-than-expected reading could strengthen rate-cut expectations, while hotter inflation may pressure risk assets through higher Treasury yields and a stronger dollar. How do you think this CPI print will move $BTC, U.S. stocks and gold?

USAIStocksHitHard

27.53k Views3.74k Discussing

USNonfarmPayrolls

52.04k Views4.47k Discussing

View More