
Square
Following
Hot
News
Profile
Share your thoughts
placeholder
Article
The opportunities truly worth watching are either continued buying support after holding above 87.84, or a quick recovery after returning to 78.17.
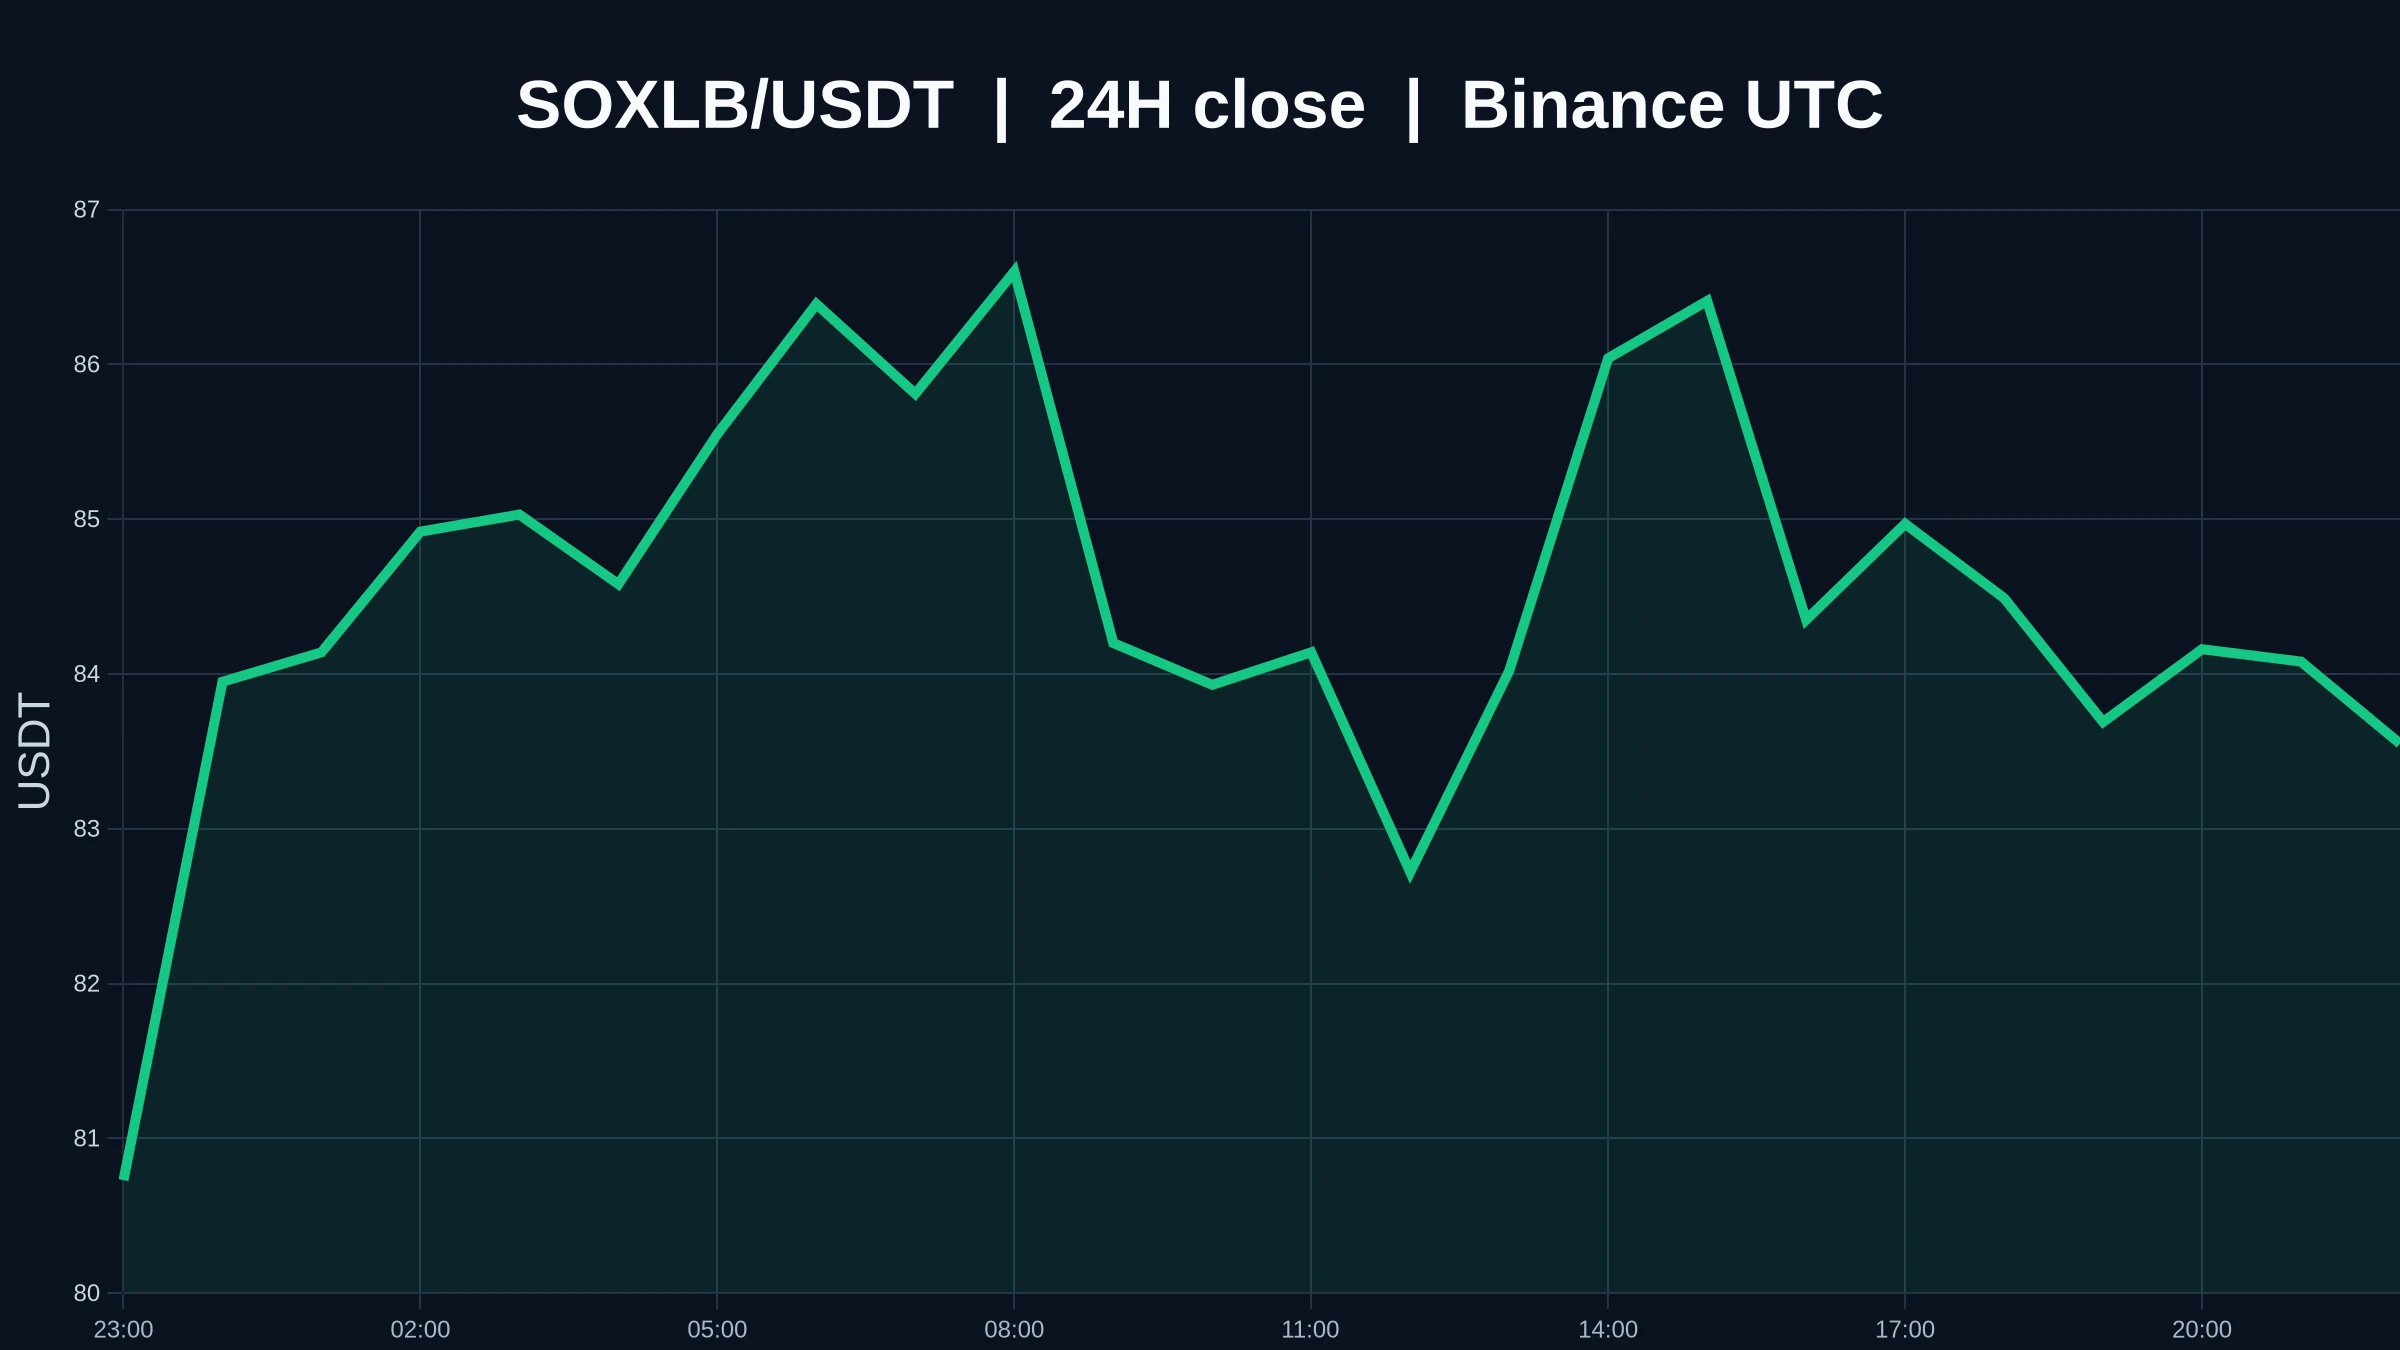
$SOXLB Trading participation is only 0.15x. The price is fluctuating around 83.51, while both the 1-hour and 4-hour directions are marked as weak. This divergence between direction and participation is the most unusual feature of this chart: the price is edging up on low volume, and the structure has not shown signs of strengthening. My view is that rebound demand has emerged, but the structure has not stopped weakening, so I would not treat overs
post-image
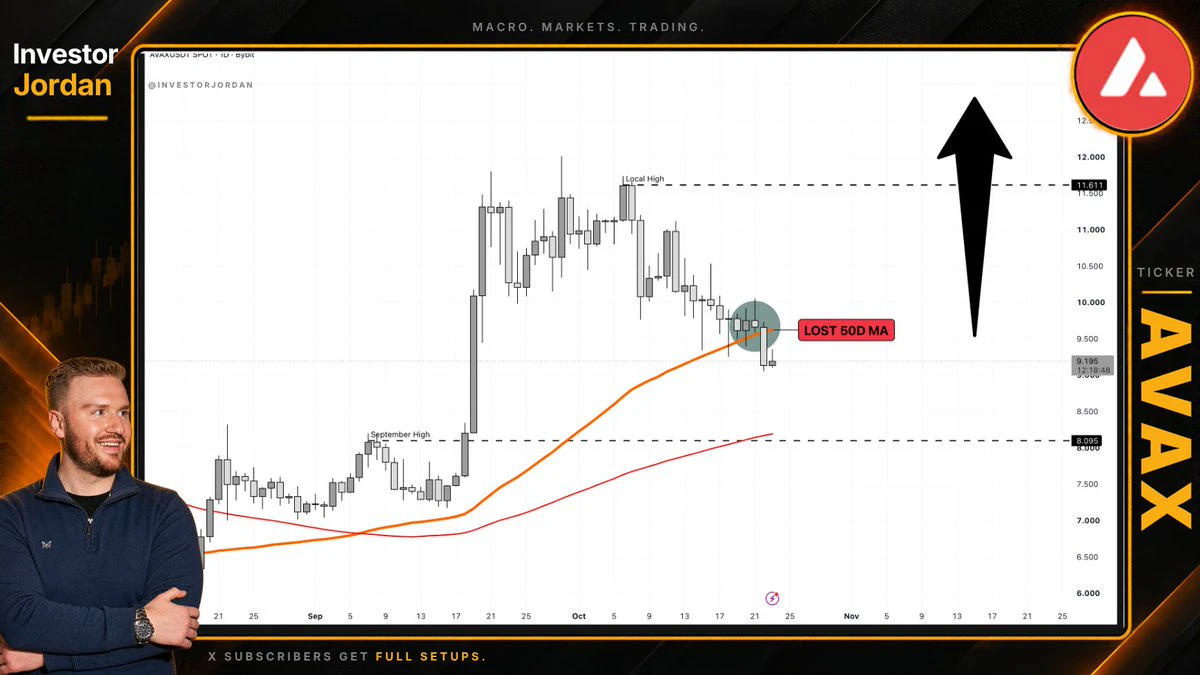
$AVAX lost the 50d MA 👀
same story as $btc, the whole market's taking a breather
this is where patience gets tested. But I think we all know where it's heading next 🚀
post-image
AVAX-0.81%
BTC-0.26%
Trenches
YMB
Y
bade
b
YMB
2TKD...pump
Market Cap
$.
Change
.
24h Vol
$.
Holders
.
AGT
A
bade
b
AGT
0x5d...e274
Market Cap
$.
Change
.
24h Vol
$.
Holders
.
CNPY
C
bade
b
CNPY
0xc6...ddd2
Market Cap
$.
Change
.
24h Vol
$
Holders
.
ZIG
Z
bade
b
ZIG
0x8c...1145
Market Cap
$.
Change
.
24h Vol
$.
Holders
.
TRUTH
T
bade
b
TRUTH
6bW6...pump
Market Cap
$.
Change
.
24h Vol
$.
Holders
.
Layout: Bitcoin, Ethereum, Dogecoin
live-cover
LIVE949
#USTechStocksSellOff #ShareWeekly
AI Stocks Under Pressure: Is the Market Losing Faith in the AI Boom, or Simply Demanding Better Returns?
Global financial markets are entering a critical phase as technology stocks face renewed selling pressure. The Nasdaq Index recorded its largest daily decline since June, dropping 2.6%, while semiconductor and artificial intelligence (AI)-focused companies led the downturn. Meta, NVIDIA, and AMD all suffered significant losses, raising an important question: Is this the beginning of a deeper correction, or is the market simply reassessing the cost of the A
NVDA-0.60%
AMD+1.79%
MSFT+0.56%
AMZN-0.97%
BTC-0.26%
Help 😂··· Can someone make him shut up···· Dear Mr. President, please stop making reverse trading calls 😂··· I’m dying···😂····
Who wants to go watch the kimchi movie with me?
post-image
🐸 PEPE: the meme coin drawing market attention again!
On October 23, Pepe (PEPE) was among the day's most prominent large-cap cryptocurrencies. Over the past 24 hours, the token rose approximately 8,90 %, with its price hovering near $0,000005. This move has renewed traders' interest in meme coins, which often react to shifts in sentiment faster than other assets. But behind a bright green candle, it's always worth seeing not only an opportunity, but also a risk.
📊 What should you know about PEPE?
• 💰 Price: around $0,000005 per 1 PEPE.
• 📈 24-hour gain: approximately 8,90 %.
• 🪙 Total su
post-image
PEPE+5.15%
MU+2.39%
  • 4
$MAGMA That guillotine candle came down and wiped six figures straight off my account. It plunged 24% in 24 hours, dropping from 0.5343 all the way to 0.3740, with the entire 196M in trading volume made up of bloodied positions. I chased a long at 0.47 for a very simple reason—the price had moved sideways near the previous high of 0.53 for three days, and I thought the low-volume consolidation was building strength. Instead, one bearish candle cut through three moving averages and broke support. I didn't execute my stop-loss at 0.44, hoping for a rebound, and waited until 0.39 to cut the posit
MAGMA-23.11%
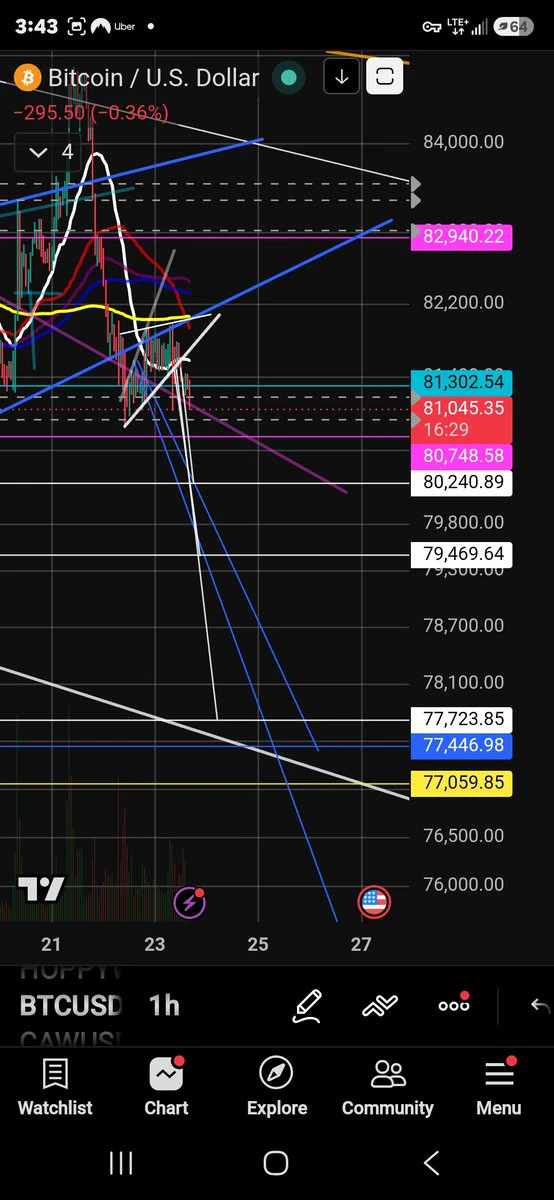
$BTC Breaking Down As Projected.
Price action could not get back over the 1hr 200MA. So price broke downwards as suggested.
NFA, DYOR ⚠️
#Crypto #Trading #BTC
post-image
BTC-0.26%
BR | Short 🔴 | Bearish | 15-minute, 24-hour: -6.64% | Volume: 47.0M USDT Short rationale: Price below EMA200; EMA20/50/200 are bearishly aligned; RSI14 is 35.9; MACD histogram is negative; ADX14 is 22.4; volume is 0.33 times the 20-candle average; trend pullback/continuation. Entry: 0.4813 Stop-loss: 0.505545 Take-profit 1: 0.450993 | Take-profit 2: 0.432809 | Take-profit 3: 0.408564 Entry price is for reference only; do not chase the trade. The strategy is invalidated if the stop-loss level is hit. Technical analysis strategy only; not financial advice.$B
post-image
BR-2.25%
Returning User Rewards
Claim 100 USDT on Return, Trade to Earn Up to 10,000 DOGE
https://www.gate.com/campaigns/6605?ref=A1VGVFAM&ref_type=132
post-image
DOGE-0.16%
  • 1
$SPY At 7,600, it’s still inching higher on no volume. This kind of rally is ridiculous—it’ll have to make up for the lack of volume sooner or later. Volvo is down 26%, and Russia and Ukraine are negotiating while still fighting. The fundamentals haven’t caught up. The more the index drifts higher, the less willing I am to chase it. Passive gains don’t mean blindly sitting back—you wait for a pullback on higher volume before getting in. I hope I’m wrong this time, because if I am, it means the rally still has legs.
post-image
My underwear watching me buy the bitcoin dip:
post-image
BTC-0.26%
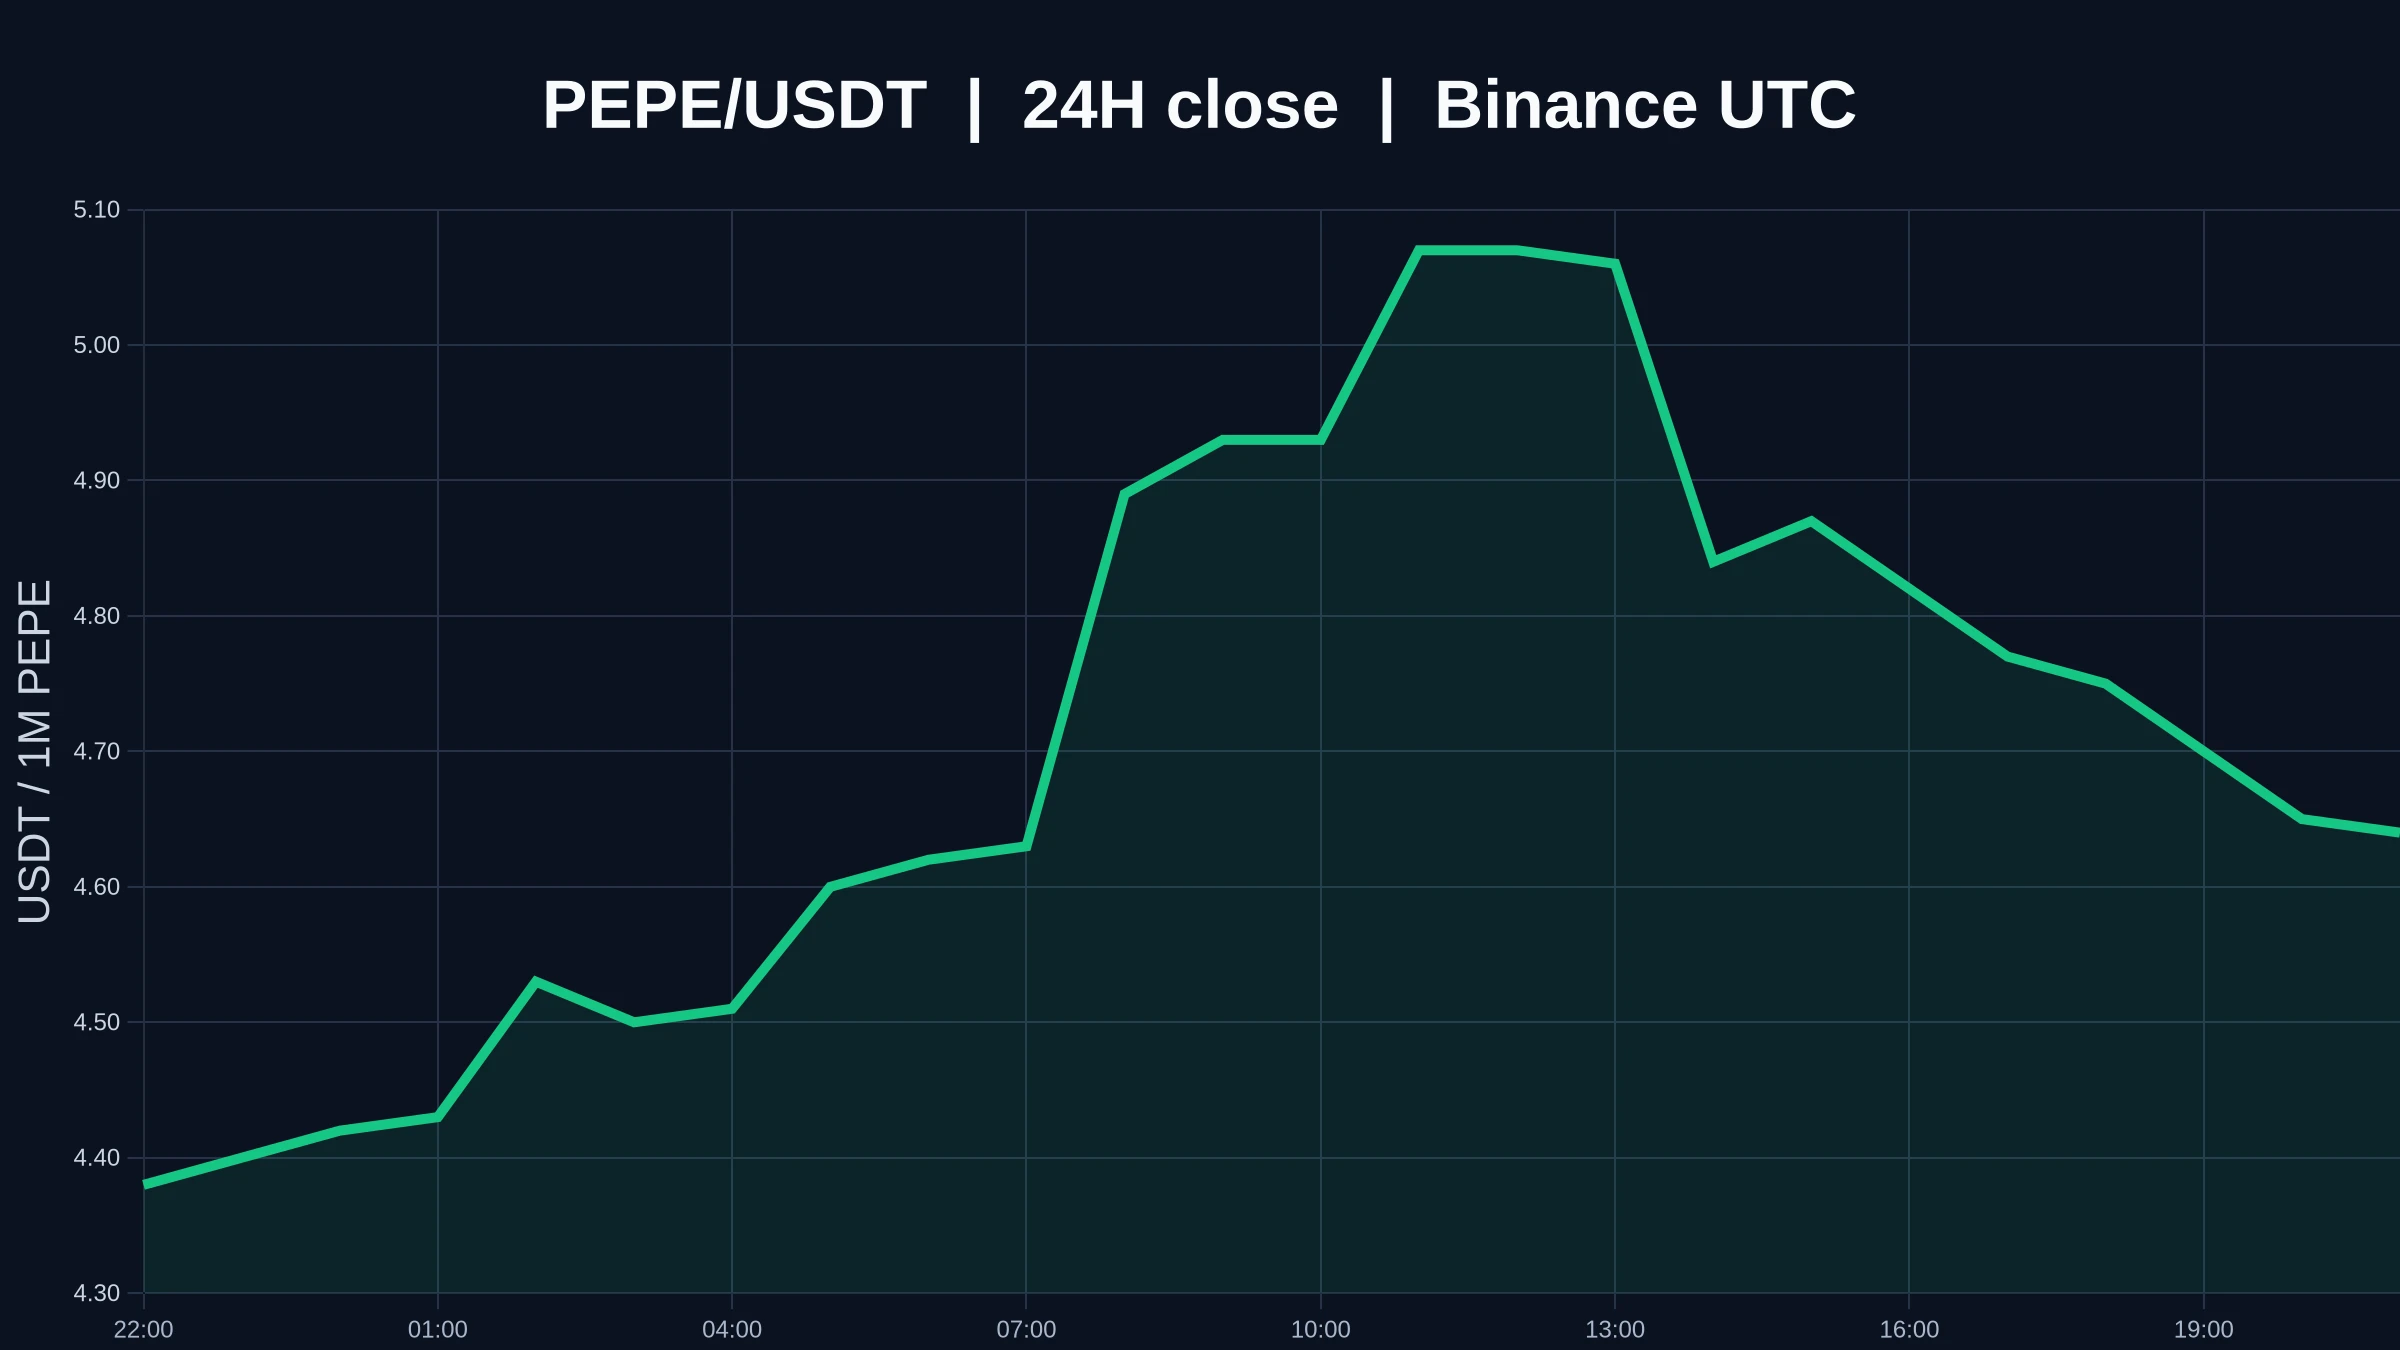
$PEPE The 1-hour direction is weak, while the 4-hour direction is strong, a rare divergence for PEPE. The current price is 0.00000463 USDT, up 4.99% over 24 hours, after reaching a high of 0.00000511 and falling to a low of 0.00000437. This divergence creates uncertainty between the short and longer timeframes. It reminds us not to rely solely on a single timeframe.
I’d rather view this as a direction that hasn’t been confirmed yet than rush to label it a rebound or a pullback. The current trend looks more like short-term volatility searching for direction within the broader timeframe. Without
post-image
PEPE+5.15%
I’ve gone long on $WIF
. Entry: 0.191 - 0.192; Take profit 1: 0.2007; Take profit 2: 0.2081; Stop loss: 0.1853. WIF is dropping into a multi-hour support level, with RSI below 10—the rebound potential is off the charts! Enter now. Keep an eye on $AGT and $SKHYNIX today.
post-image
SKHYNIX+5.16%
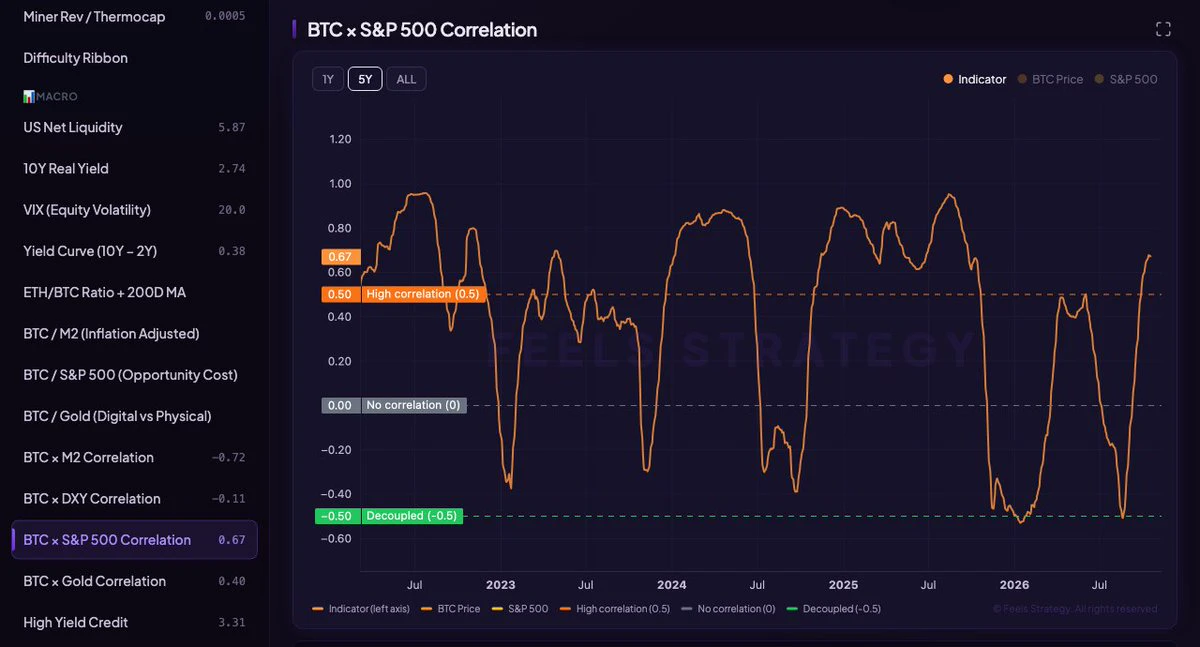
#Bitcoin × S&P 500 Correlation 📊
📝 $BTC correlation with equities is surging back toward local highs, reflecting heightened macro risk transmission across global markets.
📍 The metric has spiked to 0.67, firmly above the orange 0.50 high-correlation line after rebounding from deeply negative territory near -0.50.
💡 With the index moving as high-beta tech rather than decoupled money, traditional equity weakness near ~$81K remains the primary headwind. Stabilization in US indices is key.
post-image
BTC-0.26%
US500-0.39%
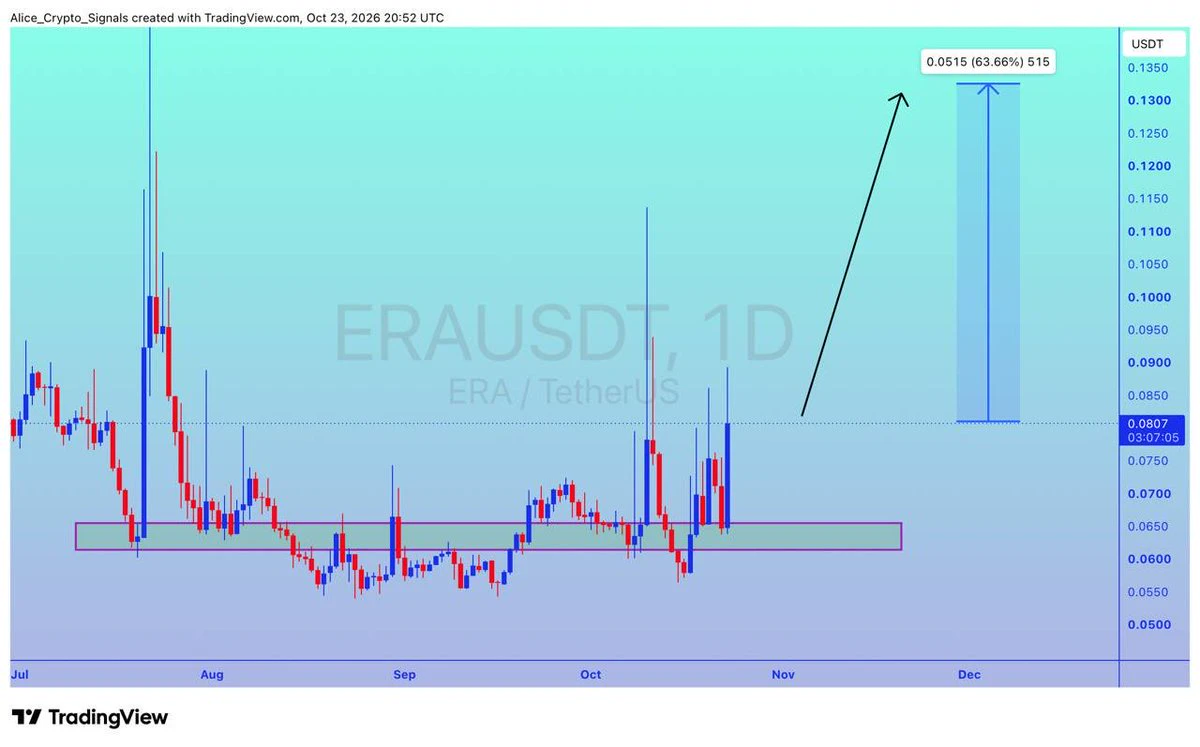
$ERA
UPDATE
#ERA is getting a good volume here. In this move we can see 60%+ gain here ✍🏻
#ERAUSDT #ERABTC #BTC #Bitcoin #NFTs
post-image
ERA+21.19%
BTC-0.26%
If $IRYS can rise sharply, $TUT can follow too. If you want to make money in this space, you need to learn to buy when prices are at their lowest. Like this post if you agree 👍 💯TUTPriceAnalysis
post-image
IRYS+269.62%
TUT-1.80%
crypto Night prediction
live-cover
LIVE2,123
Load More

Join 40 M users in our growing community

⚡️ Join 40 M users in the crypto craze discussion

💬 Engage with your favorite top creators

👍 See what interests you

Trending Topics

USEarningsSeason

23.47k Views2.98k Discussing

The U.S. Q3 earnings season is in full swing, with major tech companies including Tesla and Meta reporting results. Market focus is shifting beyond revenue and profit toward AI spending, capital expenditure, margins and forward guidance. Which company’s earnings are you watching most closely?

GateWCTCS9GlobalTradingCompetition

466.58k Views7.66k Discussing

BTCDropsBelow81000

132.75k Views38.16k Discussing

View More