



Share your thoughts
placeholder
Article
$USELESS I was able to hold this long position not because of market intuition, but because I had already written down the conditions before opening it. After entering at 0.15105, I set a stop-loss and left the rest to the market to validate. Today, it rose to around 0.26311, with the price action broadly matching expectations, and profits reaching approximately +3602.73%. As planned, I first reduced the position by 70% to lock in profits, then moved the protective level for the remaining 30% to around the entry price. No matter how it fluctuates from here, it will not affect the outcome of thi
post-image
USELESS+7.11%
LAB+2.03%
ZEC-0.66%
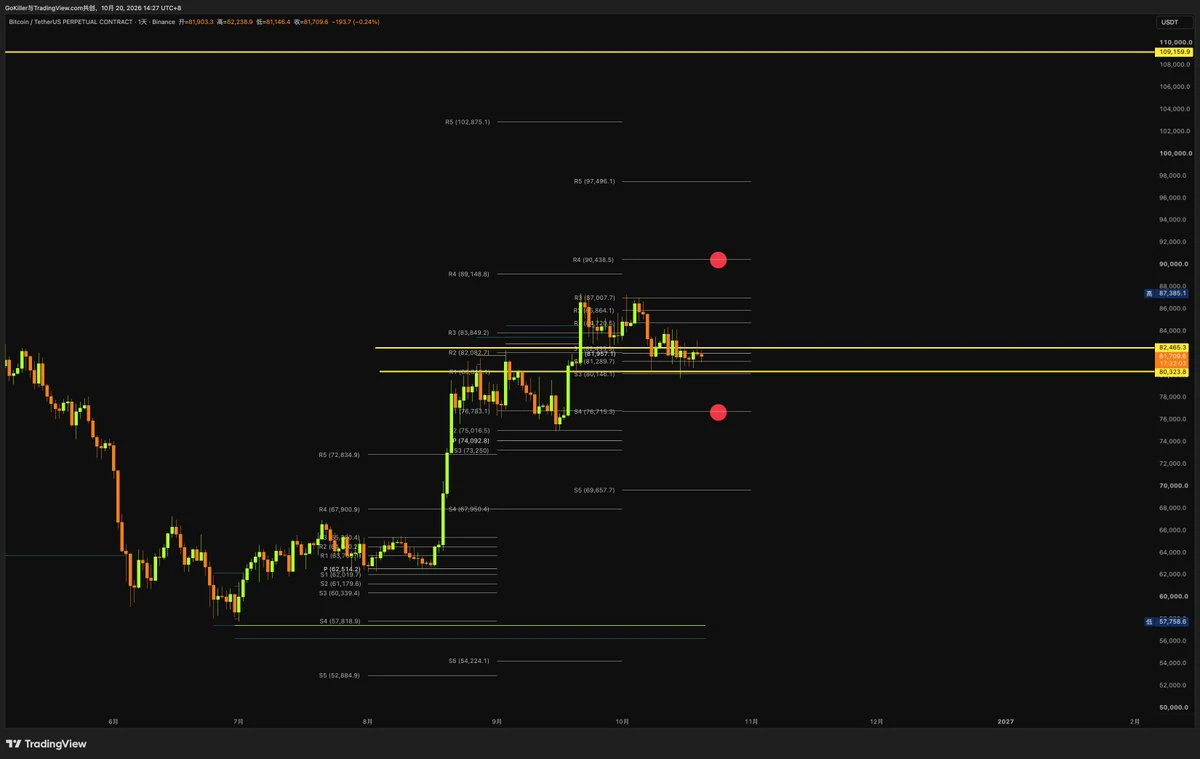
The probability of a Fed rate hike in September fell from 66% to 50% in just a few days. Fed Chair Christopher Waller sent a clear dovish signal, saying that if inflation slows further, he would support keeping rates unchanged in September. Bitcoin broke above $82,000, gold rose above $4,500, and U.S. stocks posted their biggest gain in nearly a month. What does such a sharp drop in expectations mean? How is the logic of crypto market pricing being reshaped?
$TSM
It may have survived the worst! The green zone was my entry/add zone
post-image
TSM+2.76%
Leverage magic unfolds, with $AKE long-position returns exceeding 11x.
The logic stems from an oversold rebound in early September; accumulation at 0.013 was followed by trend continuation as risk appetite recovered.
Technically, the price broke above its previous high, while the RSI is overbought. The 0.0189 support level is crucial in the short term, so chasing the rally is advised against. $ETH
AKE+42.64%
ETH+1.23%
$BTC Signal】1H volume contraction and pullback, funds defending the mid-band, buy-the-dip positioning
$BTC 1H volume on a single candle was 360.083 BTC, down approximately 94% from the previous round's 5951.489. The Bollinger Bands narrowed to 79347.938-79992.082, with the price fluctuating within the range. The 4H MACD histogram at -73.851 continued to decline, while the price held the 4H mid-band at 79576.620, indicating that buyers below have not retreated. The 1H MACD histogram was positive at 38.082, but not strong enough to drive a breakout. The order book Bid/Ask Ratio was 1.00, and th
post-image
BTC+0.17%
BTC MARKET UPDATES
live-cover
LIVE55
Most traders will ignore this 95% confidence SHORT until it's too late.

$LAB /USDT - SHORT

Trade Plan:
Entry: 0.07452 – 0.07498
SL: 0.07695
TP1: 0.07310
TP2: 0.07200
TP3: 0.07036

Why this setup?
Why now? The 1D trend is bearish, and $LAB /USDT is stalling at 0.07475—just above the invalidation line at 0.07428. RSI on the 15m sits at 50.03, showing zero bullish momentum. The 4h setup targets 0.07310 first, then 0.07200. If we lose 0.07428, the thesis dies—but that's a 0.6% risk for a 3.7% move down to TP3.

Debate:
Is the dip to 0.07200 the real play, or do you think 0.07475 holds as fak
LAB+2.03%
Gate hits 60 million users! Veteran users, don’t scroll away just yet—let’s see who entered earlier than you?
Gate’s global registered users have surpassed 60 million. Since the platform was founded in 2013, it has gone through multiple bull and bear cycles in the crypto market, and its business now spans digital assets, stocks, ETFs, payments, wallets, and Web3.
But anyone who has truly experienced these cycles knows that the numbers in your account are merely the result—the process is the story.
Some watched BTC charge ahead all the way, while others experienced altcoins doubling in a day an
BTC+0.17%
  • 44
Nobody’s watching LTC’s 4h chart—but the range is about to snap like a dry twig.

$LTC /USDT - SHORT

Trade Plan:
Entry: 53.73 – 54.03
SL: 55.28
TP1: 52.83
TP2: 52.13
TP3: 51.09

Why this setup?
Why now?
- Price is glued to 53.88, but 1D trend = **range**, not momentum. Ranges don’t last forever.
- RSI 15m at 42.08—already rolling over *before* a retest of range lows. That’s early weakness.
- ATR 1h = 0.58—volatility is compressed. When it expands, the move is violent.
- Short plan: entry 53.88, TP1 52.83, TP2 52.13. That’s a 1.7R to first target with SL 55.28.
- If 53.73 breaks,
LTC+7.69%
Join WLFI x Gate USD1 points program. Trade and hold USD1 to earn points. Redeem your points for exclusive Gate benefits and unlock future privileges. https://www.gate.com/campaigns/wlfi-USD1-stablecoin-rewards?ref=UFRFAQ0M&ref_type=160
post-image
WLFI+1.91%
USD1-0.01%
$MARSCOIN had to manually close my short position as current structure going back to bullish. Won't open any new ones for now as direction is unclear yet.
Gonna look for a new high to open long or break below 0.20 for short.
#MARSCOIN
post-image
MARSCOIN+26.89%
These returns are making me nervous, as if I’m afraid the market will come to its senses tomorrow and blacklist me.
During the intraday bottoming phase, $UNI /UNI oscillated around 4.828, and many people couldn’t hold on and handed over their chips. I took another look at the order book: each pullback to a key level was higher than the last, and funds quietly entered every time it reached a key level. This didn’t look like a breakdown was coming, but more like the final shakeout before a move up. Once I had thought through the stop-loss level, all that remained was to leave it to time.
The pric
post-image
UNI+16.74%
LAB+2.03%
ZEC-0.66%
This trend doesn’t even require me to think—the account is dancing on its own. When I checked the charts after lunch, the price-volume action was already looking off. The price was rising without volume, with no one stepping in higher; every push upward was just short of breaking through. I’m most wary of this kind of inflated-looking market, so I decisively followed the rhythm.

From 83.212 to 85.643, +207.44% secured—those already on board should be laughing in their sleep. I didn’t panic at all while everyone else was running, because the logic had been right there in plain sight: volume f
post-image
SNDK+1.73%
XRP+1.27%
Everyone’s staring at ONDO’s 0.371—but the 95% score says you’re early, not late.

$ONDO /USDT - LONG

Trade Plan:
Entry: 0.370 – 0.372
SL: 0.363
TP1: 0.377
TP2: 0.381
TP3: 0.388

Why this setup?
Why now?
- 4H bias is LONG with 95% confidence—the algo smells a breakout before the crowd does.
- Daily trend is bullish; pullback to 0.371 is the *last* cheap ticket before TP1 at 0.377.
- RSI 15m at 50.2 = neutral fuel, not exhaustion. ATR 1h (0.003465) shows tight coils—squeeze ready.
- SL at 0.363 is a 2% risk for a 4.5% ride to TP3 (0.388). Asymmetry is your edge.

Debate:
Are you ad
ONDO+4.24%
This trend is so obvious I don’t even need to think—the account is dancing by itself 😂 I had just finished reading the bearish news, and the market slid another notch, with the short side starting to perform on its own.
Before the market had fully kicked off, I already felt that the rebound was off. Several consecutive rebound attempts were all pushed back down, with what felt like an iron plate covering the upside; price and volume completely failed to keep up. This kind of low-volume rebound is the easiest way to trick people into taking the other side. I went short directly around 0.00787,
post-image
BTC+0.17%
XRP+1.27%
$AKE Signal】Long + Negative Funding Rate Short Squeeze
$AKE Funding rate -0.0437%: shorts are paying to hold positions, order book depth imbalance 8.13%, Bid/Ask 1.18. The 1H candlestick pulled back to EMA20 before bouncing with a lower wick; current price 0.01908 is near the Bollinger middle band. The 4H MACD histogram remains positive, RSI 63, with no signs of overbought conditions.
🎯Direction: Long
⚡Entry/Limit order: 0.0190228 - 0.0190800, current price can be entered directly
🛑Stop-loss: 0.0181260
🚀Target 1: 0.0205110
🚀Target 2: 0.0212265
🛡️Trade management:
- Upon reaching Target 1
post-image
AKE+42.64%
BTC+0.17%
ETH+1.23%
SOL+1.68%
$1000 to $100,000 Crypto Trade Challenge Today
live-cover
LIVE1,402
What rebound? This is CPR for my account, isn’t it? When the screen was glowing green, I was wondering: Can this market still be traded? Then, right after I finished reading the bearish news, $BZ was forcibly pulled from 92.57 to 96.44, giving me a slap in the face and telling me: Stop being stubborn—the trend is king.
The entry logic was actually very simple: the pullback held, and buying pressure strengthened. When it stops falling, it stops falling; both volume and price were hinting that someone was buying the bottom. While everyone else was running, I chose to look at the weekly structur
post-image
BZ+0.92%
LAB+2.03%
ETH+1.23%
Everyone’s long XLM, but the 4H clock just ticked against the crowd.

$XLM /USDT - SHORT

Trade Plan:
Entry: 0.18373 – 0.18449
SL: 0.18771
TP1: 0.18141
TP2: 0.17960
TP3: 0.17690

Why this setup?
Why now? The range-bound 1D trend is your tell—no momentum to break higher.
- RSI (15m) at 48.2: neutral, giving sellers room to push without overbought friction.
- ATR (1h) at 0.0015: tight volatility—perfect for a clean slide to TP1 (0.18141) and TP2 (0.17960).
- Entry at 0.18411 is armed; invalidation sits at 0.18203, so the risk is defined and tight.

Debate:
Is XLM faking the dip below 0
XLM+3.05%
I originally planned to cut my losses as a sacrifice to the heavens, but the ritual never happened—the meat roasted itself.
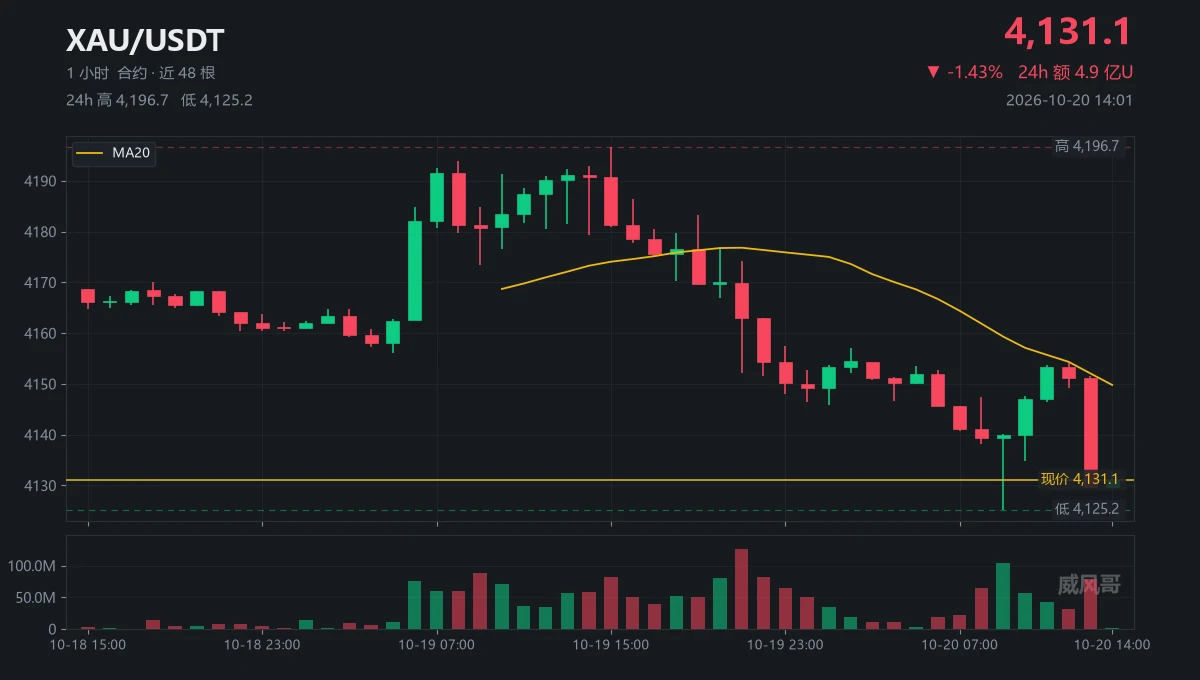
With green filling the screen, $XAU kept oscillating around 4474.29, while the sell walls grew thinner each time. There was clearly no big money looking to take the other side. The rebound lacked volume and support, so I followed the trend and entered a short.
I switched over casually and saw it had already dropped to 4438.98, giving me a full +72.11% on paper. That was real meat on the table. It dragged its feet earlier, but the result tastes just as good.
Take profits
post-image
XAU+0.09%
XRP+1.27%
BNB+7.26%
Load More

Join 40 M users in our growing community

⚡️ Join 40 M users in the crypto craze discussion

💬 Engage with your favorite top creators

👍 See what interests you

View More