Share your thoughts
placeholder
Article
This isn’t a rebound—it’s an IV line inserted into an account that was about to break.
When $ETHFI plunged during the session, it fell all the way to around 0.4789. Seeing the lower wick appear, I judged that the pullback could hold. While everyone else was running, I kept a long position. When I checked again after lunch, the price had already reached 0.58, with a return of +1501.96%. It took off.
Don’t grind away your patience in a range, only to try to regain your dignity in a one-way move.
Don’t let profits inflate, and don’t despair over drawdowns.
When you get the rhythm right, it really
post-image
ETHFI+1.51%
XRP-1.16%
BTC-0.84%
With this trend, I don’t even need to think—the account is dancing on its own. A few nights ago, I took a look at $BEAT before bed. The rebound stalled at 0.1345, a textbook weak rebound, with the price-volume divergence plain as day. I casually placed a short order and treated it as a little bedtime assignment. 😎
I woke up completely stunned: 0.1307, with +55.62% credited. It felt amazing. This move was purely the market being in a good mood and casually sprinkling some gold coins, which happened to land right on my head. The money you make is the monetization of your knowledge; the money yo
post-image
BEAT+4.06%
XRP-1.16%
BTC-0.84%
$PONS breaks all the previous records as daily trading volume reaches ATH at $919M 🔥
Welcome Robinhood Chain 🚀 🚀 @RobinhoodCrypto
post-image
PONS-11.98%
This trend doesn’t even require me to think—my account is dancing on its own. 🕺 Who would have thought that just a few days ago, during the repeated intraday swings, $SOXL was grinding around 116.25 and nearly made me question my life choices. Some people were calling for a collapse, but every time the price dipped, I saw buyers stepping in, with volume gradually increasing. The breakdown was purely meant to scare people. So while everyone was still watching from the sidelines, I quietly opened a long position.

Looking at it now, the price has reached 125.81, with a position return of +396
post-image
SOXL+1.44%
SOL-1.62%
ADA+0.18%
No big-picture thinking, can't hold; the profits this round are paper-thin, but I love it to death. Just after lunch, when checking the chart, $HEMI climbed back near 0.008967, with resistance sitting up there. Every push upward fell just short. One look at the trend and I knew it wouldn't break higher, so I shorted right away and waited for the pullback. 🍲

Now at 0.008731, +52.69%—this round wasn't for nothing. Everyone on board should be waking up with a smile. It feels really good. Time for a proper meal. With a trend like this, I don't even need to think—the account is out there dancin
post-image
HEMI-24.69%
ZEC-5.09%
BTC-0.84%
Guys, I have just opened a short position on $AVAX with 18x leverage....#AVAX is facing rejection after pushing above the recent resistance, giving sellers a chance to take control.
If price stays below $8.10, the downside could continue toward $7.90 → $7.76. A move back above $8.20 would weaken the setup.
Entry: $8.06–$8.10
TP: $7.90 → $7.76
SL: $8.20
post-image
AVAX+6.39%
$BCH ‌ 1H 📈
BCH is still holding a bullish structure, with the price above the Supertrend at $253.5. The recent push to $270 was rejected sharply, so this looks more like a pullback after resistance than a confirmed trend reversal.
Preferred Setup: LONG
Entry: $257–$260
SL: $253
TP1: $270
TP2: $276
TP3: $282
Key levels
• $253.5 → Supertrend support
• $260 → current pivot
• $270 → major breakout level
• $276–$282 → upside targets
The order book is noticeably bid-heavy, which gives the setup some support.
I’d avoid chasing the move. A hold above $257–$260 followed by a reclaim of $270 would g
BCH+1.65%
NVDA+0.87%
  • 4
  • 1
I was just about to go in and curse it out, but then I checked the account. Never mind, it can pump however it wants—I’ll keep quiet.

Opened the chart this morning, and $2Z climbed from 0.04895 all the way to 0.05112, with unrealized gains of +209.7%. The brothers on board must have woken up laughing, right? After putting me through such a long grind, the breakout feels really good.

My judgment at the time was simple: the key level hadn’t broken, funds hadn’t withdrawn, and a pullback was just handing us an entry. I’ve now taken 80% off the table, and moved the stop-loss on the remaining
post-image
2Z-1.07%
ZEC-5.09%
SOL-1.62%
This little bit of red has me panicking—I keep feeling that tomorrow it’ll come to its senses and kick me out. While everyone was still watching from the sidelines, $COOKIE hovered around 0.01112 for ages without breaking down. Volume wasn’t high either; it simply wouldn’t drop.
After the early-session dump, it was still pretending to be dead, but now it has moved up to 0.01143, with +61.79% unrealized profit. Have a strategy before the session, discipline during it, and reflection afterward.
I’ll take 80% off the table first, and move the stop-loss on the remaining 20% up to the entry price.
post-image
COOKIE-1.46%
ADA+0.18%
ETH-0.03%
Everyone is sleeping on a bullish daily trend for SYMBOL right now.

$NEAR /USDT - LONG

Trade Plan:
Entry: 2.2951 – 2.3215
SL: 2.1819
TP1: 2.4031
TP2: 2.4663
TP3: 2.5611

Why this setup?
Why now? The 1h price sits at 2.3083, perfectly aligning with the entry_ref inside the 2.2951 to 2.3215 zone, confirming a precise long trigger. The 15m RSI at 43.76 shows room to run before overbought, while the 1h ATR of 0.052662 suggests this move has real momentum behind it, not just a random bounce. The daily trend is bullish, and the structured targets sit at 2.4031 and 2.4663, with the line in the s
NEAR-4.08%
The hand that set the stop-loss a few days ago trembled slightly; this morning, I realized that was unnecessary kindness. A few days ago, before bed, I watched $AKE surge several times only to be pushed back each time. Every upward move fell just short, and the resistance above was obvious. I decided to short it, entered at 0.0187058, placed the stop-loss outside the safe zone, and forced myself to go to sleep.

When I opened the chart this morning, it had already fallen to 0.0158867, with +370.53% sitting on the books. The short position gave the answer directly. I didn't sleep soundly, but
post-image
AKE+6.93%
BTC-0.84%
ADA+0.18%
$H /USDT is about to break something everyone is ignoring

$H /USDT - SHORT

Trade Plan:
Entry: 0.0772 – 0.0780
SL: 0.0810
TP1: 0.0751
TP2: 0.0734
TP3: 0.0708

Why this setup?
Why now? The daily trend is bearish, the 1h RSI sits at 57.39 showing room to drop, and the 1h ATR of 0.001411 confirms the move is still active. The entry zone between 0.0772 and 0.0780 aligns with the 1h price of 0.0776, giving a clean short setup. TP1 at 0.0751 and TP2 at 0.0734 mark the next two targets on the path lower. The line in the sand is the invalidation level of 0.0785, because anything above it destroys
H+3.22%
Insiders are quietly stacking shorts on SYMBOL while the 1h price sits at 79121.1.

$BTC /USDT - SHORT

Trade Plan:
Entry: 79044.5 – 79197.7
SL: 79856.2
TP1: 78569.8
TP2: 78202.2
TP3: 77650.9

Why this setup?
Why now? The daily trend is range, which often compresses before a sharp move, and the 1h ATR of 306.299718 shows enough volatility to fuel a short leg. The 15m RSI at 49.4 is barely below neutral, suggesting the last dip did not exhaust sellers yet. The entry zone between 79044.5 and 79197.7 aligns with the 1h price, giving a precise trigger for a short. If price pushes to TP1 at 7856
BTC-0.84%
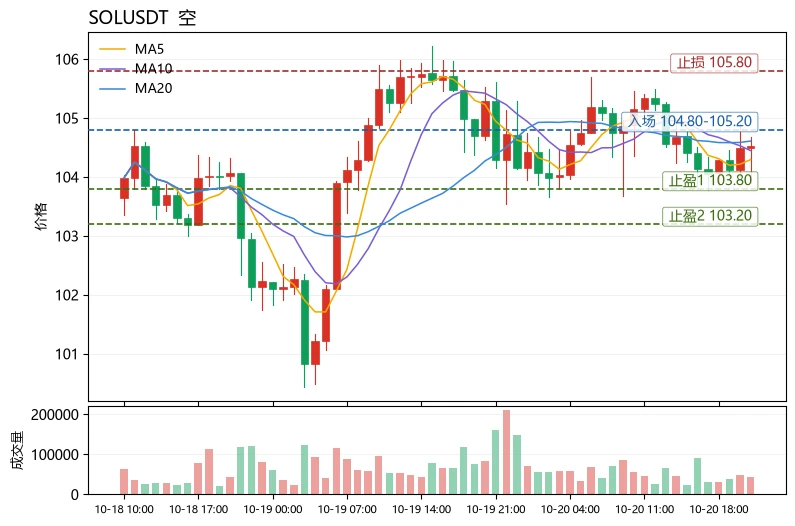
Why is everyone ignoring the obvious setup forming on $SOL /USDT right now?

$SOL /USDT - SHORT

Trade Plan:
Entry: 103.59 – 104.03
SL: 105.94
TP1: 102.21
TP2: 101.15
TP3: 99.55

Why this setup?
Why now? The 1h price is sitting at 103.81 inside a narrow entry zone between 103.59 and 104.03, giving us a precise short trigger. The 15m RSI reads 43.92, confirming momentum is leaning bearish without yet hitting oversold territory. The 1h ATR of 0.88701 tells us average hourly volatility is modest, so a break of the invalidation level at 103.78 will be a clean, low-whipsaw move. The daily trend
SOL-1.62%
Waiting for $ASTER when 🚀 🚀 @cz_
post-image
ASTER+0.27%
Range-bound $SOL /USDT is secretly setting up a short that most traders will miss.

$SOL /USDT - SHORT

Trade Plan:
Entry: 103.70 – 104.18
SL: 106.22
TP1: 102.23
TP2: 101.09
TP3: 99.38

Why this setup?
Why now? The 1h price is stuck at 103.94 inside a tight range, and the 15m RSI at 45.63 shows just enough bearish lean to favor the short side. The 1h ATR of 0.949491 tells us the current volatility is compressed enough for a decisive break lower. With the entry zone between 103.70 and 104.18, the daily range trend gives us a clean setup to target TP1 at 102.23 and TP2 at 101.09. The invalida
SOL-1.62%
Risk Management Tips for Crypto Traders
live-cover
LIVE1,119
Monthly Price Structure Changes Again! Can BTC & ETH Establish A Stronger September Trend?
live-cover
LIVE982
#vkfyo should make a thunderous comeback in September.
post-image
Load More

Join 40 M users in our growing community

⚡️ Join 40 M users in the crypto craze discussion

💬 Engage with your favorite top creators

👍 See what interests you

View More