Share your thoughts
placeholder
Article
🐋 WHALE WATCH : U.S. spot Bitcoin ETFs recorded $730.8 MILLION in inflows on September 3 the BIGGEST single day inflow in nine months.
Institutions also poured $2.8 BILLION into the ETFs during the final 10 days of August.
What is making institutions bet heavily on BTC recently ?
BTC-2.35%
【$Lobster Signal】Long | 1H Band Hugging + MACD Expansion Across Both Timeframes
$Lobster RSI 1H 86.14, current price 0.093252 hugging the 1H Bollinger upper band. The 16:00 candle touched 0.1027 before closing back at 0.0899, with overhead supply not yet cleared. The 17:00 and 18:00 candles both closed above 0.0930, with buyers retaking control. The MACD 1H histogram is 0.0017 and the 4H histogram is 0.0015, expanding in sync across both timeframes. The funding rate is 0.0777%, raising the cost of long positions. Sell orders slightly outweigh buy orders in the order book, but the price is hold
post-image
龙虾+19.27%
BTC-2.46%
ETH-2.43%
SOL-3.39%
The hand that set the stop-loss a few days ago trembled slightly; this morning I realized that concern had been unnecessary. As the market ground out a bottom, $PEPE repeatedly ranged around 0.000003530, with considerable buying support at the bottom. I said at the time that this was not a place to chase shorts and that we should wait for a signal to go long. Unexpectedly, not long after, 0.000003596 gave us the answer directly, and a +128.73% return was secured. The timing was spot-on, so the wait was worth it. This move was nailed, and those already on board are feeling great. It was truly s
post-image
PEPE-5.80%
BTC-2.39%
SOL-3.29%
OpenAI's Astra is now available.
post-image
#AugustNFPReportComing
The U.S. Jobs Report Could Shake Crypto Markets
All eyes are on the August U.S. Nonfarm Payrolls (NFP) report, scheduled for release today, September 4, at 8:30 AM ET. This is one of the most important macro events for financial markets because the jobs data can influence expectations for the Federal Reserve’s next interest-rate decision.
The market is entering this report with a very different labor-market picture than earlier in the year.
July payrolls unexpectedly fell by 23,000, while previous months were revised lower. For August, economists are looking for a mode
post-image
BTC-2.46%
Everyone’s watching $ETH /USDT for a breakout—but the 4h chart just whispered a secret nobody’s pricing in yet.

$ETH /USDT - SHORT

Trade Plan:
Entry: 2443.10 – 2454.96
SL: 2505.93
TP1: 2406.36
TP2: 2377.91
TP3: 2335.23

Why this setup?
- 1D trend is *range*, not bull—so longs are gambling on hope, not structure.
- RSI (15m) at 40.48 shows momentum is fading, not flipping.
- Entry zone 2443–2455 is armed: TP1 at 2406 is a 1.7% drop, TP2 at 2378 is a 2.9% slide.
- Why now? ATR 1h is 23.7—volatility is compressed, and shorts pay when the range snaps downward.

Debate:
Are you trusting
ETH-2.37%
How To Trade BTC In Future
live-cover
LIVE187
Do not overlook opportunities when the broader market is moving sideways amid uncertainty; $BTC ’s recent uptrend is a good case in point. The broader market had previously remained range-bound for an extended period, with bulls and bears deadlocked. Bearish sentiment repeatedly emerged across the market, and many investors chose to stay on the sidelines rather than build positions during the consolidation phase.
Reviewing the complete recent market trend, after an extended bottoming process, short-term selling pressure in the market has largely been cleared. As funds gradually flowed back in,
post-image
BTC-2.39%
ETH-2.37%
SOL-3.29%
Why is everyone still long $WLD /USDT when the 4h structure just whispered 'shorts only'?

$WLD /USDT - SHORT

Trade Plan:
Entry: 0.374 – 0.378
SL: 0.391
TP1: 0.365
TP2: 0.358
TP3: 0.347

Why this setup?
- 1D trend is *range*, not bullish—so the breakout narrative is dead.
- RSI 15m at 39.19 shows momentum is already rolling over, not oversold enough to bounce.
- Entry ref 0.376 sits right under invalidation 0.384—that’s a tight, high-reward trap zone.
- ATR 1h 0.00612 means the move to TP1 0.365 is ~1.8x the daily noise—clean path, no chop.
- Why now? Because 0.374-0.378 is the las
WLD-4.42%
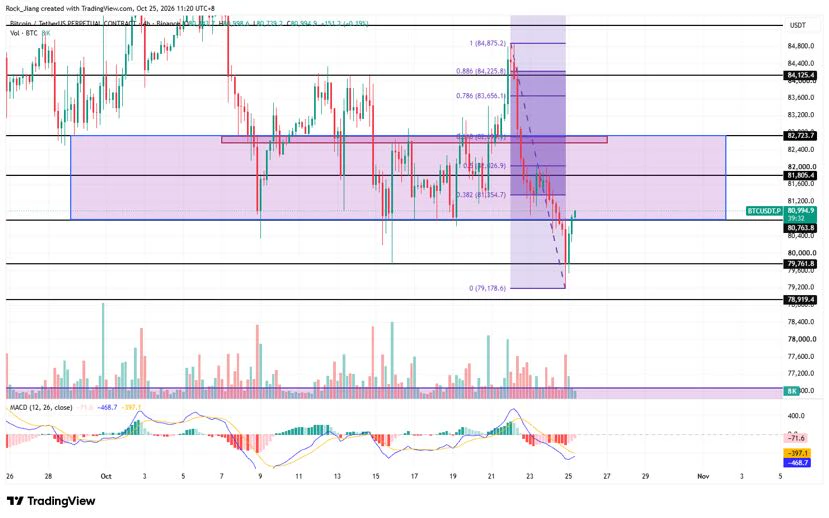
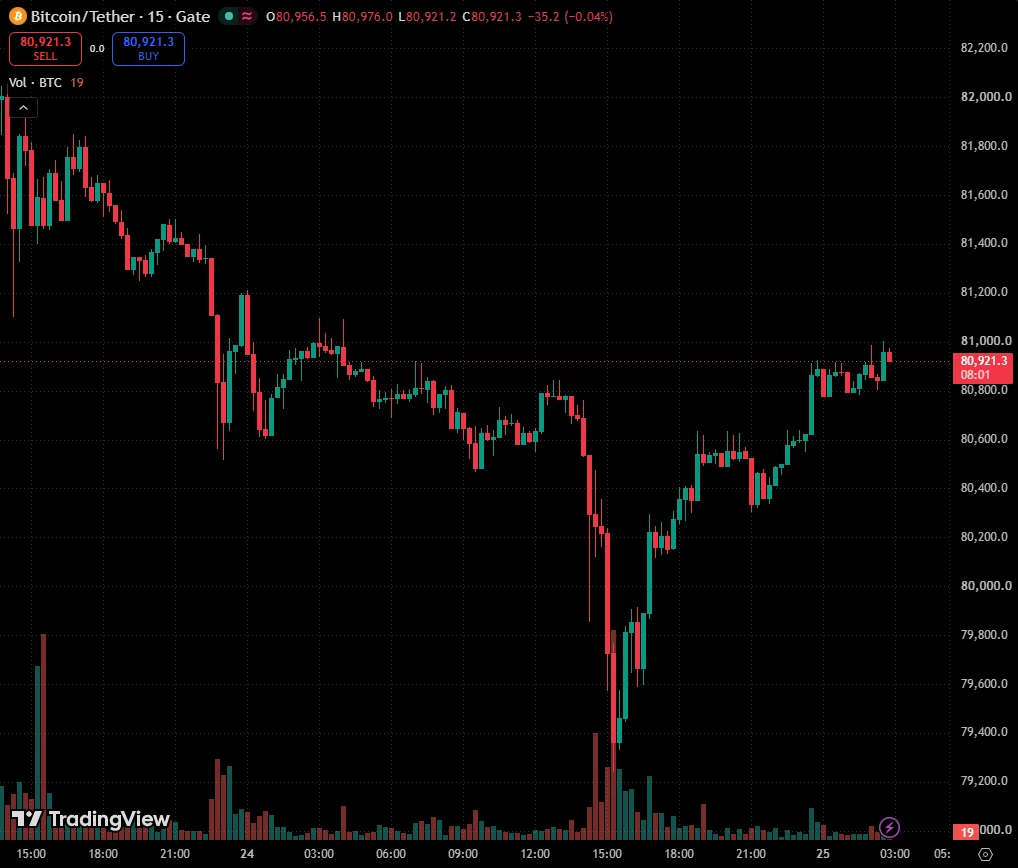
BTC Technical Outlook: Bitcoin Holds Above $79K as Bulls Target $82K+
Bitcoin is trading around $79.7K, maintaining its bullish recovery after breaking above the previous consolidation range. BTC is now approaching a major resistance cluster around $80.6K–$82.9K, where sellers previously stepped in.
📈 EMA Structure
- 20 EMA: $75,678
- 50 EMA: $71,043
- 100 EMA: $69,630
- 200 EMA: $72,491
BTC is trading above all major EMAs, confirming a strong bullish medium-term structure. The 20 EMA at $75.7K is the key dynamic support.
📐 Fibonacci Levels
- 0.236: $75,045.77
- 0.382: $82,919.00
- 0.500: $8
BTC-2.46%
( new streamer) market overview
live-cover
LIVE292
Evening profits in hand; nonfarm payrolls far exceeded expectations
Bearish for crypto, after all, it's digital gold$BTC
I have something on tonight, so I'll help the brothers secure some gains🥩 first, then take a small loss myself
The profits are here; I won't post the low-return ones, just keeping this as a memento
If I can't even make money myself, how can I help the brothers get out of the hole
#美国8月非农超预期
post-image
BTC-2.39%
A few days ago I was still calculating how to afford instant noodles; this morning I was already wondering whether to add sausage. When the early-session sell-off first hit, $ONDO looked like it was about to rebound, but sell orders kept pressing it down from start to finish. Trading volume was pitifully low, and there was simply no one to buy into the rise. I’ve seen this kind of market action many times—a typical low-volume grind downward. My judgment at the time was simple: don’t catch it; let it run. Later, it ground from 0.3997 all the way down to 0.3529, securing +565.07%. It was truly s
post-image
ONDO-2.08%
BTC-2.39%
BNB-0.53%
$USELESS Signal】1H pullback long entry + order book depth imbalance
$USELESS Current price 0.24688, with the 1H price pulling back near the middle band and bid-side depth showing an 18.56% imbalance, indicating clear support below. The 4H MACD histogram is contracting but has not formed a death cross, while the 1H RSI has pulled back to 60.7, releasing overbought pressure. The short-term structure remains bullish.
🎯Direction: Long
⚡Entry/limit order: 0.2461394 - 0.2468800
🛑Stop-loss: 0.2444112
🚀Target 1: 0.2505832
🚀Target 2: 0.2524348
🛡️Trade management:
- Execution strategy: After reach
post-image
USELESS+31.82%
BTC-2.46%
ETH-2.43%
SOL-3.39%
Another 3x and financial freedom!!
This trend is so obvious I don’t even need to think—the account is dancing on its own. When I opened the chart this morning, I saw $CYS open higher again and then fall, with a weak rebound. Every push upward was just short of breaking through, and the resistance above was glaringly clear. I followed the rhythm and entered a short at 0.4651; the price has now returned to 0.238, with a return of +485.13%. Honestly, not having to stay up late watching the chart this time and still getting the rhythm right is better than anything. But the more you make, the calmer you need to stay. I just closed
post-image
CYS-11.73%
XRP-4.39%
LAB+0.66%
$ZEC and $XRP are showing strength. But is altseason really starting?
I’d be careful with that conclusion.
The important signal isn’t two coins outperforming. It’s whether capital starts rotating across a wider part of the altcoin market.
#BTC ’s pullback after stronger U.S. jobs data adds another layer to the move, with higher Treasury yields putting pressure on risk assets.
So the real test from here is simple:
Does the strength broaden?
More altcoins outperforming BTC + stronger volume + deeper liquidity would make the rotation much more convincing.
Until then, I see this as selective str
post-image
ZEC+7.05%
XRP-4.46%
I had just tried to switch the app to the background when it suddenly plunged—what, is it playing hide-and-seek with me? $NIL really is something. When the whole screen was glowing green, I already felt something was off. Each rebound was weaker than the last, and the selling pressure kept piling on—clearly a distribution play.
I shorted around 0.06426 for one reason: the trading volume was too low. This rally was being propped up by sheer force. When everyone else is running, we shouldn’t charge straight into the line of fire.
I said it right after seeing the bearish news: don’t rush to buy t
post-image
NIL-0.90%
BNB-0.53%
XRP-4.39%
Everyone’s staring at LTC’s 50.3—but the real trap is hiding below 50.2.

$LTC /USDT - SHORT

Trade Plan:
Entry: 50.2 – 50.4
SL: 51.3
TP1: 49.6
TP2: 49.1
TP3: 48.3

Why this setup?
- RSI (15m) at 41.97 says sellers aren’t exhausted yet—momentum still points down.
- 4h frame is armed SHORT at 50.3, with TP1 at 49.6 and TP2 at 49.1, while 1D stays range-bound—no bullish rescue coming.
- ATR (1h) of 0.409 means a clean 1% slide is normal volatility, not a fakeout.
- Why now? Price is hugging the entry ceiling; the invalidation at 50.2 is the only thing keeping bulls alive.

Debate:
If 5
LTC-1.88%
Many people who fish always like to crowd into the busiest fishing spots, unaware that the big fish often hide in corners no one visits. Not long ago, $SPCX was like a fish lurking in deep water, circling back and forth within a range every day, wearing down so many anglers that they packed up and left to chase the market’s hot coins instead.
During this period of sideways trading, changes were quietly taking place beneath the surface. Selling pressure gradually subsided, while many smart-money players had already quietly cast their lines and laid in wait, and interest in the sector also bega
post-image
SPCX-1.52%
BTC-2.39%
ETH-2.37%
Load More

Join 40 M users in our growing community

⚡️ Join 40 M users in the crypto craze discussion

💬 Engage with your favorite top creators

👍 See what interests you

View More