
Square
Following
Hot
News
Profile
Share your thoughts
placeholder
Article
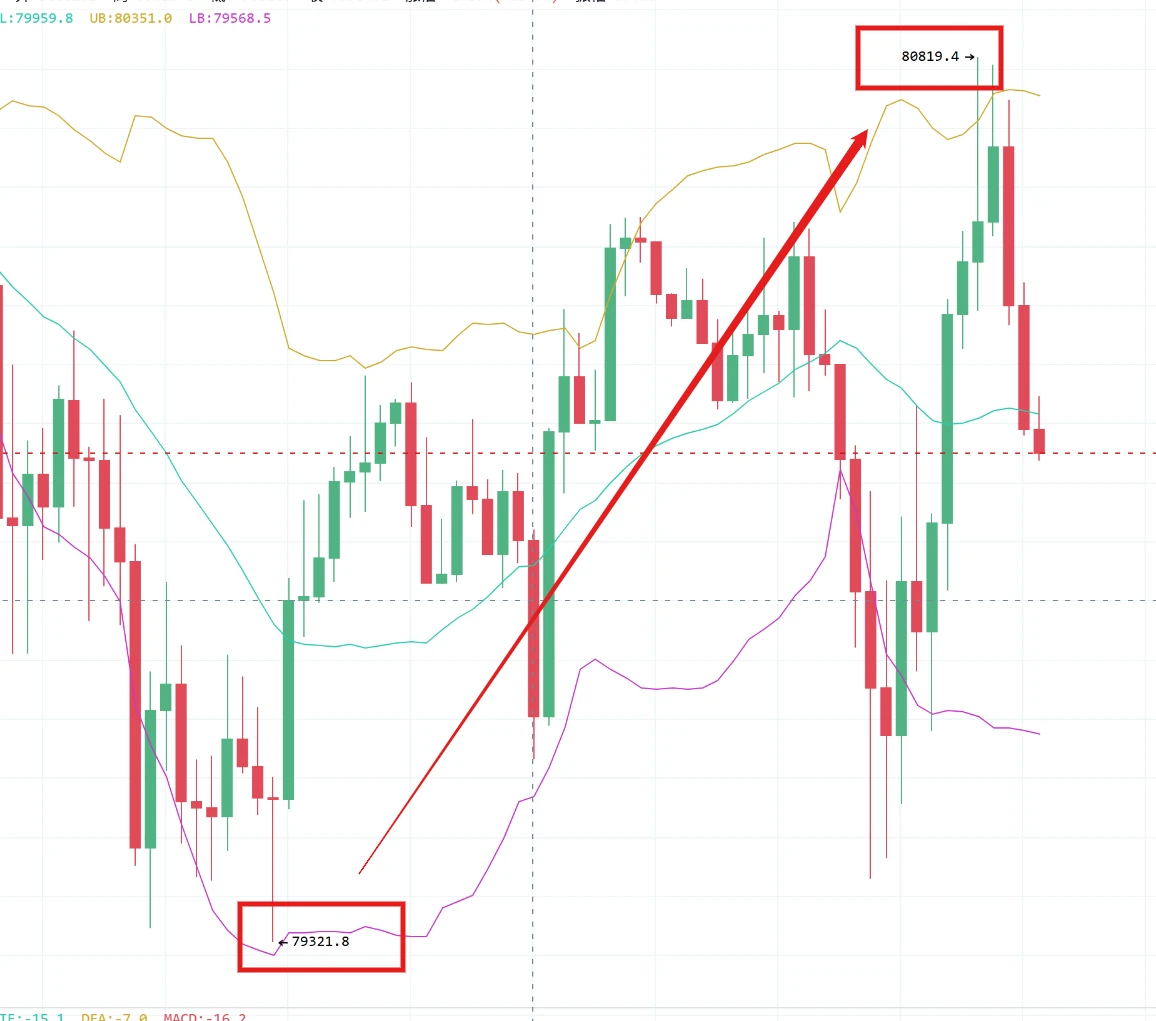
ETH’s low earlier this morning was at the halfway point of the move up from 1880 to 2808, i.e. the 0.5 retracement level. It is also support at the weekly EMA26 level and the high of the secondary reaction movement in the final phase of the bear market, consistent with a higher-timeframe support-resistance flip. If the bull market is still intact, this level is worth entering at. As long as the hourly candle body does not fall below 2340, long positions do not need to be overly concerning. For BTC, the hourly candle body simply needs to stay above 80550 going forward.
post-image
ETH-6.15%
BTC-3.45%
$ETH
The macro picture has changed dramatically
Traders are betting on 3 more Fed rate hikes
Holy shit
Liquidity expectations have completely reversed
Guys
CME interest rate futures data has changed significantly
Traders are repricing Fed policy
Betting on 3 more rate hikes ahead
Rates have been revised sharply higher
Risk assets are going to get hit again
Tell me, isn't this fucking ridiculous
After the last nonfarm payrolls report
The market was still debating when rate cuts would come
Now the script has been rewritten completely
From “rate-cut expectations” to continued rate hikes
Now U.S.
post-image
ETH-6.15%
Hehe, yesterday’s strategy perfectly caught the move from opening a short to opening a long.
Range-bound oscillations are all about profiting back and forth.
But we can’t keep profiting back and forth from here on.
Just watching for now—it feels like a direction is about to emerge.🤔
post-image
Not every crypto narrative has to start with hype. Some start with real research.
$CyberAxe caught my attention through its connection to Yukon’s HashSmash challenge, where researchers and AI agents explore cryptographic challenges and test new approaches to SHA-256.
It’s an interesting intersection of AI, cybersecurity, and crypto — a narrative worth exploring beyond the usual memes.
Curious to see how this one develops.
CA: 2Srf6mhufzWJKZ5nnigwamLmDJWXPQBmddJ1MMpump
Chart:
Research:
post-image
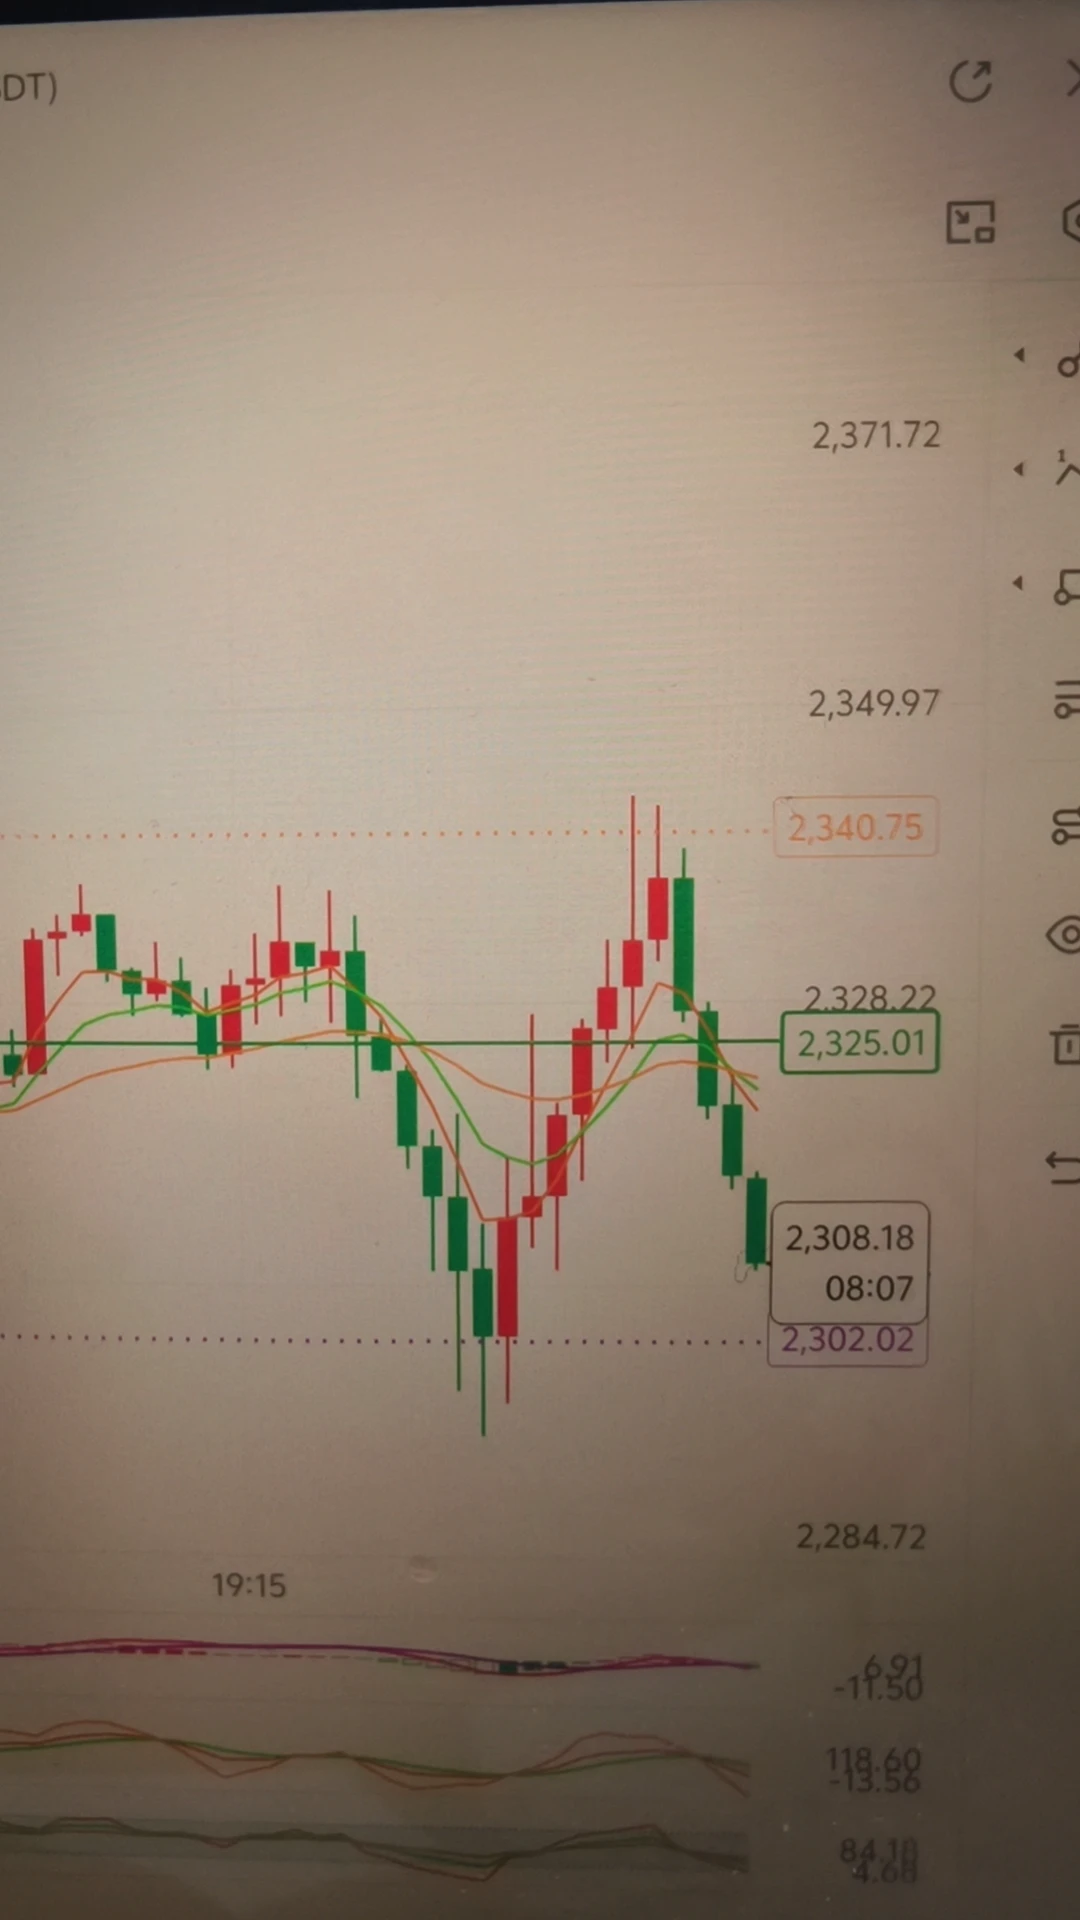
$ETH ‌ETH is currently at 2375, down nearly $500 from the high. How many people have been going through tribulations these past few days?
Where is the bottom? Honestly, the bottom isn't guessed; it's reached step by step. You ask where the bottom is at 2500, and it drops to 2400; you ask at 2400, and it slams down to 2300. By the time you feel it must have bottomed, it may still be grinding lower. I've always told everyone that in trading, you need to learn the word "wait." Wait until it can no longer fall, wait until trading volume contracts, wait until the moving averages flatten out from p
post-image
ETH-6.15%
#韩林博士受邀牛津大学辩论社演讲
Although the level prediction was not perfect, the strategy was released very promptly😌, and the market began moving downward as expected around 82000 and 2420. BTC moved 1,500 points, while ETH also captured a 100-point move. No trading entry is ever 100% perfect; identifying the trend correctly is what matters. Going forward, continue to wait patiently for suitable opportunities and maintain proper risk control.
BTC-3.45%
CPI came out overnight, and something strange happened.
U.S. Treasury yields surged to 5.33% last night, then dropped straight back to 5.11% this morning. Money got cheaper, so Bitcoin should have been able to catch its breath.
But Bitcoin didn’t rise—it’s still falling, now at $81,000.
The key is how Treasury yields fell.
Inflation declined, and everyone decided rate hikes were over, sending Treasury yields lower. That would be good news: money would be willing to come out and play, and Bitcoin would rise along with it.
Today isn’t like that. Today, the stock market crashed, and people got sc
post-image
BTC-3.45%
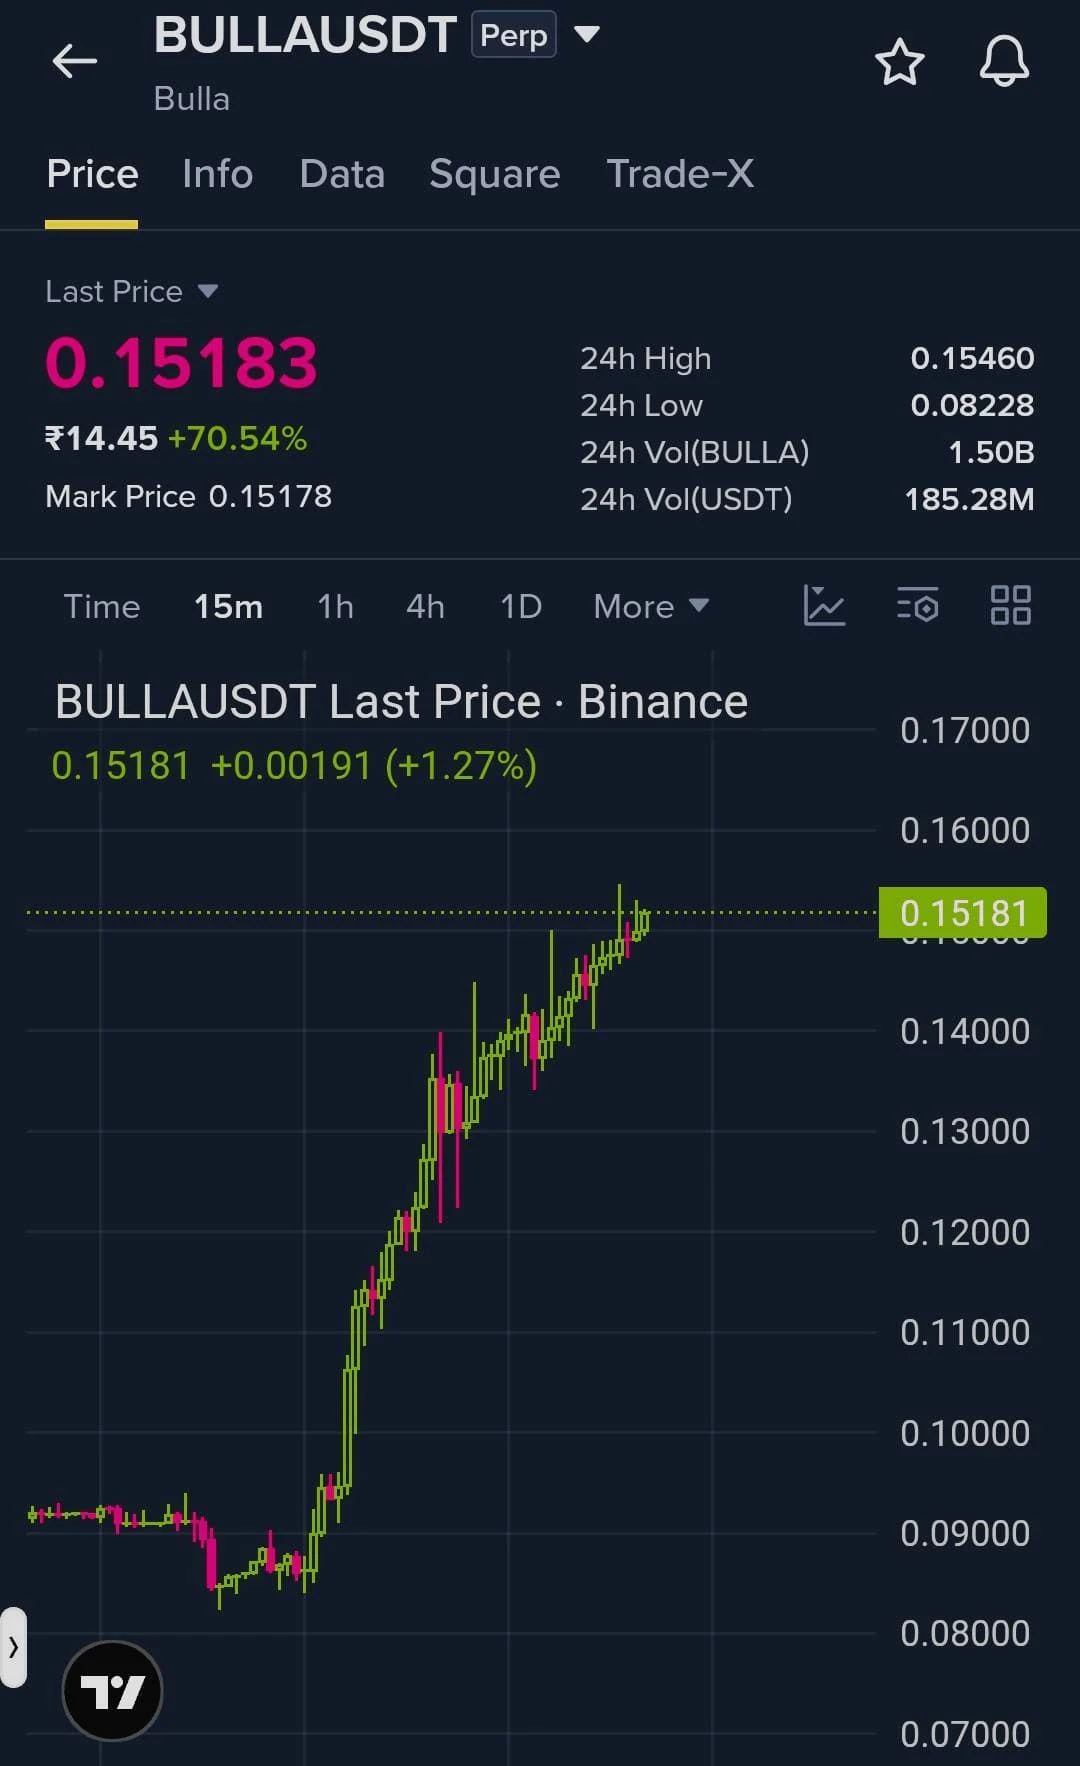
$Bull Coming—if the bull isn't coming anymore, will it still rise?
post-image
牛来-20.17%
  • 1
#BTCBreaksBelow82K
BTC BELOW $82,000: WILL $81K HOLD OR WILL BITCOIN FALL TOWARD $80K? 📉
Bitcoin’s next move could decide whether this correction becomes a buying opportunity or develops into another leg lower. My view is simple: I am not buying just because BTC has fallen. I want to see buyers defend support, selling pressure weaken, and price reclaim important levels first.
The September US CPI report has added another challenge for risk assets. Bitcoin is trading around $81,000–$82,000, while traders are watching whether the market can stabilise after the breakdown below $82,000.
1. WHY D
$sndk SanDisk is showing bullish divergence on the 4-hour chart. Combined with MACD and RSI, it currently has the conditions for a rebound. Is this really a reversal? 😭
post-image
SNDK-5.35%
Double-coin double kill! The levels I called were simply the market’s trajectory
On 10.13, I laid out the scripts for BTC and ETH in black and white:
$BTC Short at 840-845, stop-loss at 850, targets 825-813-805-788 in successive moves down
$ETH Short at 2535-2560, stop-loss at 2580, targets 2480-2430-2400-2350 all the way south
As of today, every one of them has been fulfilled precisely:
BTC topped at 84134, turned straight around upon touching the resistance zone, and crashed all the way to 80188, capturing the full 4000-point move!
ETH topped at 2537, peaked right at the resistance level and
BTC-3.42%
ETH-6.15%
#WillYouBuyDipInKoreanStocks
🚨 KOREAN STOCKS IN FREEFALL: BUY THE DIP OR WAIT FOR CONFIRMATION? 📉🔥
Samsung Electronics
The Korean stock market is facing intense selling pressure, and investors are asking one critical question: Is this the perfect opportunity to buy quality semiconductor stocks at a discount, or could this correction become even deeper?
My view is clear: I would not rush to buy the dip right now. I would wait for confirmation, protect my capital, and prepare for a gradual entry if buyers regain control. A sharp decline can create an opportunity, but a falling price alone d
$NEAR The current price is 4.637. The key short-term levels are 4.63 and 4.73: 4.63 is the lower Bollinger Band, while 4.73 is MA5. The price is currently moving along the lower band, and the moving averages are in a bearish alignment (MA5=4.732 < MA20=4.8695), which is a typical downtrend structure rather than a healthy pattern.
Here is a reusable chart-reading method: to determine whether a trend is healthy, first look at the moving-average alignment, then examine the relationship between the price and the Bollinger Bands, and finally use RSI and MACD for cross-validation. In a healthy uptr
post-image
KORUB
KORUBSouth Korea Bull
Four.meme
MC:$3.67KHolders:1
0%
NEAR-8.49%
ETH-6.15%
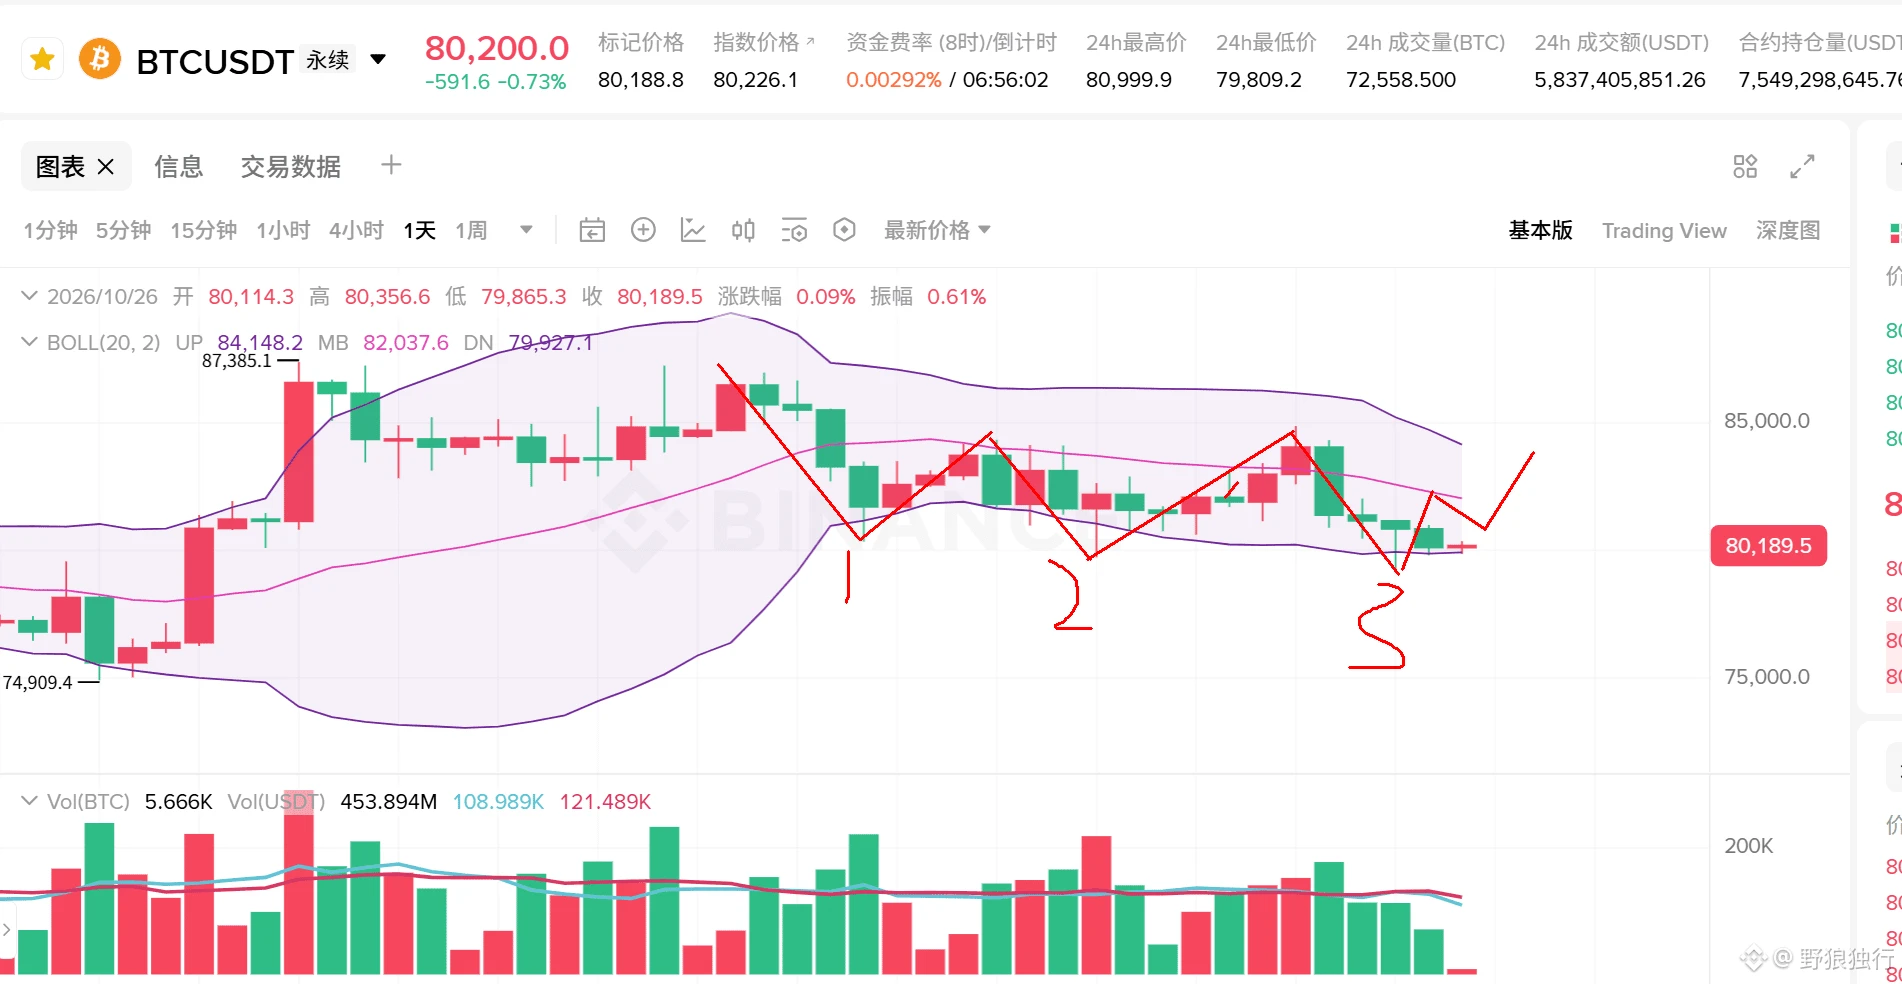
From 87385 all the way down to now, this is a “boiling frog-style decline.” One day of falling feels normal, one week feels like a pullback, and only after two weeks do you realize: oh, the trend has reversed
On the 2-hour chart, all five EMAs are in a bearish alignment, the MACD green histogram is still expanding, the Bollinger middle band at 82546 has turned into resistance, and the lower band at 80665 was briefly breached. TD count Down:2; structurally, there is still room to extend lower
15-minute frontline: the sharp drop to 80188 was bought back, showing support, but EMA15=81229 is press
post-image
btc market overview
live-cover
LIVE2,544
$BTC BTC MID TERM
BTC is currently around $81,000 and at a critical decision level; this week it spiked to $80,226 and is defending the main support at $80,000.
After the triple top at $87,000, it lost the $82,300 breakdown and now the entire game is tied at $80,000.
Two key factors are decisive going forward: the market is largely expecting the interest rate to be held steady at the October 28 Fed meeting, but the Fed remains hawkish and since there will be no dot plot at this meeting, the tone of the text is critical; secondly, Bitcoin ETFs have turned to a net outflow exceeding $1 billion t
post-image
BTC-3.42%
#USSeptemberCPITopsEstimates Just now: Elon Musk says SpaceX $SPCXB will “very likely” reach a market capitalization of $100 trillion within 10 years, “unless a major world war breaks out.”
post-image
SPCXB
SPCXBSPCX在币安上市股票代码
Four.meme
MC:$3.46KHolders:2
0.01%
SPCX-2.75%
$US It lost a quarter of its value in one day, plunging directly from 0.0090 to 0.0063. This isn't a pullback; it's a free fall.
To put it simply, something you spent 90 yuan on yesterday is worth only 63 yuan this morning, and sellers are still lining up to dump it. The 24-hour trading volume is 71.7M—what does that tell us? It's not that nobody is buying; the buyers' hands are shaking. Such intense turnover is a typical panic-selling stampede, not normal shakeout.
Technically, 0.0090 was the high of this move, and now it's at 0.0064—rolling from the mountaintop to the foot of the mountain w
US-22.63%
Yesterday BTC short hit both take-profit targets; ETH did not enter
The market fell rapidly after CPI was released last night. Yesterday, BTC entered the 84,100–84,200 short-selling zone, and both targets at 83,500 and 83,100 were reached;
ETH did not enter the planned 2,538–2,550 zone, so there was no entry and no profit or loss.
Prices have now fallen for several consecutive sessions. Today, I will not chase shorts at low levels and will only wait for a rebound into the resistance zone.
【BTC Strategy】
Direction: Short on a rebound
Entry: 82,150–82,280, under resistance
Target one: 81,500
Tar
post-image
ETH-6.15%
BTC-3.45%
Gold Recovers After CPI Losses as Investors Reassess Demand for Safe Haven Assets
live-cover
LIVE949
Load More

Join 40 M users in our growing community

⚡️ Join 40 M users in the crypto craze discussion

💬 Engage with your favorite top creators

👍 See what interests you

Trending Topics

USSeptemberCPITopsEstimates

36.55k Views2.64k Discussing

US September CPI rose 3.7% YoY, above the 3.6% estimate; core CPI rose 2.6%, also above the 2.5% estimate. With inflation topping forecasts across the board, how will rate hike expectations shift? How will BTC react? Share your view.

DrLinHanSpeaksAtOxfordUnion

135.39k Views1.86k Discussing

USSeptemberPPIReleased

91.08k Views1.72k Discussing

View More