Square
Following
Hot
News
Notifications
Profile
Share your thoughts
placeholder
Article
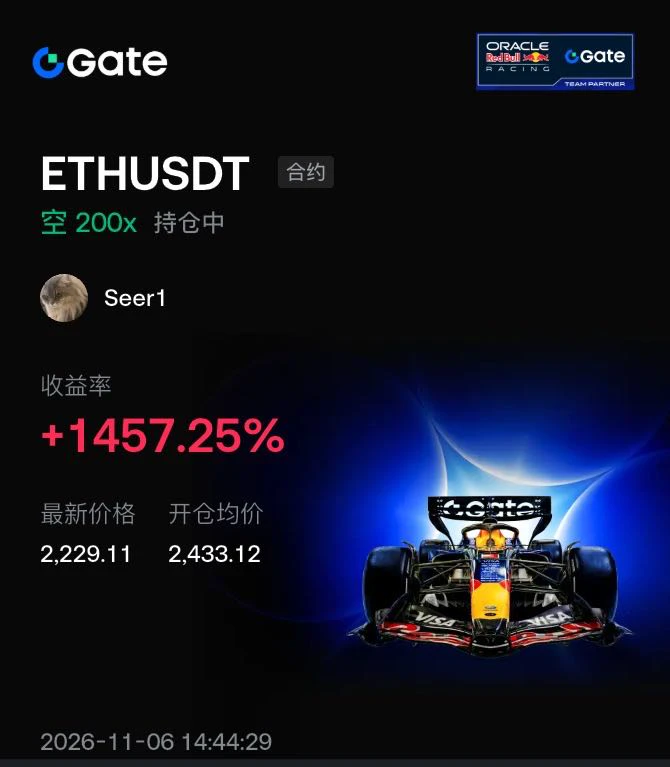
The ETH short thesis has also been validated💛$ETH
The earlier large bearish candle broke through support, with highs continuing to move lower. The rebound was only a corrective bounce, not a reversal.
The short opened at the resistance level successfully captured further downside.
Nonfarm payrolls are due tonight, bringing significant market uncertainty. Stay cautious.
#加密市场承压
ETH-1.26%
  • 3
The morning strategy had a precise entry for a BTC long. Those who got in should trim their position at 75,700, set a breakeven stop, and hold for a bit
BTC-0.65%
  • 1
Trenches
BTC
B
bade
b
BTC
C5xp...pump
Market Cap
$.
Change
.
24h Vol
$.
Holders
.
ZIG
Z
bade
b
ZIG
0x8c...1145
Market Cap
$.
Change
.
24h Vol
$.
Holders
.
GM
G
bade
b
GM
0x13...7777
Market Cap
$.
Change
.
24h Vol
$.
Holders
.
STONK
S
bade
b
STONK
6GmA...UNgx
Market Cap
$
Change
.
24h Vol
$.
Holders
.
DESSA
D
bade
b
DESSA
npz2...pump
Market Cap
$.
Change
.
24h Vol
$.
Holders
.
Yesterday’s 11.5 ETH Long/Short Strategy Review (Repost)

[translate-ref-0]: $ETH
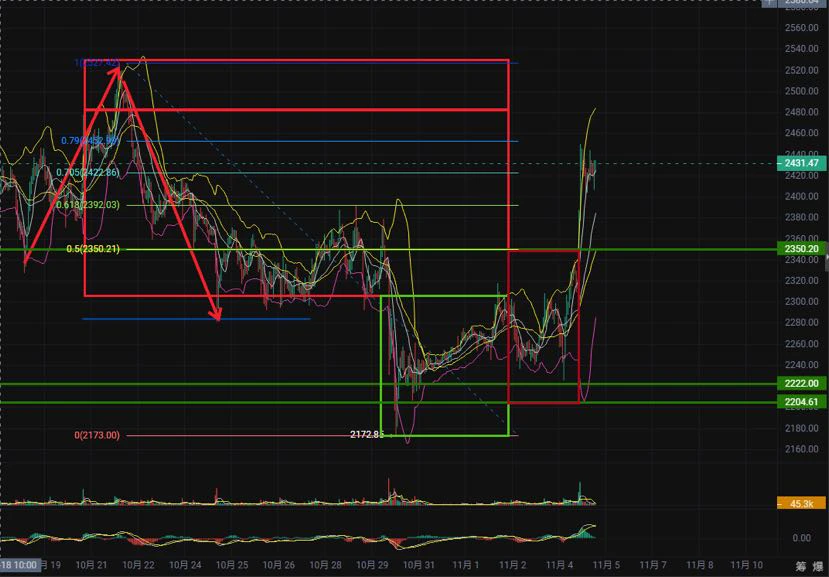
The short was entered around 2440 yesterday morning and exited around 2240, capturing a 200-point move.
Mistake: Opened a long around 2388 before the evening session opened and exited at 2343, losing 45 points.
Entered and exited in step with BTC; no stop-loss was set. An unconventional losing trade.

[Strategy Review]:
Expected a breakout above 2480 followed by a pullback, but price failed to break the 2450 level.
Both the long and short strategies failed, and the broader downtrend continued.
Went long before t
AChenBit
11.5 ETH public strategy
[Short strategy] $ETH
  Entry range: around 2480-2500
  Stop-loss: 2520
Take-profit tiers
  First target: 2460
  Second target: 2420
Third target: around 2380
Fourth target: below 2350

Trading factors: Price has returned to the upper Bollinger Band, creating short-term selling pressure. Short-term moving averages are turning upward, and short-term bullish momentum is strong. This is a recovery pattern after being oversold, with the rally outperforming BTC. Market depth shows a slight bullish edge; the ratio is expected to even out, forming a trading range.

Trading suggestion: After the market forms a high-level range, short near 2480 and go long near 2400.
Note the short-term support at 2400.

planB
If the short entry range is not reached, or the price falls below 2400, execute
[Long strategy] $BTC $ZEC
Entry range: 2400-2420
  Stop-loss: 2380
Take-profit tiers
  First target: 2440
  Second target: around 2460
Third target: 2480
Fourth target: above 2500
#BTC重返8万 $BTC
#民主党赢得美国两院
#Gate上线台股交易
repost-content-media
ETH-1.23%
[New Streamer] Market Prediction
live-cover
LIVE50
Same pattern
Slow grind
Flash dump
Slow grind up in the coming year
8800-8900
Is the next macro target.. The 2008 fib
#bitcoin
BTC-0.67%
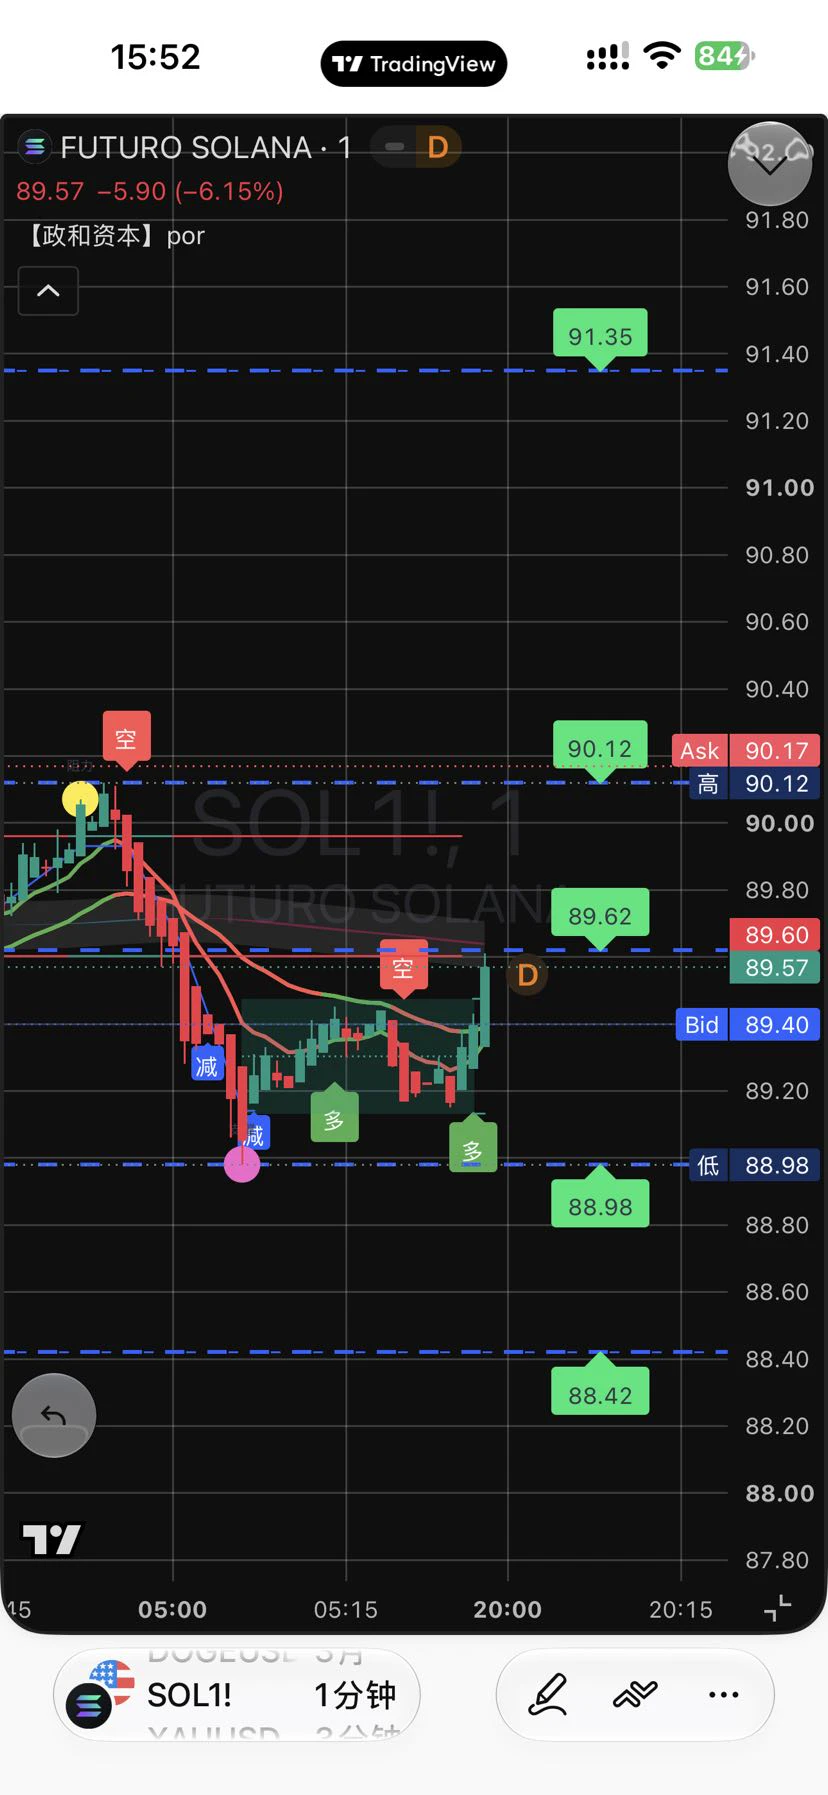
November 6, 2026 (Friday) SOL Contract Strategy for Today (based on the current range of around $89–$90)
Core view (bearish bias, cautious on bounces)
SOL has quickly fallen from around $96 to around $89, breaking recent support, with weak short-term momentum. Today, prioritize watching for a bounce to be rejected as a short opportunity, or consider going long only after a pullback to lower support; keep positions light.
Specific strategy directions
1. Shorting a bounce (primary strategy)
• Watch zone: $91.0–$93.0 (or near $94.0)
• Entry reference: If the price bounces to around $91.5–$92.5
post-image
SOL-0.74%
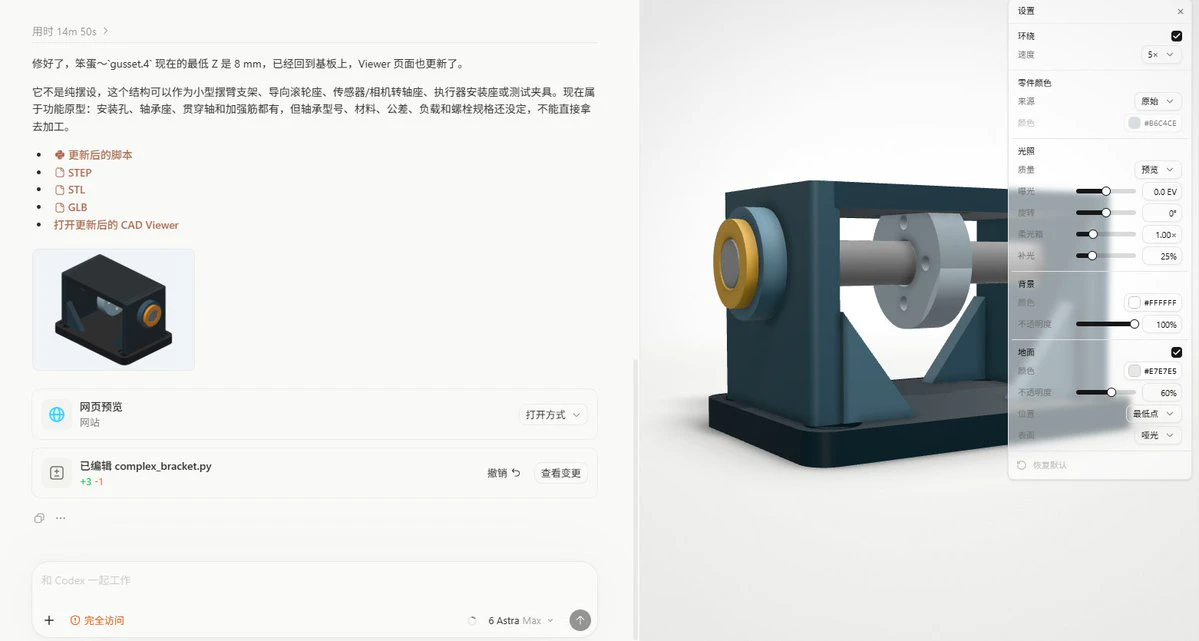
Found an open-source text-to-CAD project and tried running it. Seems fine for making small things, though I have no idea what the thing in the picture is.

All I’m missing now is a 3D printer. My dream is to have a 3D printing farm with a few hundred printers, printing away all night, then going to harvest the goods the next day. If I get too busy shipping orders and taking new ones, I’ll just hire one or two people.

And then I’ll live an ordinary, uneventful life (by which I mean making over 10,000 a day).
post-image
new steamer BTS market
live-cover
LIVE1,697
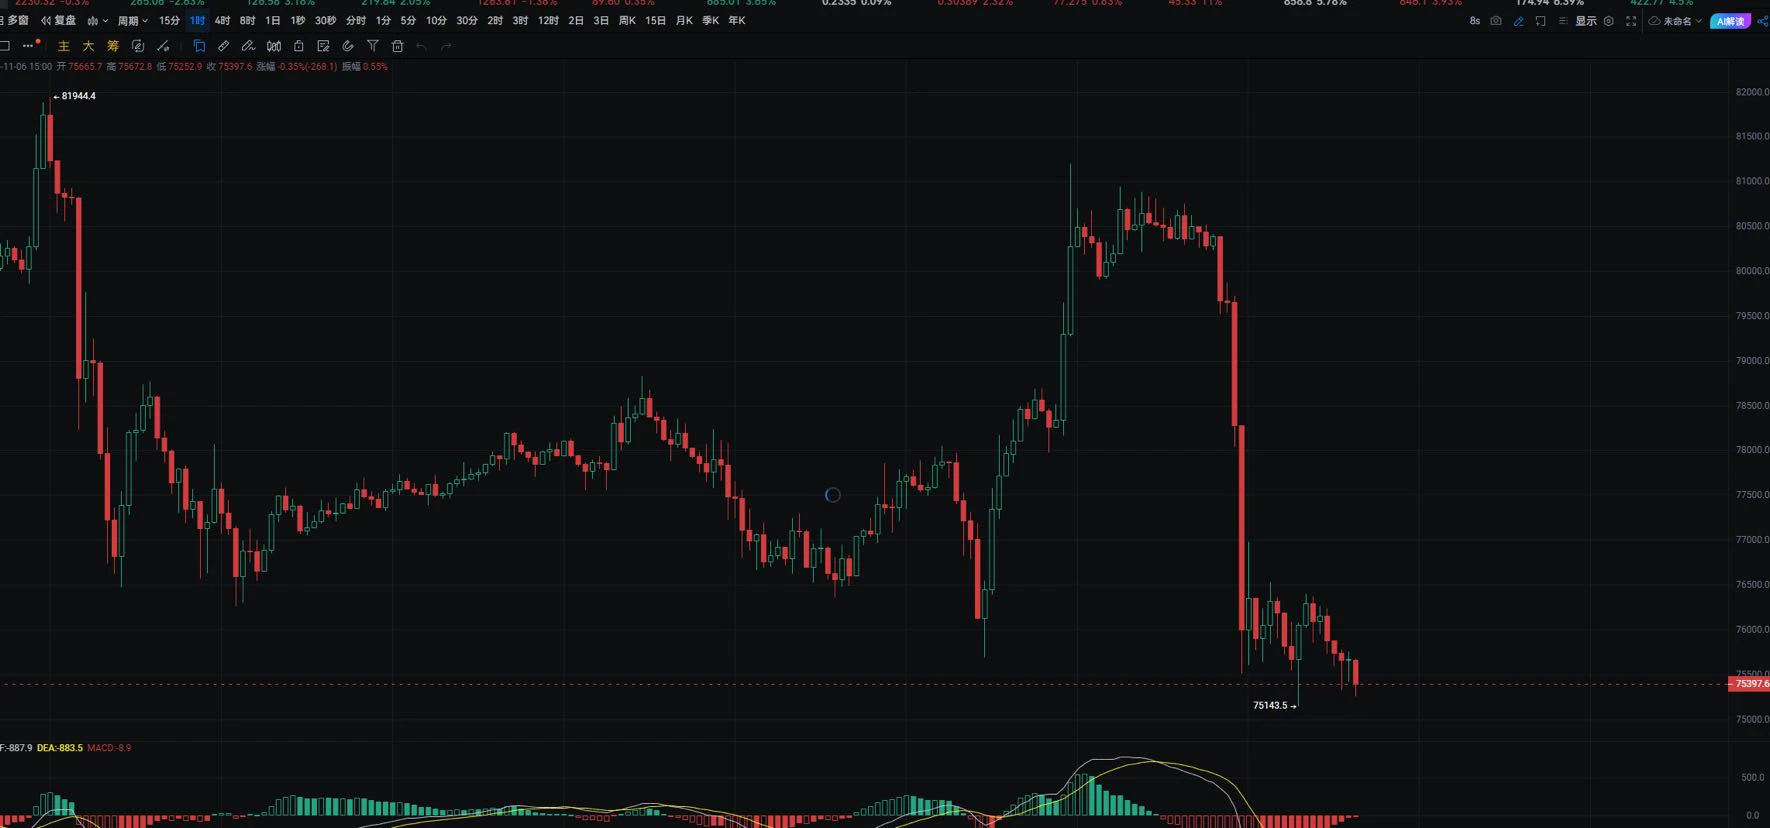
$BTC BTC is currently at 75720. After a sharp pullback, the market is now repeatedly testing key support. The rally above 80400 has retraced, and bullish momentum has faded quickly. After concentrated selling pressure was released, market sentiment weakened noticeably, and the short-term market has entered a weak recovery phase. The first resistance above is around 78000, a previous high-volume trading zone and the dividing line between bulls and bears in this decline. To regain the initiative, BTC must hold above this level with a corresponding increase in volume; otherwise, each rebound is m
post-image
BTC-0.65%
  • 11
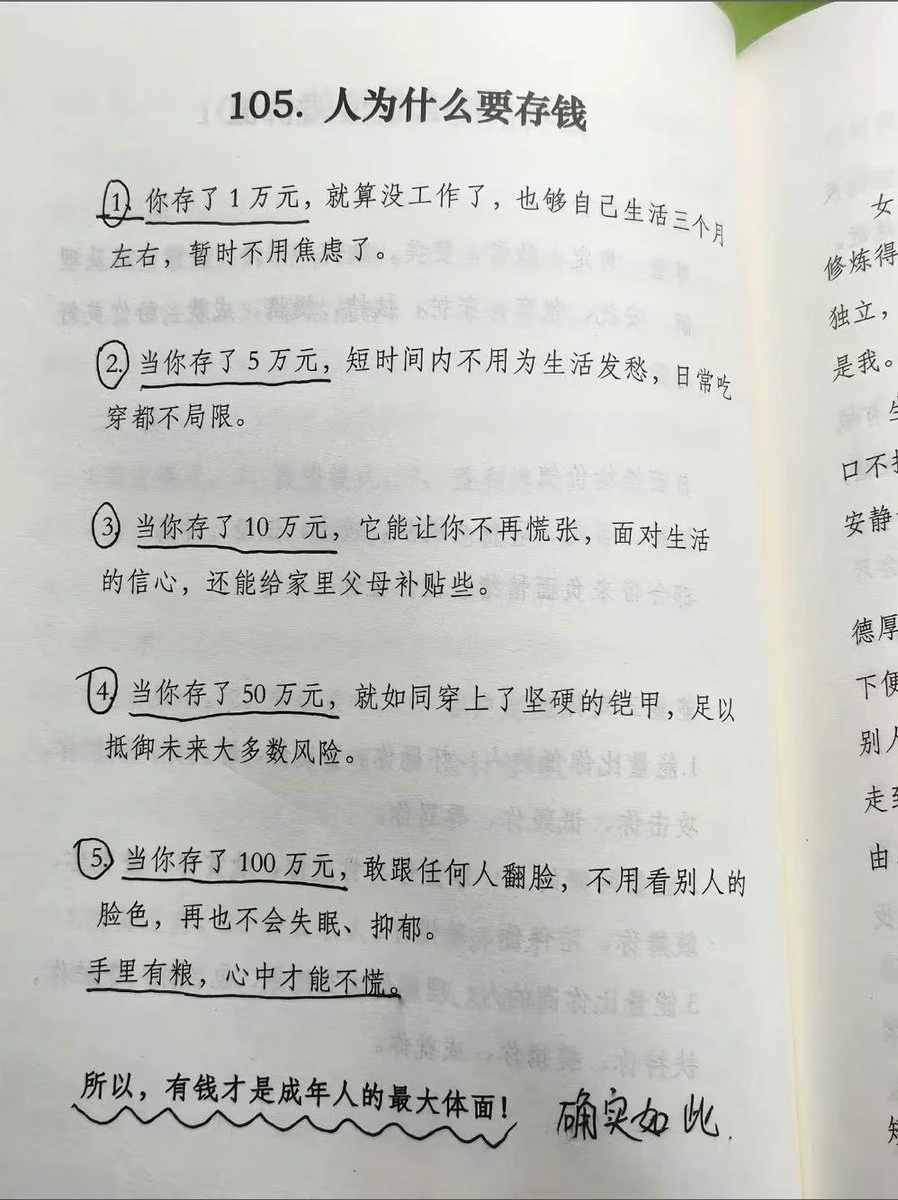
How much savings do you need at 30 to not be poor?
Once altcoins go up more than 20x, I’ll break even at 1 million.
What about you guys?
post-image
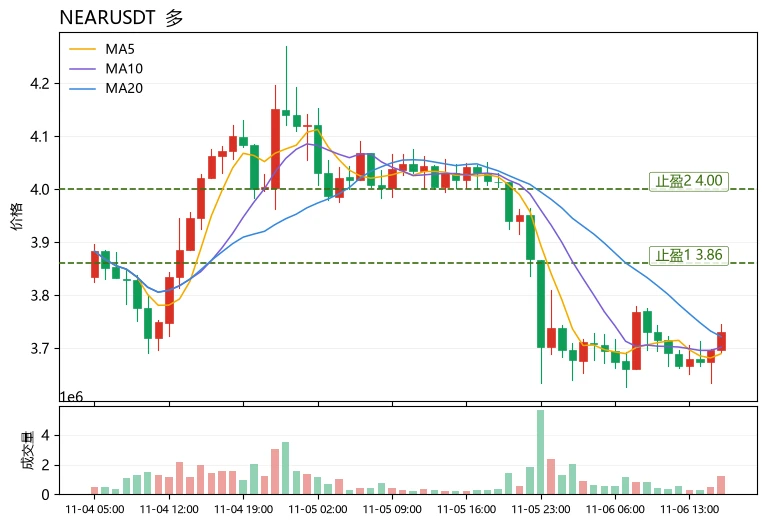
Many people see “price falling below MA5 and MA20” and immediately conclude the trend has turned bearish. This is a common misconception: a bearish moving average alignment only indicates weak short-term momentum. To make a proper assessment, look at the price relative to the Bollinger middle band, the direction of the MACD histogram, and whether longs are paying funding fees.
Take $NEAR as an example: the current price is 3.731, and MA5=3.6896 has crossed below MA20=3.7218, suggesting resistance on the surface. However, the MACD histogram is still positive (+0.008912), and the price is near
post-image
NEAR+1.17%
ENA+8.04%
ETH-1.26%
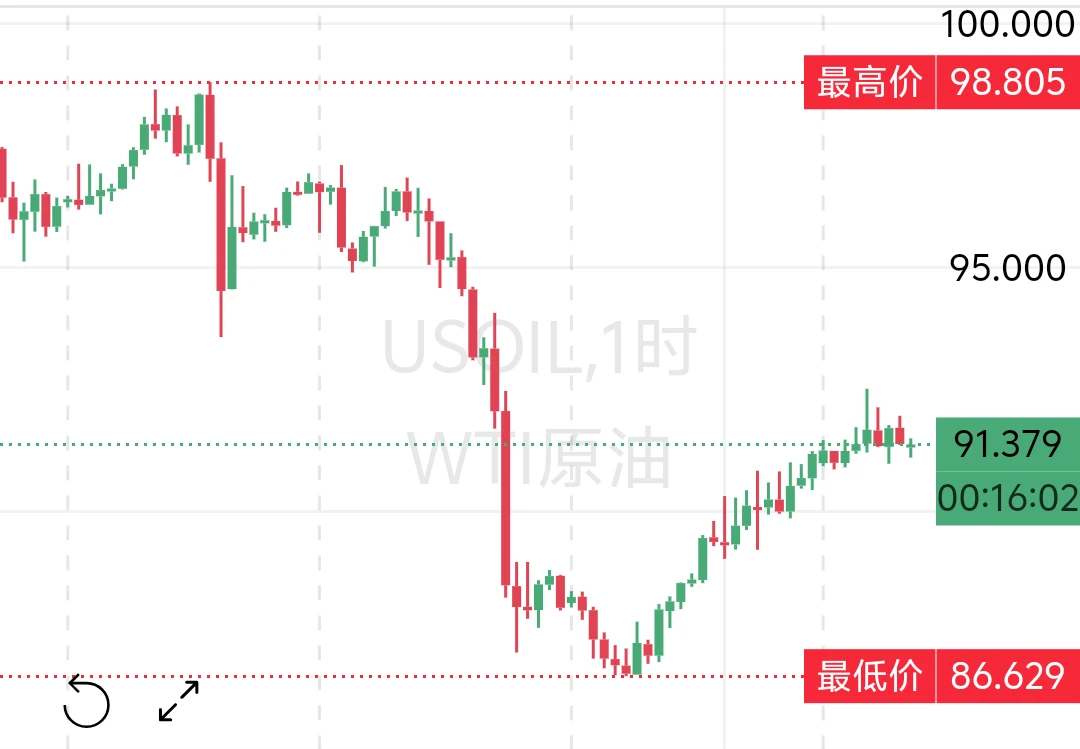
From the hourly chart perspective, crude oil has stabilized at the bottom after a deep earlier decline and staged a strong, sustained rebound. The short-term uptrend remains intact, with bullish momentum dominant. The strategy is to buy dips, with an initial target near 94.
$XAU $BTC #美股史诗级抛售 #10月非农数据聚焦 #Gate股票畅聊季
post-image
XAU+0.38%
BTC-0.65%
A reminder: U.S. October nonfarm payrolls data will be released tonight at 9:30. If it comes in above expectations, the odds of a Fed rate hike may rise further; if it comes in below expectations, the odds of a Fed rate hike in December may fall. These expectations have had some impact on the market following hawkish remarks by two Fed officials yesterday, though the impact was not because of them. At 5:30, Williams, the Fed’s No. 3 official, will also speak—let’s see whether he takes a hawkish or dovish stance
post-image
  • 1
They said new lows were coming, but is the bottom in? Not necessarily. 2x December may provide a signal$BTC $ETH ‌
post-image
BTC-0.65%
ETH-1.23%
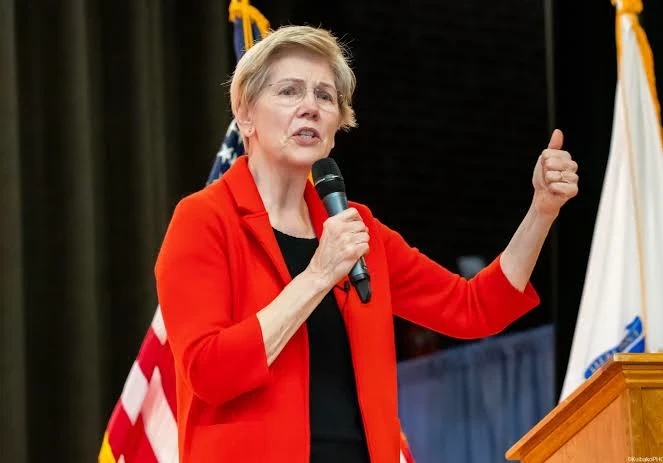
🚨 JUST IN: 🇺🇸 Elizabeth Warren is expected to lead the powerful Senate Banking Committee after Democrats retake control of Congress.

The longtime crypto critic could have major influence over US crypto regulations, Wall Street oversight, and Trump’s crypto ventures.

A potential major headwind for the US crypto industry.

‍#Crypto #Bitcoin #ElizabethWarren
post-image
BTC-0.67%
What Is a Stop-Loss Order? Why Is Setting a Stop-Loss Important, Yet Unable to Guarantee an Exit at the Expected Price Every Time?

In cryptocurrency trading, no one can always accurately predict price movements. The purpose of a stop-loss is not to ensure that a trade never loses money, but to limit risk in advance when the market moves against expectations and prevent losses on a single trade from continuing to grow. However, a stop-loss is not an absolute safeguard; extreme market conditions can still lead to slippage.

First, what is a stop-loss order?

A stop-loss order is a trading tool
post-image
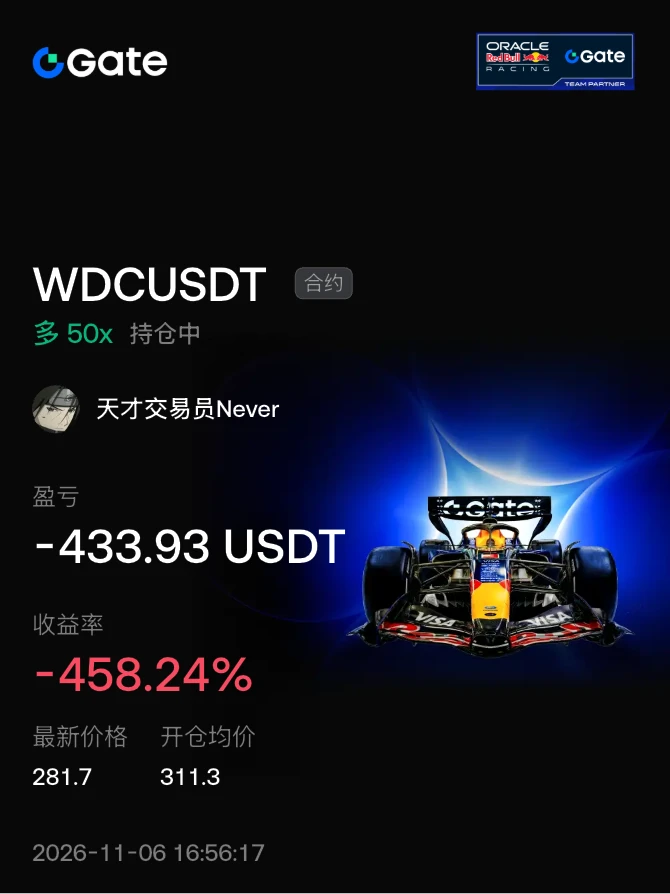
#晒出我的持仓收益 $WDC
Buy the dip and hold, I have faith
post-image
WDC-0.35%
#USStocksFaceHistoricSelloff

Hunting for a Reversal in the SOXL Crash .

$SOXL

soxl

SOXL

CFD

40.93

-38.19%

‌

The chart tells a dramatic story. SOXL, a 3x leveraged semiconductor ETF, has experienced a catastrophic drop, plummeting -38.19% to trade at $40.93. The price has sliced through the Bollinger Bands and moving averages like a hot knife through butter, driven by headline fears (as noted: "AI buildout fears hit chip stocks").

When an asset falls this violently, panic selling is common. However, for the technical trader, a massive sell-off often sets the stage for a sharp
SOXL-38.25%
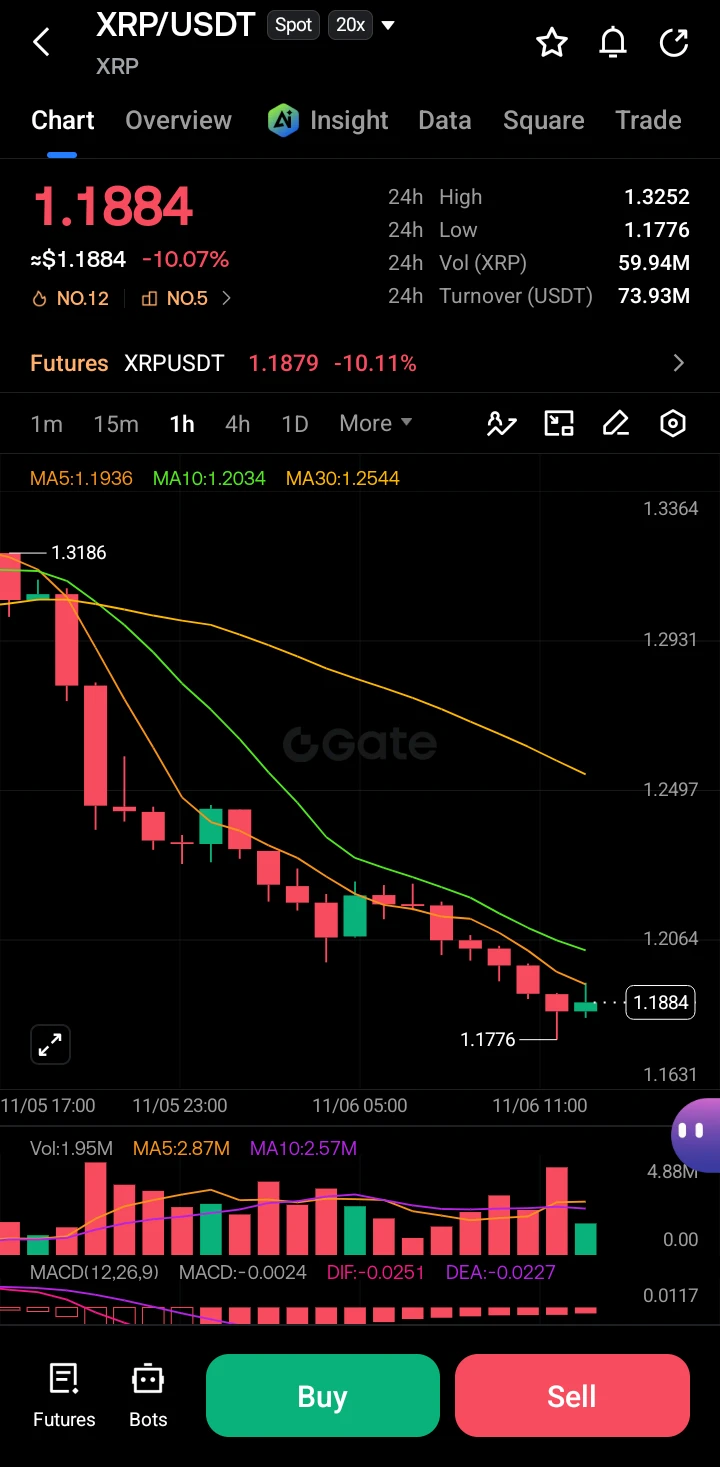
$XRP ‌
XRP/USDT Market Update: Bearish Momentum Intensifies

XRP is currently showing significant downward pressure on the intraday charts, having experienced a sharp selloff from the 1.3196 local high. The asset is trading at 1.1884, down over 10% for the session, reflecting a broader bearish sentiment. Price action is currently testing lower bounds, having printed a recent low of 1.1776.

Technical Structure and Indicators

The chart structure remains distinctly bearish. We observe a sequence of lower highs and lower lows, with candles consistently closing below the short-term moving averag
post-image
XRP-1.15%
  • 8
  • 2
🚨 One Election, Two Red Days for Tesla

🔵 Nov 3: Democrats win both the House and the Senate, and Texas elects its first Democratic governor in over three decades. That’s the state where Tesla has its headquarters and key factories.

🔻 Nov 4: TSLA closes at $385.19, down 3.3%, while the Nasdaq rises 1.4%.

💥 Nov 5: TSLA closes at $343.69, down 10.8%, and SpaceX loses 9% alongside it.

Musk was the largest individual donor in these midterms, so the $BTC market is now pricing more oversight, more regulatory questions and less certainty around the Tesla–SpaceX merger. Nothing broke inside the
post-image
BTC-0.67%
ZEC+1.29%
Load More

Join 40 M users in our growing community

⚡️ Join 40 M users in the crypto craze discussion

💬 Engage with your favorite top creators

👍 See what interests you

Trending Topics

USStocksFaceHistoricSelloff

4.79k Views3.65k Discussing

U.S. stocks suffered a sharp selloff on Thursday, with the Nasdaq closing down more than 5% and the Philadelphia Semiconductor Index falling over 12%. AI and chip stocks including $NVDA and $AMD were hit especially hard. Markets are reassessing AI valuations, data-center spending and future returns. Is this just short-term deleveraging, or the start of a deeper correction in the AI trade? Which sectors are you watching next?

GateLaunchesPoSECProofOfSecurity

14.95k Views591 Discussing

USNonfarmPayrolls

13.18k Views4.05k Discussing

View More