Share your thoughts
placeholder
Article
Everyone’s staring at BTC—but ZEC just armed a 95% long signal while they blink.

$ZEC /USDT - LONG

Trade Plan:
Entry: 1017.46 – 1025.04
SL: 984.82
TP1: 1048.57
TP2: 1066.79
TP3: 1094.11

Why this setup?
Why now? The 4h setup is the rare "Armed" state:
- Entry zone 1017–1025 holds above the 1D bullish trend.
- RSI 15m at 58.5—room to run, no overheated blow-off yet.
- ATR 1h at 15.17 means volatility is expanding *with* us, not against us.
Targets are stacked: TP1 1048 → TP2 1066 → TP3 1094. The only invalidation is a brutal 874 break—that’s a 14% cushion of safety. This is a momen
ZEC+0.82%
The hand that set the stop-loss a few days ago trembled slightly; this morning, I realized that overprotective gesture had been unnecessary. The final $DOT rebound before bed reached around 1.193. It looked strong, but the more it pushed, the more hollow it felt—the volume failed to keep up, and it clearly could not hold. The short position was already open, so I placed the stop-loss outside the key level and went to sleep, thinking I would accept it if I got stopped out. When I woke up, the price had not tested higher; instead, it slid to 0.922, delivering a paper return of +1611.81%. Staying
post-image
DOT+3.25%
ETH+1.40%
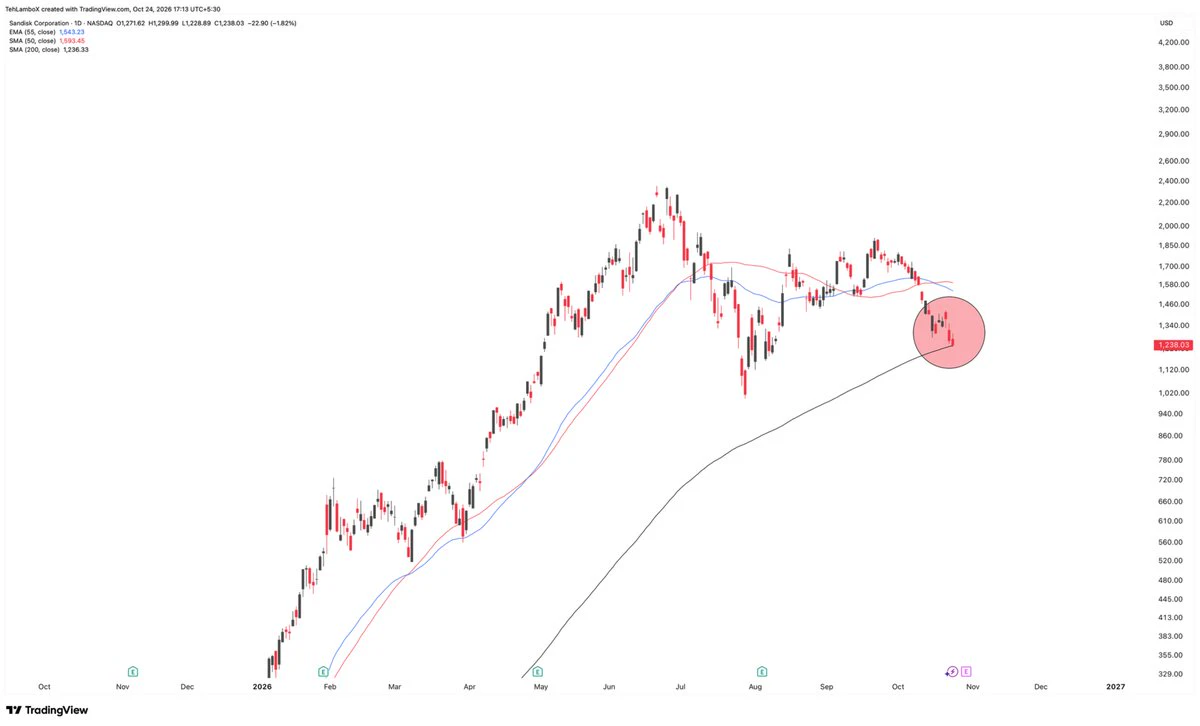
SNDK+1.83%
Many people are focused on the key levels above, while overlooking the key levels below slowly moving higher. $BULLA After this move was pushed up from around 0.028584, the floating profit on my long position once reached +1949.58%, but I never chose to exit everything at once.
Because in trading, taking profits and letting profits run are inherently contradictory. My approach is simple: first turn 70% into real cash, move the take-profit level for the remaining 20% above the entry price, give the market some room, and leave myself a way out.
The price is currently consolidating repeatedly aro
post-image
BULLA+183.43%
XRP+1.25%
BNB+6.62%
[$牛来 Signal] Long + 4H bullish continuation
$牛来 current price 0.12198, 4H MACD histogram 0.0053 showing bullish expansion, 1H MACD histogram -0.0004 with the negative value narrowing. 1H rebounded from 0.11173, and the price touched the 4H Bollinger upper band at 0.1215. Order book depth imbalance is -14.11%, Bid/Ask 0.75, with sell-side depth prevailing.
🎯Direction: Long
⚡Entry/Limit order: 0.1216141 - 0.1219800
🛑Stop-loss: 0.1207602
🚀Target 1: 0.1238097
🚀Target 2: 0.1247246
🛡️Trade management:
- Execution strategy: After reaching Target 1, reduce the position by 50% and move the stop-lo
post-image
牛来+43.22%
BTC+0.31%
ETH+1.41%
SOL+1.39%
Most traders will ignore $LAB /USDT at 0.07413—that’s exactly why the 95% short setup is armed.

$LAB /USDT - SHORT

Trade Plan:
Entry: 0.07390 – 0.07436
SL: 0.07630
TP1: 0.07250
TP2: 0.07142
TP3: 0.06979

Why this setup?
- 4h structure is bearish, but the 1D trend confirms it: downside is the path of least resistance.
- RSI on 15m at 37.24 shows momentum is already rolling over—no bounce strength to fight the slide.
- Entry window is tight (0.07390–0.07436), with TP1 at 0.07250 and TP3 at 0.06979.
- The invalidation at 0.07428 is razor-thin—either we break down fast or this signal di
LAB+1.71%
After the previous rebound peaked at 80200, it failed to break above the 80800‑81200 resistance zone and formed a top fractal on the lower timeframe, triggering a pullback;
2. The market has now returned to the previous consolidation center (79700‑80000), and the 30-minute timeframe has shifted from a “strong rebound” to a consolidation mode;
3. Structural assessment: The pullback from 82000 has not truly ended yet; this is merely an extension of the consolidation center, and two possible paths remain.
Path 1 (relatively strong)
This consolidation does not break down; a new bottom fractal form
post-image
BTC+0.31%
$MEME
run it back.
post-image
MEME+3.81%
I just casually hit refresh, and it dropped all by itself, leaving me on the back foot. 😂
When the screen was full of green, $APT /APT bounced twice but failed to hold either rebound. The volume weakened each time; no one was buying on the way up, showing that the bears still weren’t done. I tentatively placed a short order at 0.9133, just to test the direction.
Then I switched away to take a sip of water, and when I came back, the current price had already fallen to 0.6264, with my unrealized profit reaching +2228.96%. This was purely good luck—I casually tossed out a few gold coins, and they
post-image
APT+7.95%
ZEC+0.82%
ETH+1.40%
🚨BREAKING: $NKE With this ULTRA RATE PATTERN!!
post-image
NKE-0.86%
Everyone’s chasing silver’s rally, but the 4h chart just whispered a secret to me about $XAG /USDT.

$XAG /USDT - SHORT

Trade Plan:
Entry: 66.24 – 66.30
SL: 66.54
TP1: 66.07
TP2: 65.94
TP3: 65.74

Why this setup?
Why now? The 1D trend is *range*, not breakout—so mean reversion is king.
- RSI on 15m is 58 (cooling, not overbought), but the 1h ATR (0.111) shows volatility is compressing.
- Entry at 66.27 with TP1 at 66.07, TP2 at 65.94—that’s a 0.5% drop before the daily range even blinks.
- Confidence is only 55, but the invalidation at 66.76 is tight—risk is defined, reward is 3:1 to
XAG+0.05%
🇺🇸 US dollar has lost 97% of its purchasing power since the Federal Reserve was created.
A $3 item in 1913 would cost $100 today.
post-image
📊 $CRV looking interesting.
The level to watch is $0.40–$0.45 on the weekly.
• Flip + hold ✓ → 1W 200EMA next
And if $CRV flips the 1W 200EMA into support, then $1.0–$1.4 comes into play for the med term. 📈✍️
#CRV #CRVUSDT #Curve #Alts #Crypto
post-image
CRV+10.88%
Pretty happy—I got to eat #晒出我的持仓收益 after sleeping.
post-image
Everyone’s watching gold—but XAG/USDT just printed a 4h setup most traders will ignore until it’s gone.

$XAG /USDT - SHORT

Trade Plan:
Entry: 66.19 – 66.25
SL: 66.49
TP1: 66.02
TP2: 65.88
TP3: 65.68

Why this setup?
- RSI on 15m is crushed at 34.69—momentum is already bleeding, not waiting for price.
- 1D trend is *range*, but the 4h bias flips SHORT at 66.22 with 55% conviction—this is a mean-reversion trap, not a breakout.
- ATR (1h) at 0.1135 means tight stops; TP1 at 66.02 is only 0.3% away—quick scalp before the daily close.
- Why now? The entry zone (66.19–66.25) is the same l
XAG+0.05%
I originally just wanted to mooch a breakfast, but the market ended up making dumplings out of me for half a year. I opened the charts this morning, and before my eyes were even fully open, I saw the price bubbling up on its own. A few days ago, while watching the market in the early hours, $TAC had been moving sideways at the bottom. Everyone was waiting and watching. I stared at the order book for a while and saw funds entering slowly but steadily, with small orders constantly providing support at the bottom. In situations like this, I don't hesitate—I reached in and bought some around 0.002
post-image
TAC-4.39%
ZEC+0.82%
LAB+1.71%
Everyone’s long oil while the 4h chart quietly prints a SHORT signal nobody sees yet.

$CL /USDT - SHORT

Trade Plan:
Entry: 91.55 – 91.73
SL: 92.48
TP1: 91.01
TP2: 90.59
TP3: 89.97

Why this setup?
- $CL /USDT is sitting at 91.64 with a 55.4% short bias—not screaming, but whispering.
- 1D trend is *range*, meaning the easy up-move is dead; mean reversion is the only game.
- RSI on 15m is 40.78—already rolling over, not oversold enough to bounce.
- ATR 0.348 on 1h = tight squeeze; when it breaks, TP1 at 91.01 is a 0.7R gift, TP2 at 90.59 is the real meat.
- Why now? Price is armed a
CL+1.02%
Everyone’s chasing gold’s new high—but the 4h tape just whispered a different secret about XAUT.

$XAUT /USDT - SHORT

Trade Plan:
Entry: 4426.2 – 4428.6
SL: 4436.7
TP1: 4420.4
TP2: 4415.8
TP3: 4408.9

Why this setup?
- RSI on 15m sits at 46.24, losing upside momentum while price stalls at 4427.4.
- 1D trend is **range**, not breakout—so 4436.7 (SL) is the real battle line, not the moon.
- ATR 4.63 on 1h means moves are tight; TP2 at 4415.8 is only 0.26% away, but that’s the trap zone if bulls defend.
- Why now? Status is “Armed” with invalidation at 4455.6—if we lose 4426.2, shorts h
XAUT+0.03%
This round’s $UNI long wasn’t the hardest trade to make, but it tested my patience the most. After entering, it didn’t immediately become profitable and kept hovering around the entry line, wearing me down. There were several times when I wanted to exit outright, but in the end I forced myself to hold on with the protective stop. The chart only gradually strengthened after the breakout, so I made an adjustment: close 70% of the position first, and move up the protective stop on the remaining 30% and continue watching.

Some people asked why I didn’t close the entire position. Handling positio
post-image
UNI+15.82%
ADA+4.03%
XRP+1.25%
Load More

Join 40 M users in our growing community

⚡️ Join 40 M users in the crypto craze discussion

💬 Engage with your favorite top creators

👍 See what interests you

View More