Square
Following
Hot
News
Notifications
Profile
Share your thoughts
placeholder
Article
[New Streamer] Market Prediction
live-cover
LIVE1,893
$BTC The previous 3 cycle bottoms occurred approx 365–406 days after their respective cycle tops.

Based on this historical pattern, the current 4-year cycle bottom is likely to arrive by late Nov or Dec.

⚠️ The next 2 months are absolutely critical.#ShareWeekly #USCPIDataIncoming #BTCETFOutflowsContinue #Ahr999EntersBottomBuyingZone

$ZEC
$JCT
$GT
$KOMA
BTC-0.65%
ZEC+1.29%
JCT-3.26%
GT-2.24%
KOMA-4.07%
Trenches
ZIG
Z
bade
b
ZIG
0x8c...1145
Market Cap
$.
Change
.
24h Vol
$.
Holders
.
STONK
S
bade
b
STONK
6GmA...UNgx
Market Cap
$.
Change
.
24h Vol
$.
Holders
.
IDOL
I
bade
b
IDOL
0x3b...ab07
Market Cap
$.
Change
.
24h Vol
$.
Holders
.
BTC
B
bade
b
BTC
C5xp...pump
Market Cap
$.
Change
.
24h Vol
$.
Holders
.
FLOAT
F
bade
b
FLOAT
Bv1a...BMmr
Market Cap
$.
Change
.
24h Vol
$.
Holders
.
The crypto wallet that lets you log in with one tap using a Google account has run into trouble.
Keplr is a veteran wallet in the Cosmos ecosystem. You can log in directly with a Google or Apple account without writing down a seed phrase. The feature relies on a third-party service, Web3Auth.
Now Web3Auth’s system has a vulnerability, and Keplr has confirmed that the private keys of some users who logged in this way were exposed. Some accounts had already seen transfers they hadn’t initiated, so Google and Apple logins were suspended immediately.
The most worrying part is that some people open
post-image
ATOM+0.49%
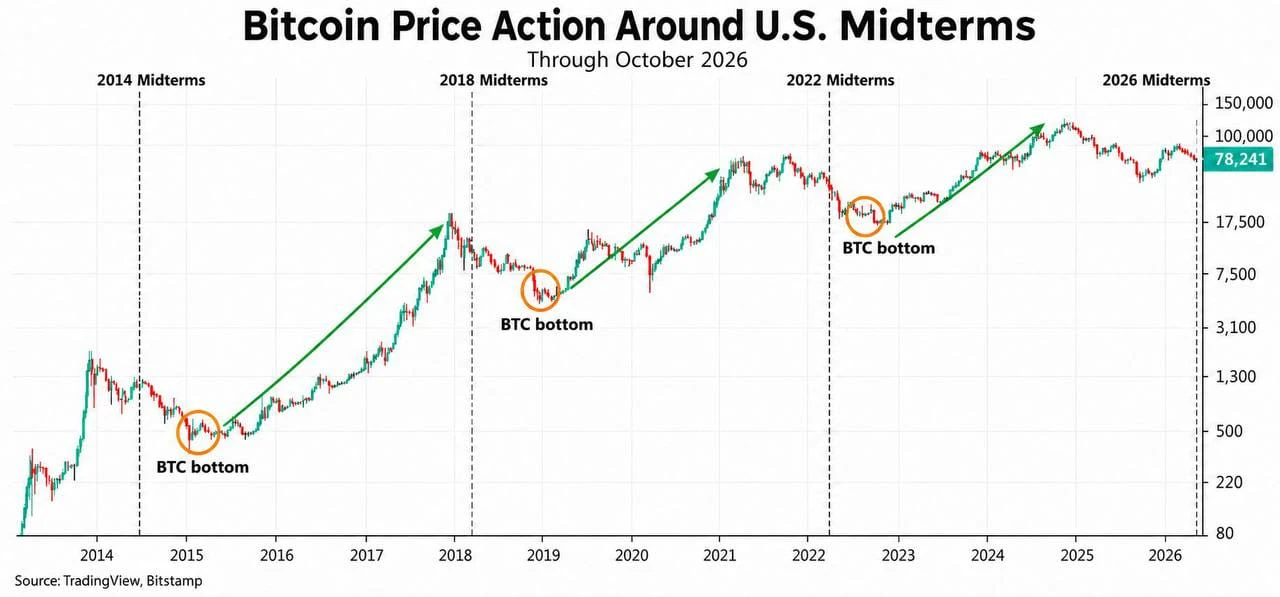
🚨 Bitcoin’s last THREE cycle bottoms came shortly after the U.S. midterm elections.

2014 → 71 days later
2018 → 39 days later
2022 → 13 days later

The next U.S. midterm election is Today, Nov 3rd.

Aligning with our Prediction “Bottom in Late Nov or Mid Dec!”

$BTC
$ZEC
$KOMA
$IDOL
$ONE #ShareWeekly #USCPIDataIncoming #USAIStocksHitHard #BTCETFOutflowsContinue
post-image
BTC-0.65%
ZEC+1.29%
KOMA-4.07%
IDOL-7.01%
ONE-1.38%
  • 2
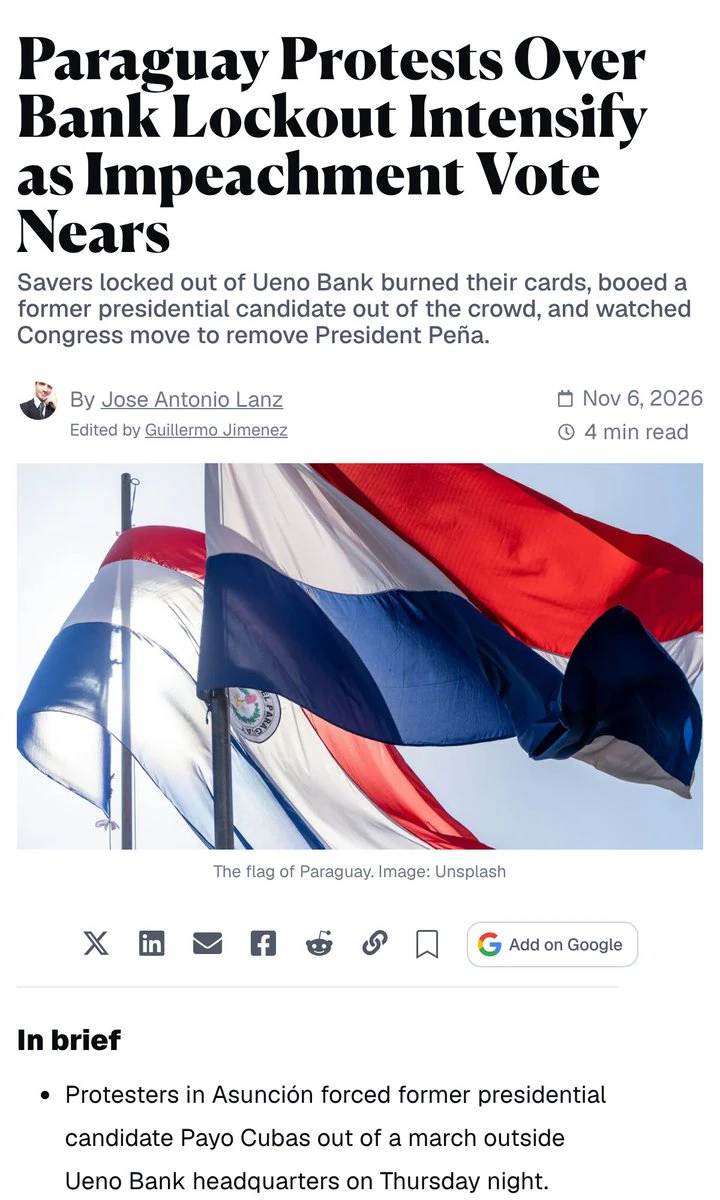
After all the hacks this year we understand that even if your money is in a big exchange, it doesn't mean you're safe from being unable to use it.
Yet this looks more troubling...
In Paraguay a digital bank was taken over this week and about 3 million people, around 60% of the country's adults, got locked out of their accounts.
The guarantee covers up to about $36,000 per person, but the first payouts only go to accounts with up to about $1,600.
post-image
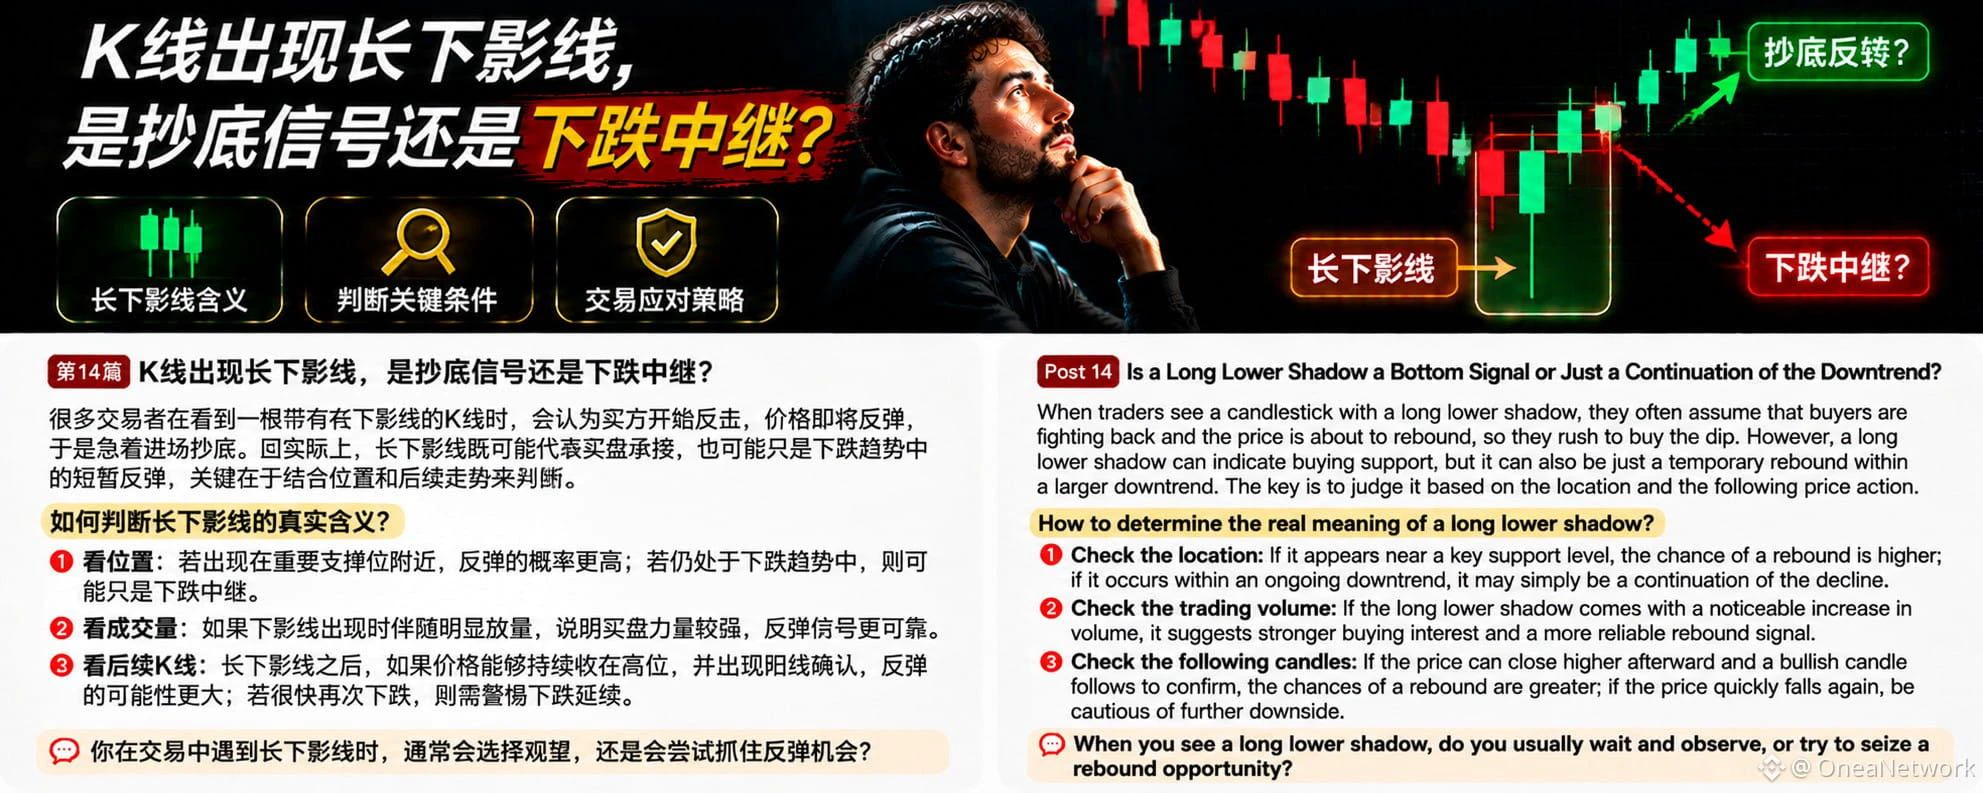
In BTC trading, many people see a candlestick with a long lower wick and assume buyers are starting to fight back and the price is about to rebound, so they rush in to buy the dip. But in reality, a long lower wick does not necessarily mean a trend reversal; it may simply be a brief bounce during a decline.
So, how should you judge?
First, look at where it appears. If a long lower wick forms near an important support level from earlier, it suggests that strong buying may have absorbed selling pressure after the price fell to this area, making the potential rebound a more meaningful signal. But
post-image
BTC-0.67%
BTC | ETH | Gold | Crude Oil
live-cover
LIVE2,796
post-image
HYPE+0.33%
Small amounts add up over time! Let them snowball
post-image
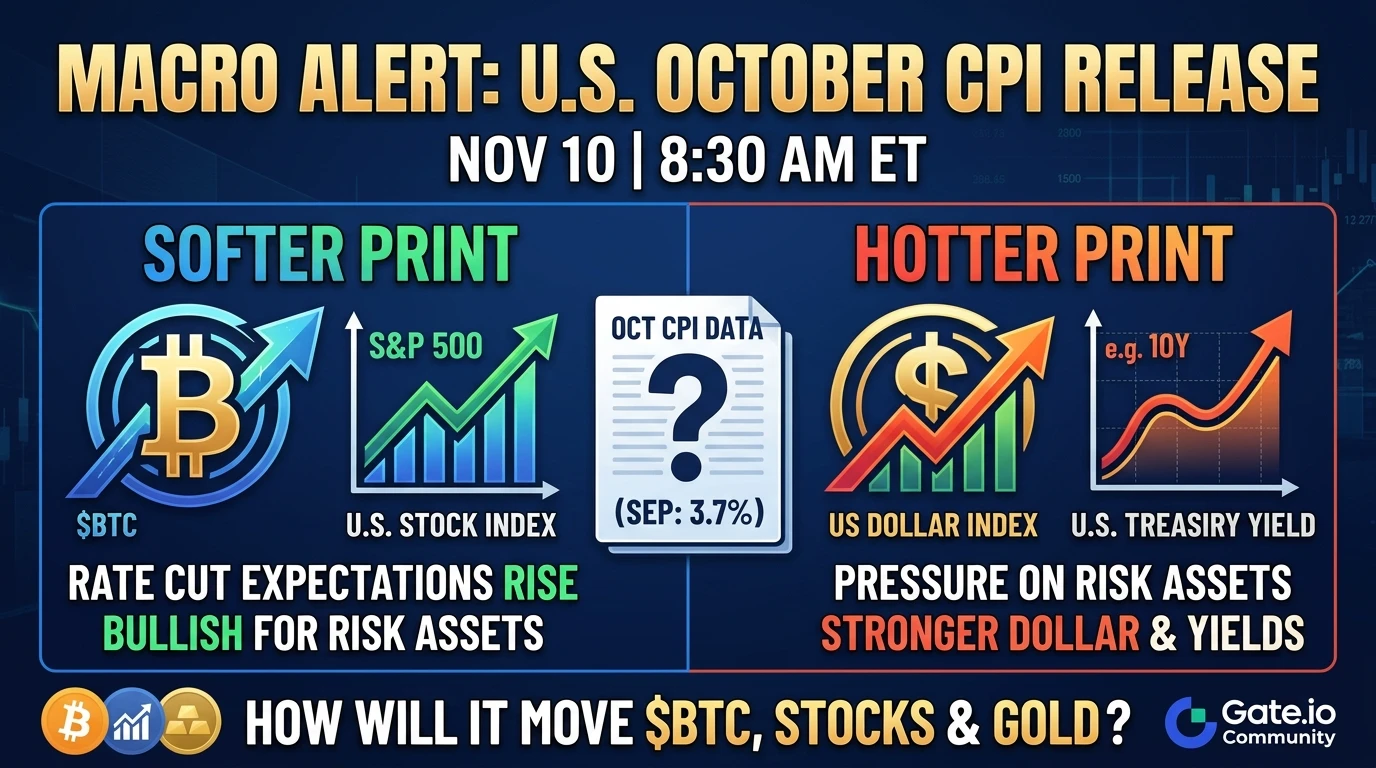
🚨 Macro Alert: The U.S. October CPI Print is Approaching!

All eyes are turning to the upcoming macroeconomic data release. The U.S. October CPI report is scheduled to drop on November 10 at 8:30 a.m. ET. With September's CPI having printed at 3.7% year-over-year, market participants are watching closely for concrete signs that inflation—particularly core CPI—is continuing to cool.

📈 Potential Market Scenarios
The Bullish Case (Softer-than-Expected Print): If inflation cools more than anticipated, expectations for future interest rate cuts will strengthen. This typically triggers a weaker U
post-image
BTC-0.67%
XAU+0.38%
NAS100+1.90%
AMD+11.55%
No wonder they were X's former product lead—they really know their stuff.
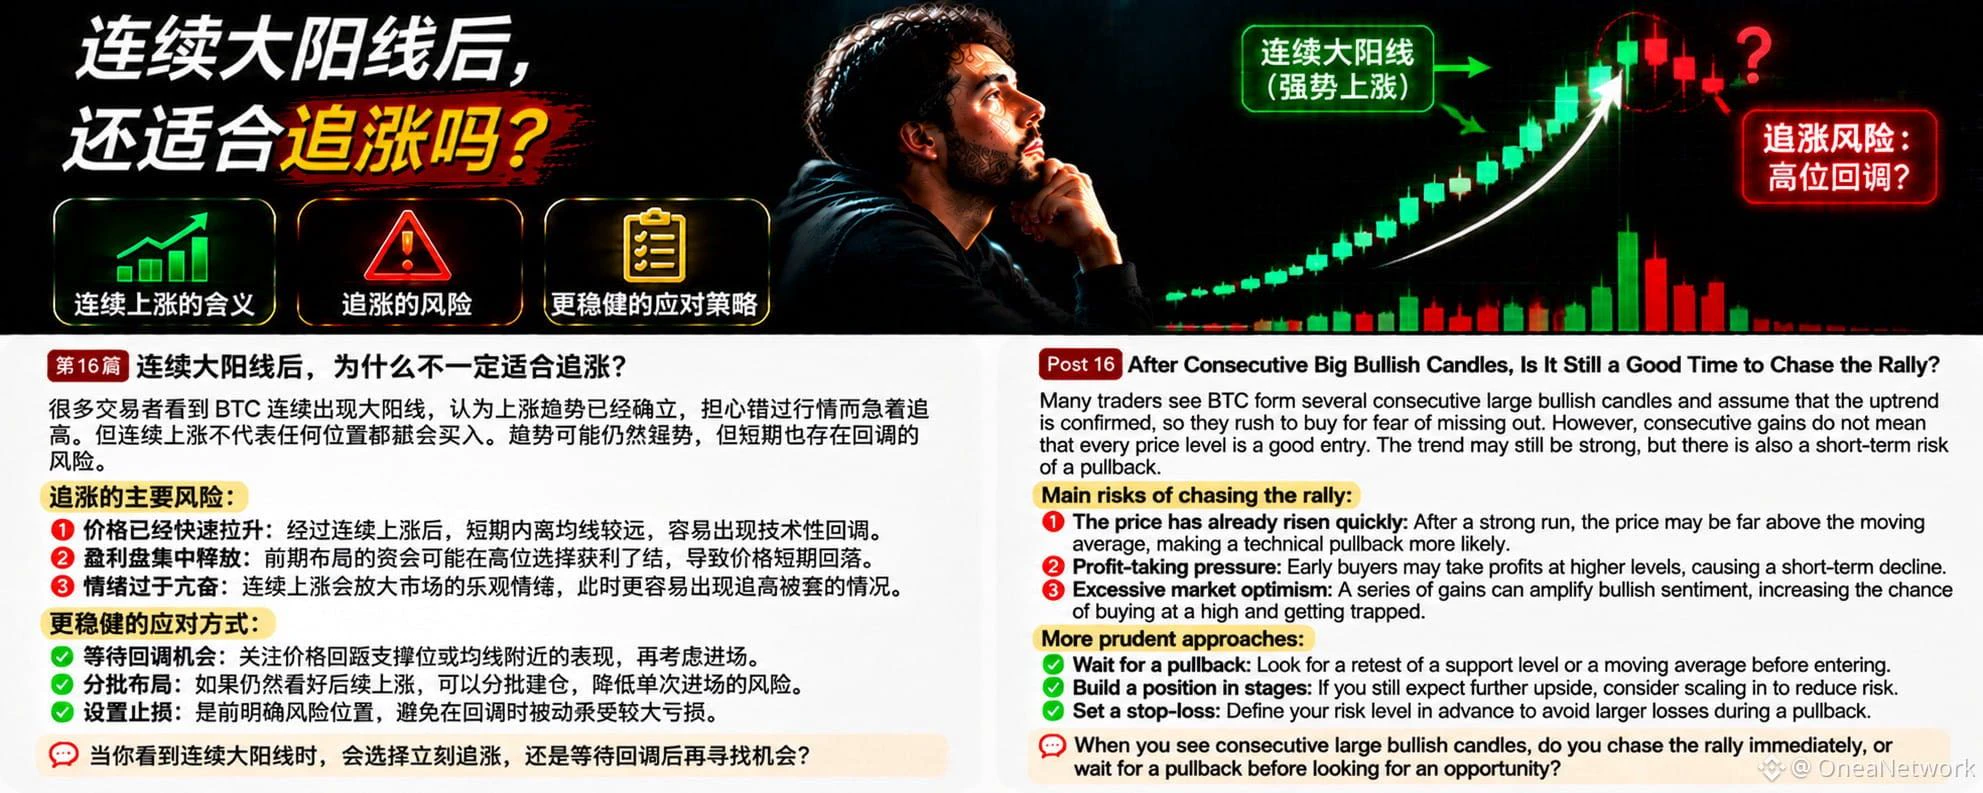
In BTC trading, many people see several large bullish candles in a row and assume the uptrend is fully established. Afraid of missing out, they rush to chase the rally. But consecutive gains do not mean every price is a good entry point. Sometimes, the faster the rally, the more cautious you should be about the risk of a short-term pullback.
Why might it not be a good idea to chase a rally after several large bullish candles?
First, the price may have moved away from a reasonable level. After a series of gains, the short-term price may be far above the moving average. The market needs time to
post-image
BTC-0.67%
$LINK 🔎

LINK, the native token of Chainlink, is trading at approximately $10.80. On the charts, the price remains below all short- and medium-term moving averages. While LINK shed nearly 19% of its value in October—falling significantly below its late-September peak—the same period saw major ecosystem projects announce their transition to Chainlink’s cross-chain infrastructure. Meanwhile, Bitcoin is struggling to hold the $75,000 level, and the market’s attention is firmly fixed on Tuesday’s U.S. CPI (Consumer Price Index) data.

Where does the contradiction surrounding LINK begin?

In the c
LINK-0.18%
  • 3
  • 2
$ARB 's chart lows keep getting higher, and the pace is steady. Guys, we can grab a bowl of Vietnamese pho while we're at it this time around 🤩

Go long now 🔥🔥
First target: 0.182 Second target: 0.2 Third target: 0.25 Defense line: 0.139
$IDOL $AIN should also be on your radar.

Risk warning: The above is solely my personal opinion and does not constitute investment advice. Contract trading carries extremely high risks, so please be sure to manage your position size.
post-image
IDOL-6.71%
Finally back in the Magic City
It’s so cold in the Magic City too
It’s gloomy out 🌧️
I just want to snuggle under the covers this weekend~
Any besties still snuggled up in bed too? 😈
post-image
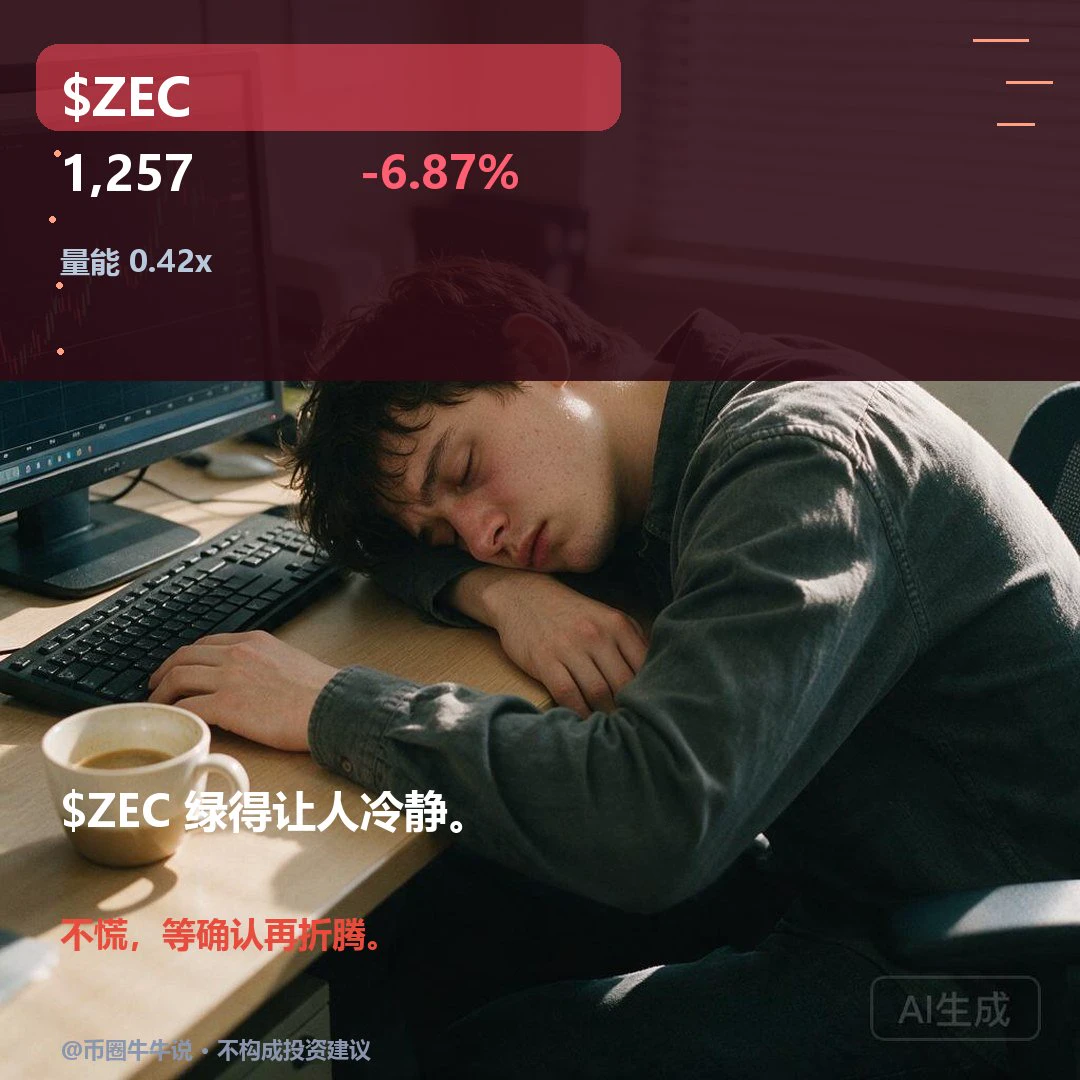
$ZEC Current price: 1257.38, 24H -6.87% (1235.00–1350.19). 1H is weak: RSI 40.10, EMA20 1270.54, support 1235.00/resistance 1334.33; 4H is weak: RSI 51.71, EMA20 1281.78, support 1183.38/resistance 1387.89. A move higher only matters if price reclaims and holds above the 1334.33 resistance; a break below the 1235.00 support would signal further weakness. Review whether price holds above 1334.33 and recovers after losing 1235.00; volume is only 0.42x. Without volume or a recovery, the setup is invalidated. The market is volatile; for observation only.
post-image
ZEC+1.16%
BIRB | Short 🔴 | Bearish | 15m 24h: -8.38% | Volume: 26.4M USDT. Short rationale: Price below EMA200; EMA20/50/200 in bearish alignment; RSI14 at 32.2; MACD histogram negative; ADX14 at 31.5; volume at 0.59 times the 20-candle average; trend pullback/continuation. Entry: 0.08872 Stop loss: 0.0924167 Take profit 1: 0.0840992 | Take profit 2: 0.0813267 | Take profit 3: 0.07763Entry price is for reference only; do not chase. The strategy is invalidated if the stop-loss level is hit. Technical analysis only; not financial advice.$BIRB $BIRB
post-image
BIRB-16.68%
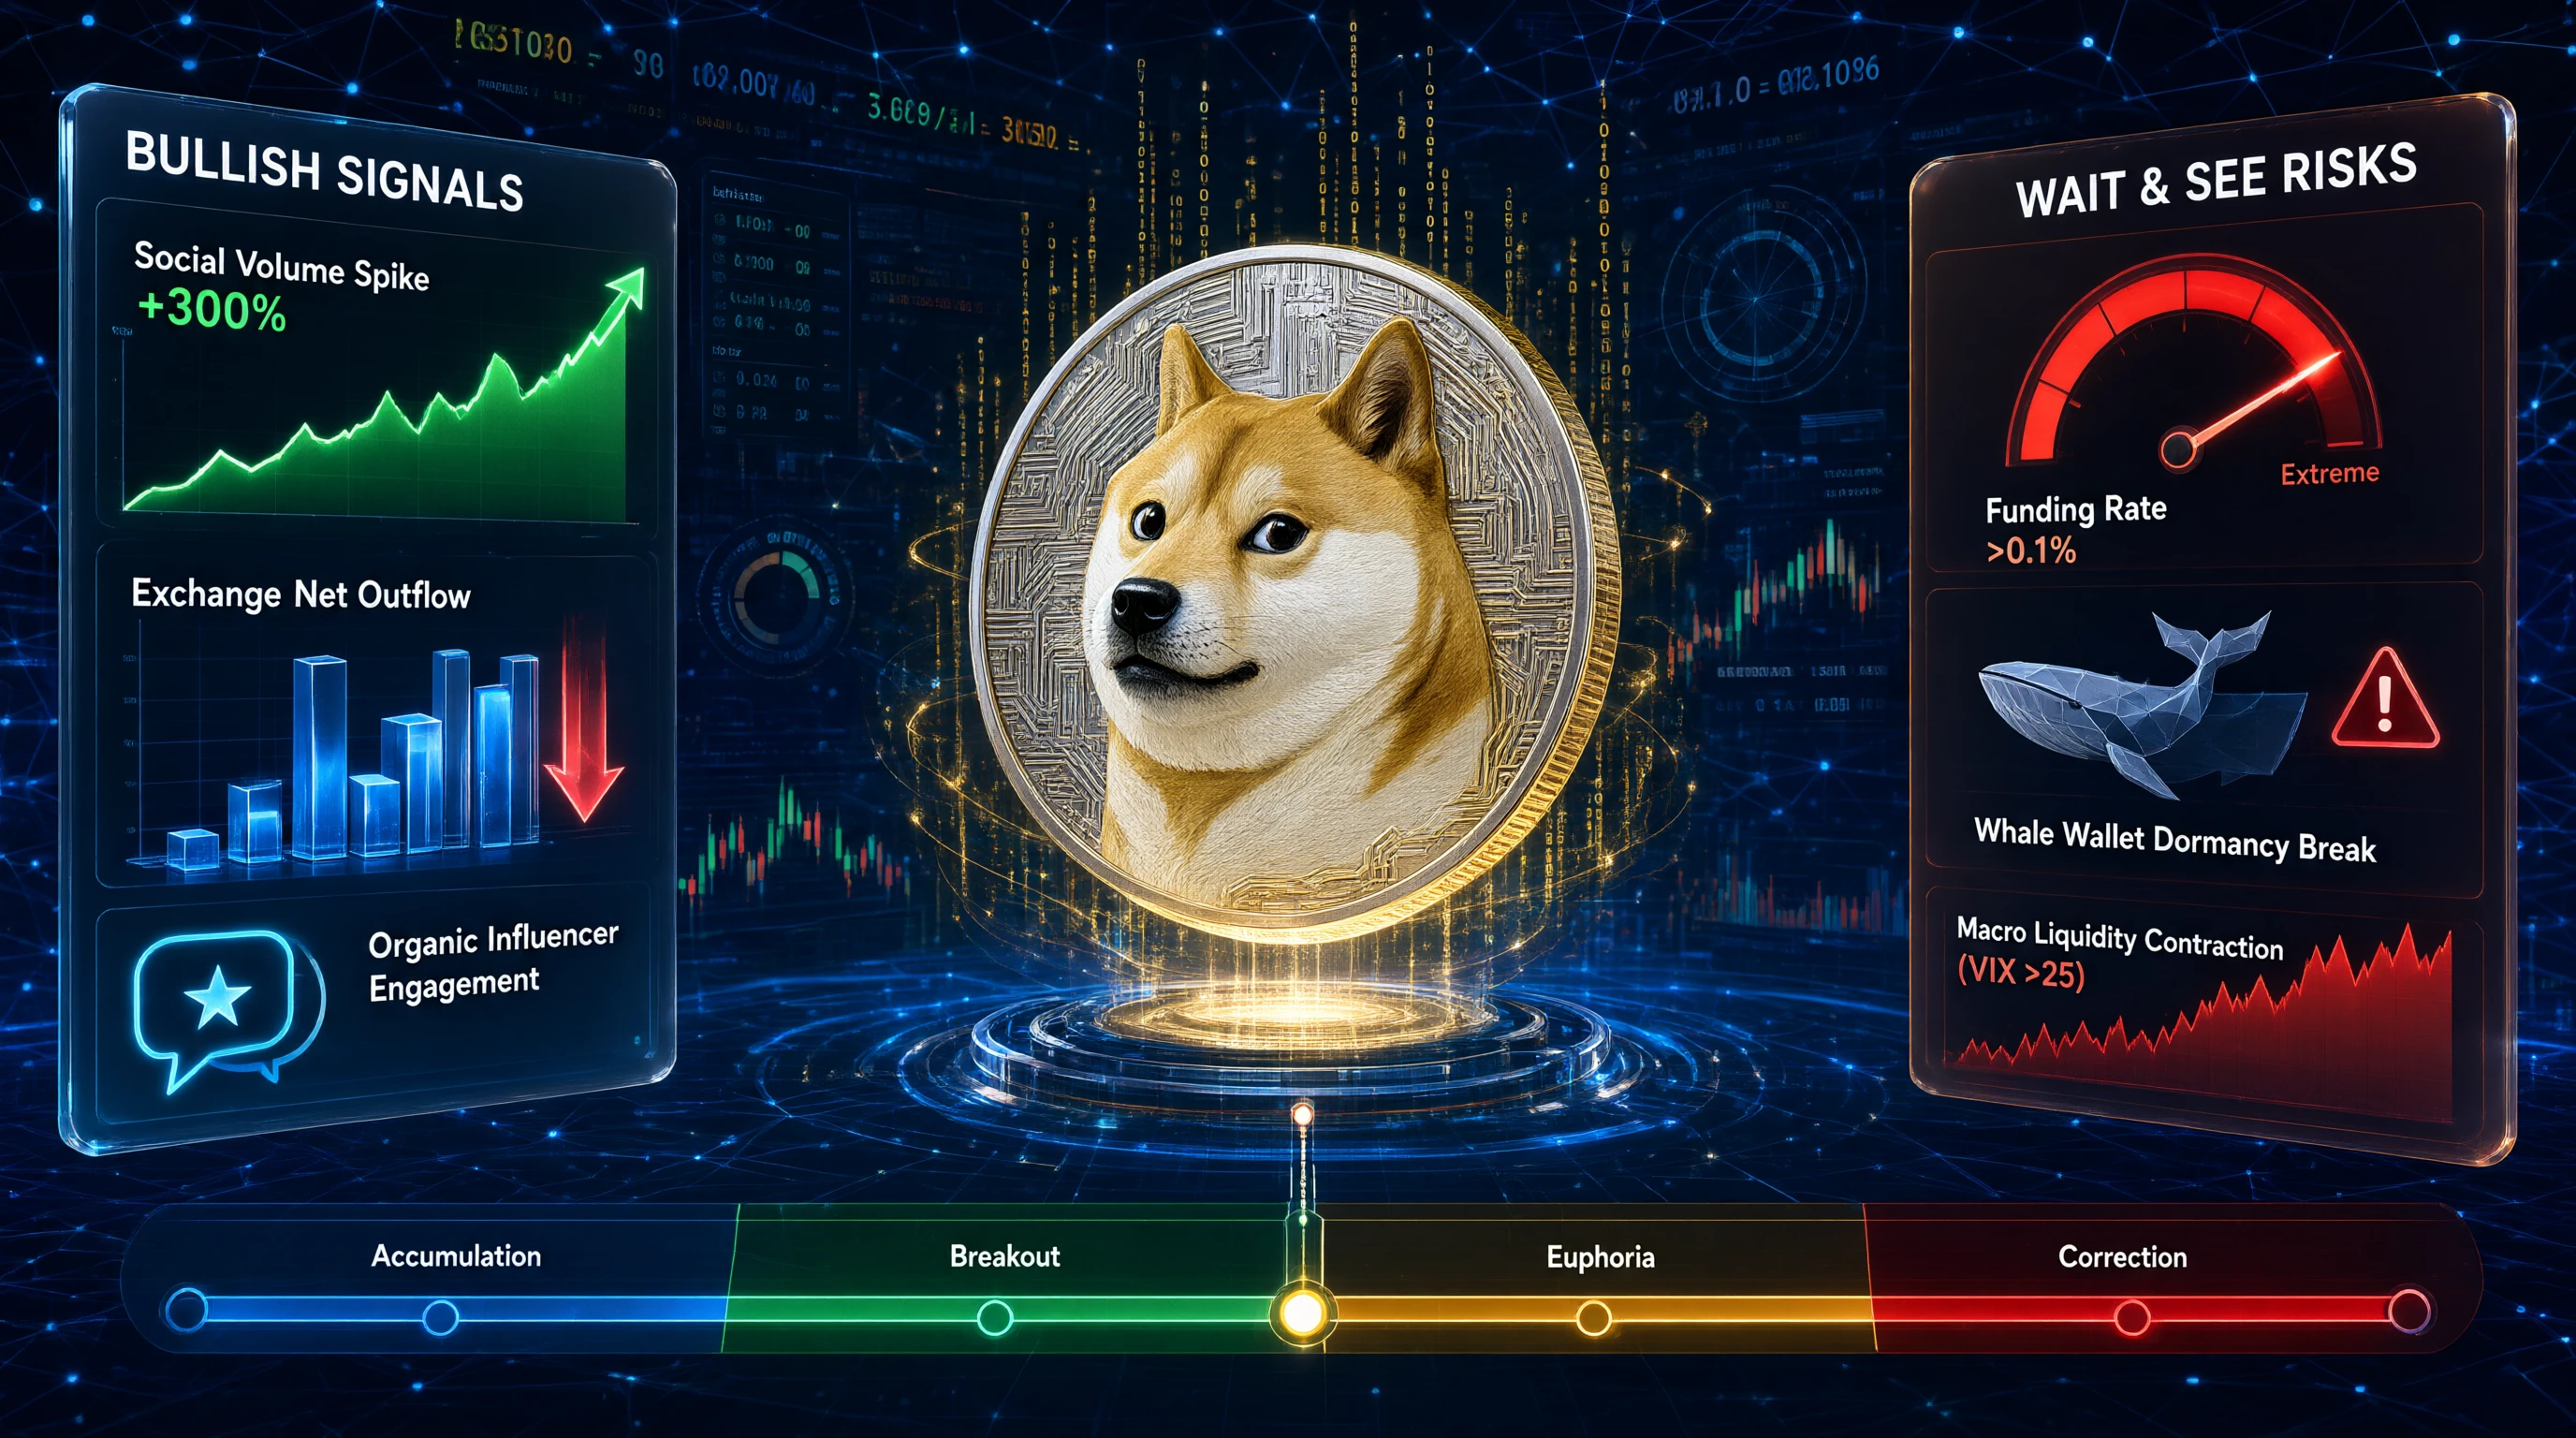
Applying traditional equity analysis to $DOGE is a category error; this asset operates on meme economics, not fundamental valuation.

The question of bullish signals for Dogecoin cannot be answered through discounted cash flow models or balance sheet scrutiny. $DOGE is the world’s most liquid meme asset, and its price discovery mechanism is driven entirely by social sentiment, celebrity influence, and speculative liquidity cycles. Treating it as a company fundamentally misaligns your analytical framework with market reality. Success requires evaluating cultural momentum, on-chain activity patt
post-image
DOGE-0.18%
  • 3
  • 2
Silicon Valley spent $100 billion convincing Wall Street that whoever stockpiled the most Nvidia GPUs would win. Then a small Chinese lab trained an open-source model for less than $6 million, and $600 billion was wiped off U.S. tech stocks in a single day. Nobody believed it when the head-and-shoulders top broke down. The sharpest wicks came in the early morning, when liquidity was thinnest. The candlesticks had already told the story. If you disagree, tell us why.
post-image
NVDA+2.80%
Load More

Join 40 M users in our growing community

⚡️ Join 40 M users in the crypto craze discussion

💬 Engage with your favorite top creators

👍 See what interests you

Trending Topics

USCPIDataIncoming

1.04k Views1.48k Discussing

The U.S. October CPI report will be released on November 10 at 8:30 a.m. ET. September CPI came in at 3.7% year over year, and markets will be watching closely for signs that inflation is cooling, especially in core CPI. A softer-than-expected reading could strengthen rate-cut expectations, while hotter inflation may pressure risk assets through higher Treasury yields and a stronger dollar. How do you think this CPI print will move $BTC, U.S. stocks and gold?

USAIStocksHitHard

23.56k Views3.69k Discussing

USNonfarmPayrolls

40.34k Views4.38k Discussing

View More