

Share your thoughts
placeholder
Article
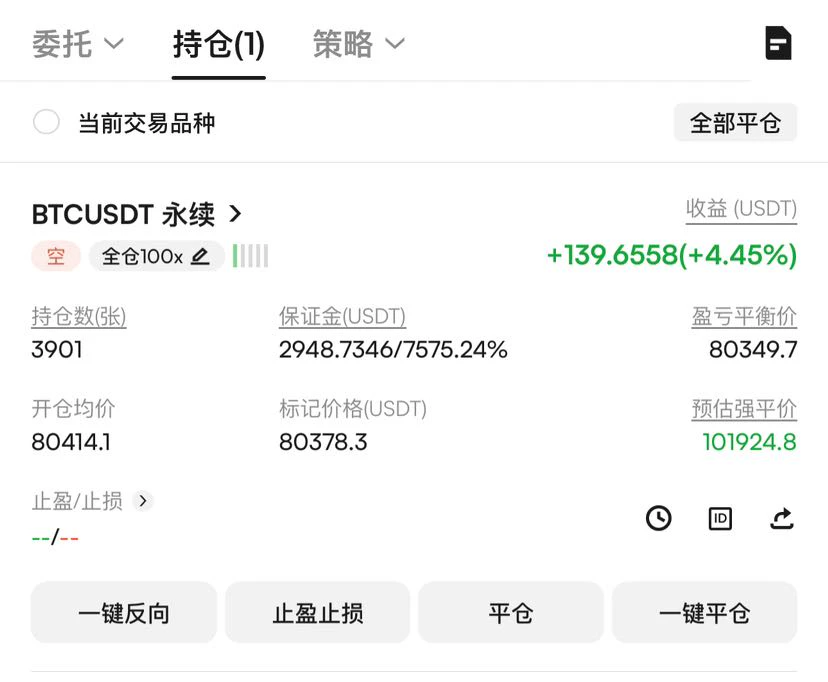
A few days ago, my hand trembled as I set the stop-loss; this morning I realized that was an unnecessary act of filial piety. When the screen was all green, $PROM was still holding firm around 7.149, but every push upward fell just short. I know this rebound pattern all too well—it was merely a fake move put on for retail traders.

After seeing the bearish news, the rebound was even feebler. My judgment at the time was simple: resistance above was obvious, and there was no one to buy into a move higher, so I went with the trend. Then 5.131 taught me a lesson directly. With 80% locked in, get
post-image
PROM+1.20%
ETH-2.37%
LAB+0.66%
Everyone’s watching $HOME /USDT—but the 95% short signal says the rug is already pulled.

$HOME /USDT - SHORT

Trade Plan:
Entry: 0.00604 – 0.00608
SL: 0.00622
TP1: 0.00594
TP2: 0.00587
TP3: 0.00575

Why this setup?
Why now?
- 4h bias: SHORT (95% confidence)—not a guess, a statistical edge.
- Daily trend: bearish; the 1h pivot at 0.00607 is rejected.
- RSI 15m (57.58) shows a weak bounce—sellers reloading at 0.00606–0.00608.
- Targets: TP1 0.00594, TP2 0.00587—that’s a 3%+ drop from entry.
- Invalidation only at 0.00618—so the risk/reward is 1:2 from here.

Debate:
If the daily t
HOME-1.95%
I originally wanted to cut the loss and sacrifice the position to heaven, but heaven never got its offering—the meat roasted itself. 🔥 When $BROCCOLIF3B plunged intraday, it sold off hard on heavy volume, with waves of selling pressure and no one catching the rebound. This wasn’t an ordinary pullback; key resistance overhead crushed it, so I decisively opened a short around 0.007890, with the stop-loss placed in a safe zone. If I’m wrong, I’ll accept it; if I’m right, I’ll hold.

Looking at the chart again just now, the price has slid to 0.006984, with +56.71% secured. Feeling good, brother
post-image
DOGE-4.93%
BNB-0.53%
Everyone has probably seen ZEC’s price action.
The price surged to 1050, and market hype has completely exploded.

Objectively speaking, ZEC’s sharp rally this time is largely driven by narrative speculation and large-capital buying, rather than a simultaneous fundamental breakout. Friends holding long positions must take profits and secure them in their pockets in time! Let me remind everyone of its historical price action: it previously plunged rapidly from 750 to 150.
For tokens with relatively small circulating supplies, when major players distribute their holdings, the decline can be abs
post-image
ZEC+7.15%
$NVDA ‌Nvidia (NVDA) stock is trading at $230.37, up 0.86% in intraday trading. The daily range is between $229.85 and $234.75, having opened at $231.09. The company, which closed at $228.40 yesterday, has a total market capitalization of $5.55 trillion ($5,549.98 billion), with a Price-to-Earnings (P/E) ratio of 29.195 and a year-to-date P/E ratio of 47.13.
On the technical side, the positive alignment of moving averages continues to support the price from below. On the daily chart, the 5-day moving average (MA5) is at $224.31, the 10-day moving average (MA10) is at $219.84, and the 30-day
NVDA+0.87%
  • 1
Financial News, Crypto Market Updates, Real Trading Strategies
live-cover
LIVE1,730
$TRIA Signal】1H pullback stabilizes, bulls follow up with an advance
$TRIA 1H MACD red bars are shortening, and the price is consolidating above EMA20. The 4H Bollinger Bands are widening upward, OI remains stable, and buy orders account for 53% of the order book.
🎯 Direction: Long
⚡ Entry/Limit Order: 0.00498400 - 0.00499900
🛑 Stop-Loss: 0.00494901
🚀 Target 1: 0.00507398
🚀 Target 2: 0.00511148
🛡️Trade Management:
- Execution Strategy: After reaching Target 1, reduce the position by 50% and move the stop-loss up to breakeven. If the price falls back to the entry level, exit automatical
post-image
TRIA+25.51%
BTC-2.46%
ETH-2.43%
SOL-3.39%
📊 Bitcoin Is Pulling Capital Back Into Its Orbit
August’s crypto rebound did more than lift prices — it highlighted a growing rotation toward BTC-linked assets.
Bitcoin miners are once again trading like leveraged plays on Bitcoin, while companies with significant BTC and ETH exposure are attracting renewed attention.
Meanwhile, AI tokens are losing some of the spotlight as traders rotate toward assets with more direct exposure to crypto’s core market drivers.
🔄 What does this BTC rotation mean?
If capital continues moving toward Bitcoin, the impact could extend beyond BTC itself:
• BTC beco
post-image
BTC-2.46%
ETH-2.43%
  • 7
  • 1
I didn’t do anything—I just went to the restroom, and when I came back, the K-line had already done the work for me. A few days ago, while watching the market in the early morning, $WLFI was struggling to rebound; no one was taking it when it pushed up, and volume never managed to follow through. At that moment, I knew the key resistance above was no decoration. I reminded everyone not to rush into longs and gave a high-level short setup directly around 0.05841 on the rebound. Looking back now, the timing was truly perfect. The price has now dropped to 0.05685, with unrealized profit at +188.2
post-image
WLFI-2.03%
BNB-0.53%
SOL-3.29%
BTC Technical Outlook: Bitcoin Holds Above $79K as Bulls Target $82K+
Bitcoin is trading around $79.7K, maintaining its bullish recovery after breaking above the previous consolidation range. BTC is now approaching a major resistance cluster around $80.6K–$82.9K, where sellers previously stepped in.
📈 EMA Structure
- 20 EMA: $75,678
- 50 EMA: $71,043
- 100 EMA: $69,630
- 200 EMA: $72,491
BTC is trading above all major EMAs, confirming a strong bullish medium-term structure. The 20 EMA at $75.7K is the key dynamic support.
📐 Fibonacci Levels
- 0.236: $75,045.77
- 0.382: $82,919.00
- 0.500: $8
BTC-2.46%
$Lucia of GTA 2x pump coming 🚀
TcnKFgDZc6RhAz83JHHbWeZ5wLc2at8iHK6FhsxkTLh
#crypto #altcoins $sol
post-image
SOL-3.39%
I originally wanted to cut losses and sacrifice to the heavens, but the heavens weren't appeased—the meat cooked itself instead. 🍖
During the repeated intraday swings, I opened this short at 2460.00. The logic was simple: insufficient buying support, with every rebound looking paper-thin and the overhead resistance clearly visible. The candlesticks kept grinding back and forth, but the center of gravity was quietly moving lower. This kind of move is the most deceptive, but also the easiest to hold.
Now at 2454.23, I’ve pocketed 80%. It was truly sluggish at first, but once it moved, it felt g
post-image
XRP-4.39%
DOGE-4.93%
I was just about to go to the forum and rant, but then I saw my balance and thought, forget it—the market is always right. A few days ago, I was still lying in bed before sleep, struggling over whether to cut losses on $SIREN . When I woke up this morning, I found that the candlestick chart had figured out the direction on its own.

When the market was dumped early in the session, I watched for a while. The resistance above was obvious, and the rebound was weak—every upward push fell just short. Isn't this a textbook bull trap? While everyone else was sitting on the sidelines, I directly place
post-image
SIREN-1.48%
SNDK+11.75%
ETH-2.37%
Didi! I can't sleep, I really can't sleep! Give me a quick pullback wick at the close, okay! Let me break even! $BTC $ETH $SOL
BTC-2.46%
ETH-2.43%
SOL-3.39%
$DRAM notable breakout
post-image
DRAM+6.50%
NVDA Still Leading The AI Race — Can Bulls Push Higher?
$NVDA is trading around the $230 zone, and this area is becoming very interesting for the next move. After recovering from the recent pullback, Nvidia is showing strength again as buyers continue to defend important levels.
My view is that NVDA remains one of the strongest AI-related stocks because the market is still focused on AI infrastructure growth, data center demand, and Nvidia’s dominant position in advanced chips. Recent momentum has improved as investors regain confidence in the AI sector.
From a technical perspective, holding
post-image
NVDA+0.87%
Gm everyone ☀️
post-image
When the tide rises, the returning ripples will come; only when the waves are calm do you recognize the ferryman✨
$BTC $ETH
Many of you who trade have probably experienced such agonizing moments.
You identify a support level and safely enter a long position, convinced that the market is about to move higher.
But the market shows no mercy. A sell-off comes without warning, prices plunge in a straight line, and your position is suddenly trapped.
Before entering, you have carefully thought through the price level, logic, and timing. But no one can predict the moves of large capital in advance, a
post-image
BTC-2.39%
ETH-2.37%
This was purely the market being in a good mood and casually handing out some coins, which happened to land right on my head. 🎲 When I checked the charts right after lunch, $ETH W bounced to 0.2720, with each rebound weaker than the last and insufficient volume—a classic weak rebound. I thought, “Isn’t this basically handing money to the shorts?” So I decisively opened a short. When the market gives you a signal, don’t hesitate—hesitation leads to defeat. 😏
It then started sliding down on its own and has now touched 0.2656, with +46.32% secured. Feels great—I can enjoy a good meal after this
post-image
ETHW-1.73%
ADA-3.66%
ETH-2.37%
Load More

Join 40 M users in our growing community

⚡️ Join 40 M users in the crypto craze discussion

💬 Engage with your favorite top creators

👍 See what interests you

View More