Square
Following
Hot
News
Notifications
Profile
Share your thoughts
placeholder
Article
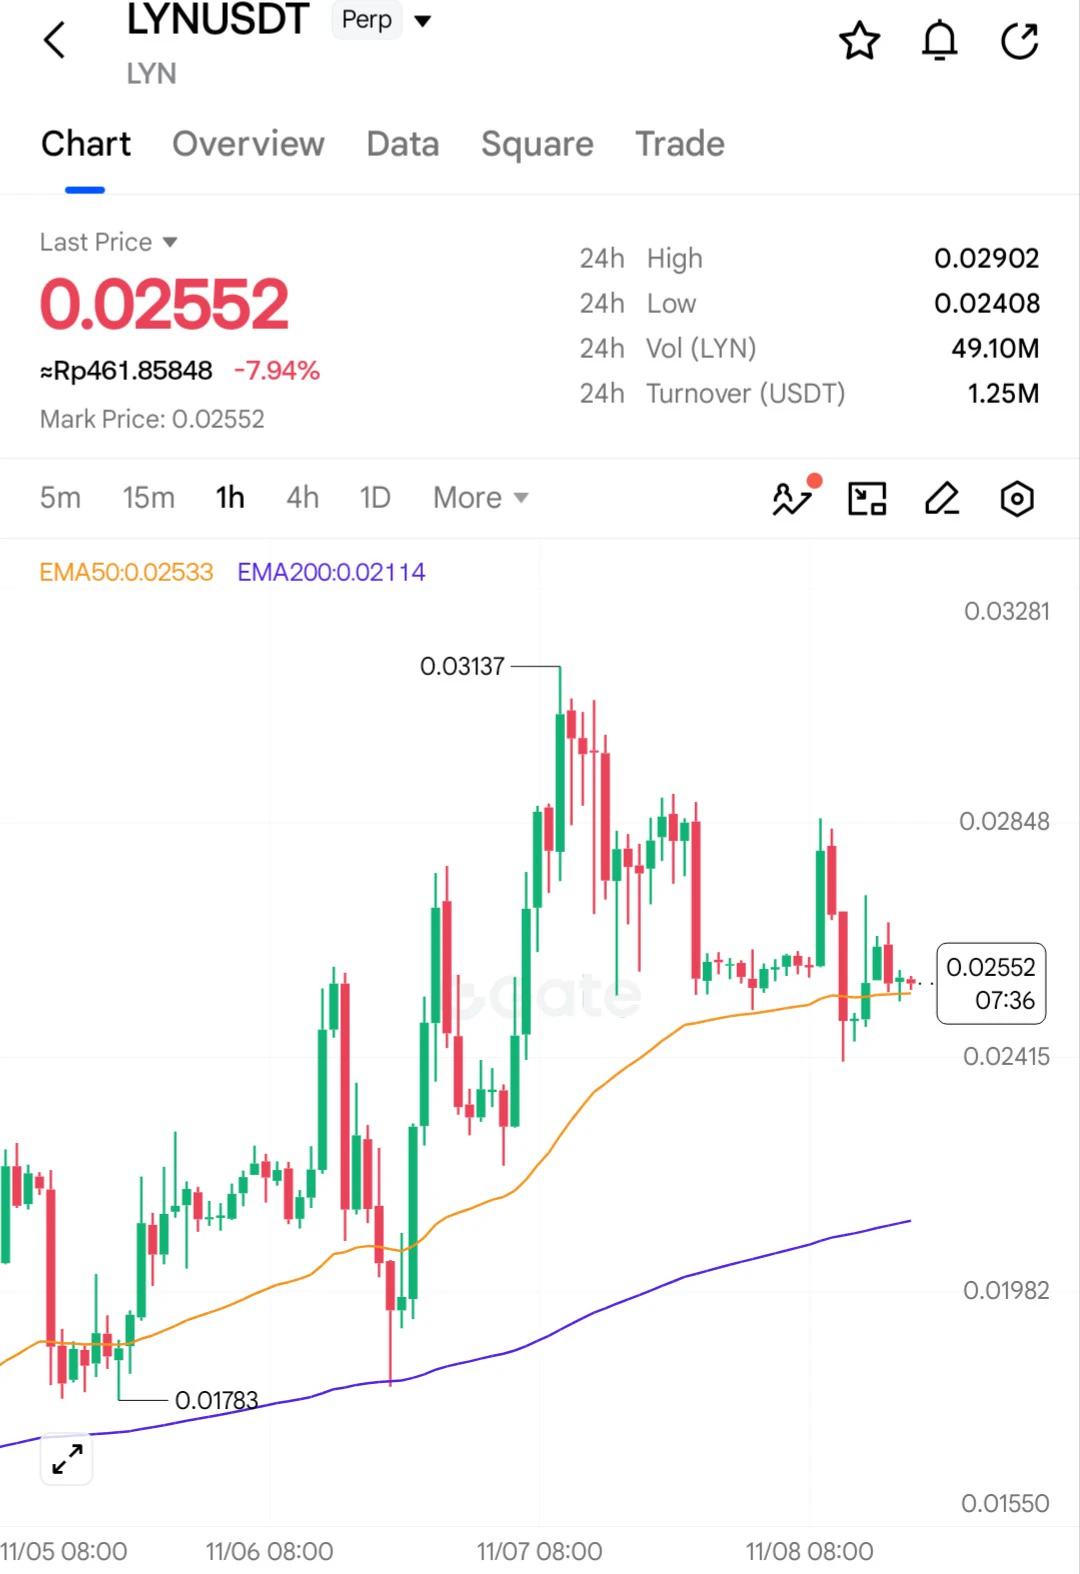
LYN, I thought the price was already too high. I opened a SHORT position, and it hit the Stop at Break Even that I had set before continuing to climb even higher.😅
#SquareTradingExpert
#WCTCS9
$LYN ‌
post-image
LYN-0.44%
#Gate股票畅聊季 #美股财报季 Can AI trading emerge from the gloom next week?

U.S. tech stocks faced a sharp sell-off this week, as the AI investment boom came under a dual test from a changing policy environment and wavering confidence in capital markets.
Although chip stocks rebounded on Friday, the Nasdaq remains in correction territory, and doubts about returns on AI infrastructure investment, financing capacity, and future growth prospects have yet to dissipate.

Looking ahead to next week, the U.S. October Consumer Price Index (CPI), Producer Price Index (PPI), and earnings from companies including
NAS100-0.07%
CRWV+6.18%
AMAT+4.19%
CSCO-2.05%
SPYX+0.01%
  • 5
Trenches
ZIG
Z
bade
b
ZIG
0x8c...1145
Market Cap
$.
Change
.
24h Vol
$.
Holders
.
STONK
S
bade
b
STONK
6GmA...UNgx
Market Cap
$.
Change
.
24h Vol
$.
Holders
.
IDOL
I
bade
b
IDOL
0x3b...ab07
Market Cap
$.
Change
.
24h Vol
$.
Holders
.
CLAUDIA
C
bade
b
CLAUDIA
2j5S...W2ZM
Market Cap
$.
Change
.
24h Vol
$.
Holders
.
MAGGIE
M
bade
b
MAGGIE
8rHo...PmZV
Market Cap
$.
Change
.
24h Vol
$.
Holders
.
CRYPTO MARKET BEST SIGNALS
live-cover
LIVE1,982
$NVDA ‌
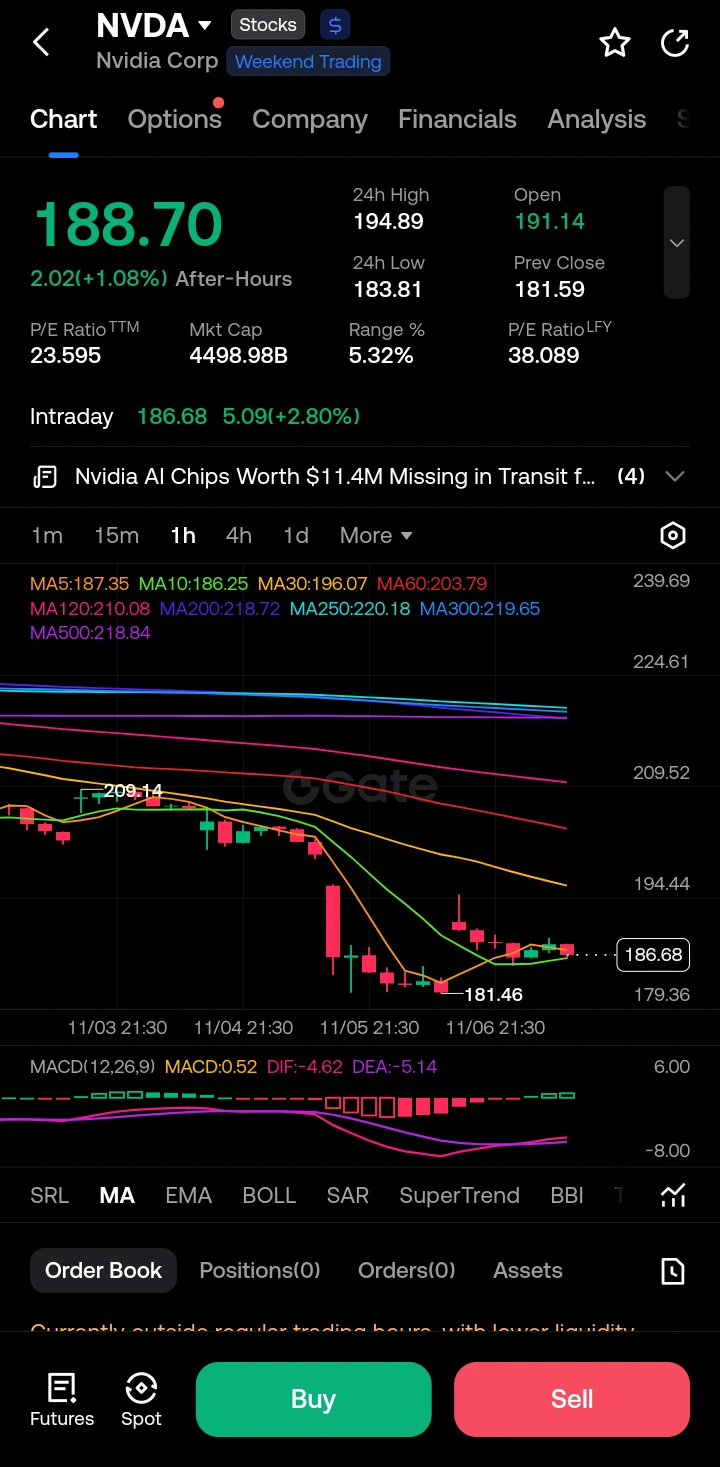
Looking at the 1-hour chart, NVDA has just recovered from a sharp drop down to the 181.46 level, forming a short-term rounded bottom. Price is currently consolidating near 186.68 (Intraday), but it remains capped below key moving averages (MA30 at 196.07, MA60 at 203.79). The MACD is showing a bullish convergence, with the MACD line crossing above the signal line and the histogram turning green, suggesting short-term upward momentum is building, though the overall trend remains weak.

Trading Plan:

I am looking for a quick momentum continuation trade to the upside. My entry point is
post-image
NVDA+2.80%
  • 1
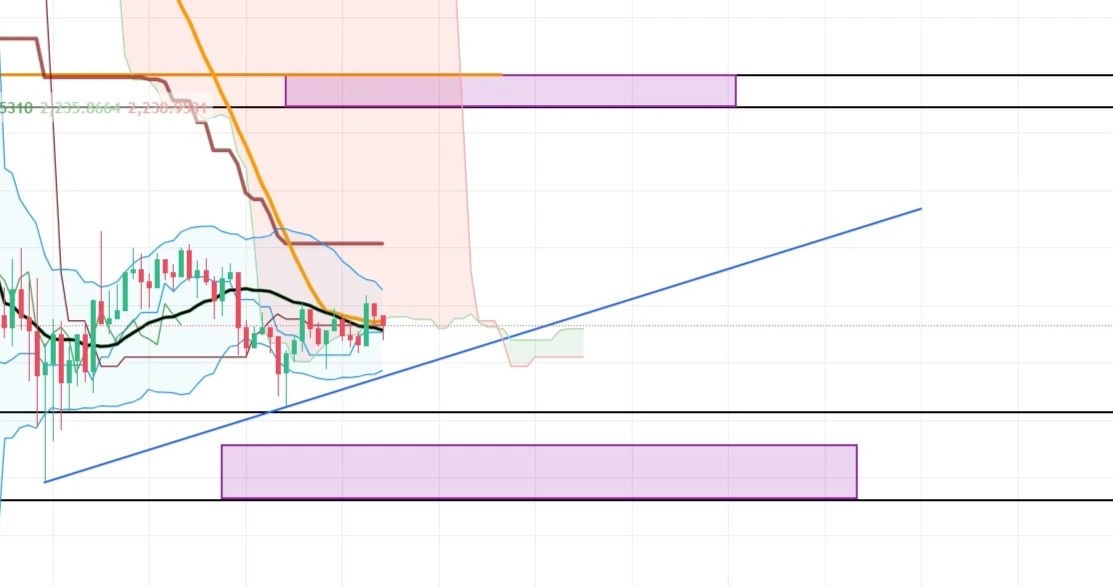
$ARB #Arb Consolidating Under Trendline, Breakout Can Lead Good Rally, But Risk Is High Due To Uncertain Iran -Usa Tensions
ARB+1.17%
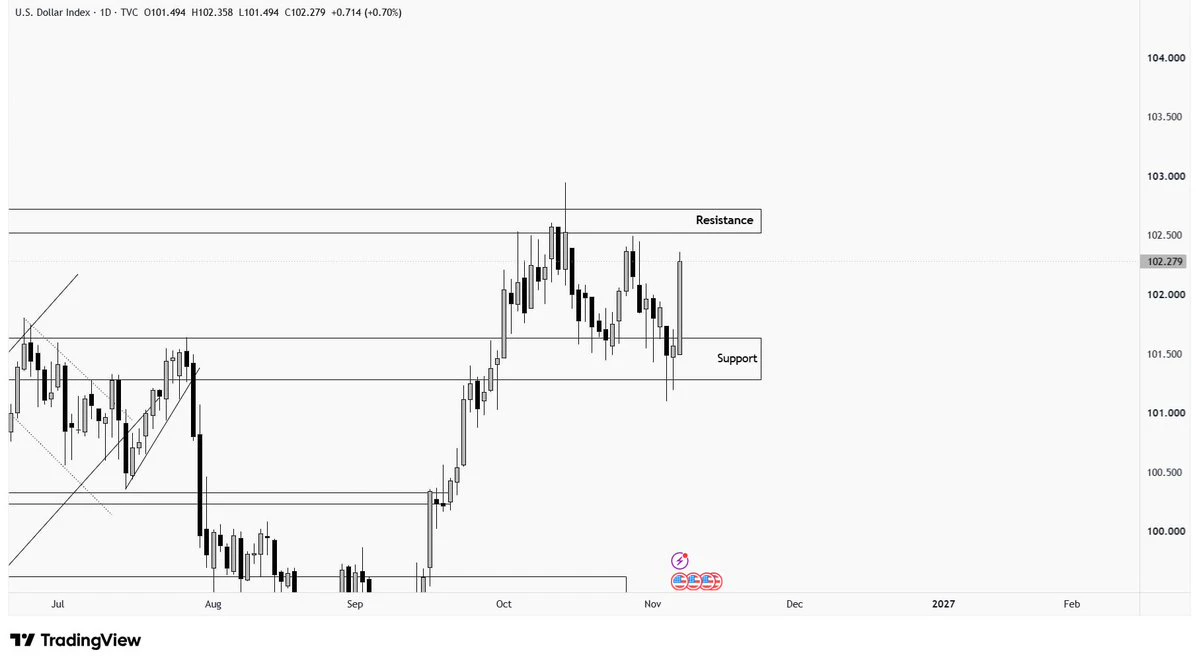
#DXY wicked below the support zone and eventually moved up near the resistance area. The Dollar Index is ranging, and next week we need to watch out for the breakout.
#ShareWeekly
$BTC $SOL $AAPL
post-image
BTC-0.67%
SOL-0.77%
AAPL-0.57%
aster-2:native is holding well in the red market.
Breakout will send it to $10.
post-image
ASTER-0.07%
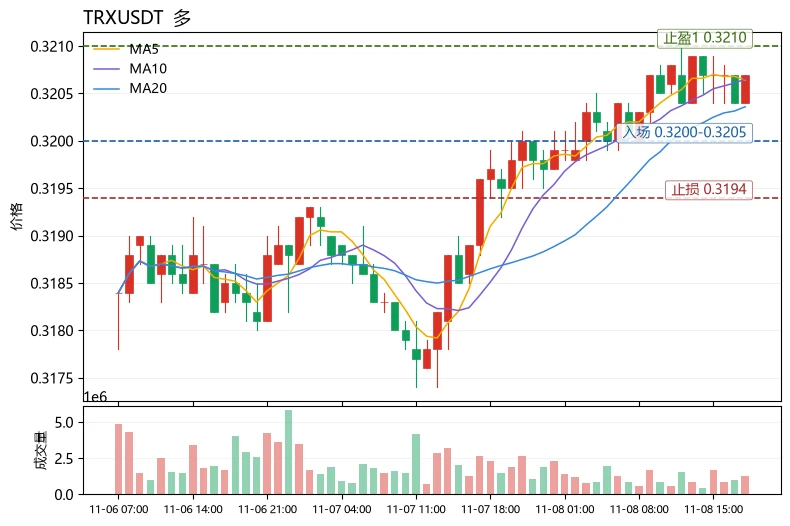
$TRX Short-term outlook is bullish, but this is a low-volatility war of attrition, so avoid chasing prices higher. The funding rate is positive at +0.0100%, indicating that longs are paying to hold positions and that funding favors the bulls. Price at 0.3207 is above MA5=0.32064 and MA20=0.32036, with the moving averages beginning to align bullishly; RSI=59.1 is not yet overbought. However, the MACD histogram is negative (-3.69e-05), the Bollinger Bands are only [0.319669, 0.321051], and the 30-candle range is about 1.12%, indicating insufficient momentum. The Fear & Greed Index is 28, in the
post-image
eur
eureur
Gate.Fun
MC:$5.55KHolders:3
0.06%
TRX+0.42%
UNI+3.05%
1. Comprehensive market analysis for January 8
The bearish daily structure remains intact. After a decline, the market is currently in a weak corrective consolidation, with no confirmed trend reversal signal. The medium- and long-term resistance levels overhead are far away and unlikely to be reached directly in the short term.
The 4-hour chart has formed a converging consolidation structure, with the Bollinger Bands gradually narrowing and downward momentum easing. The market is entering a phase where bulls and bears are building momentum before choosing a direction. The first resistance zone
post-image
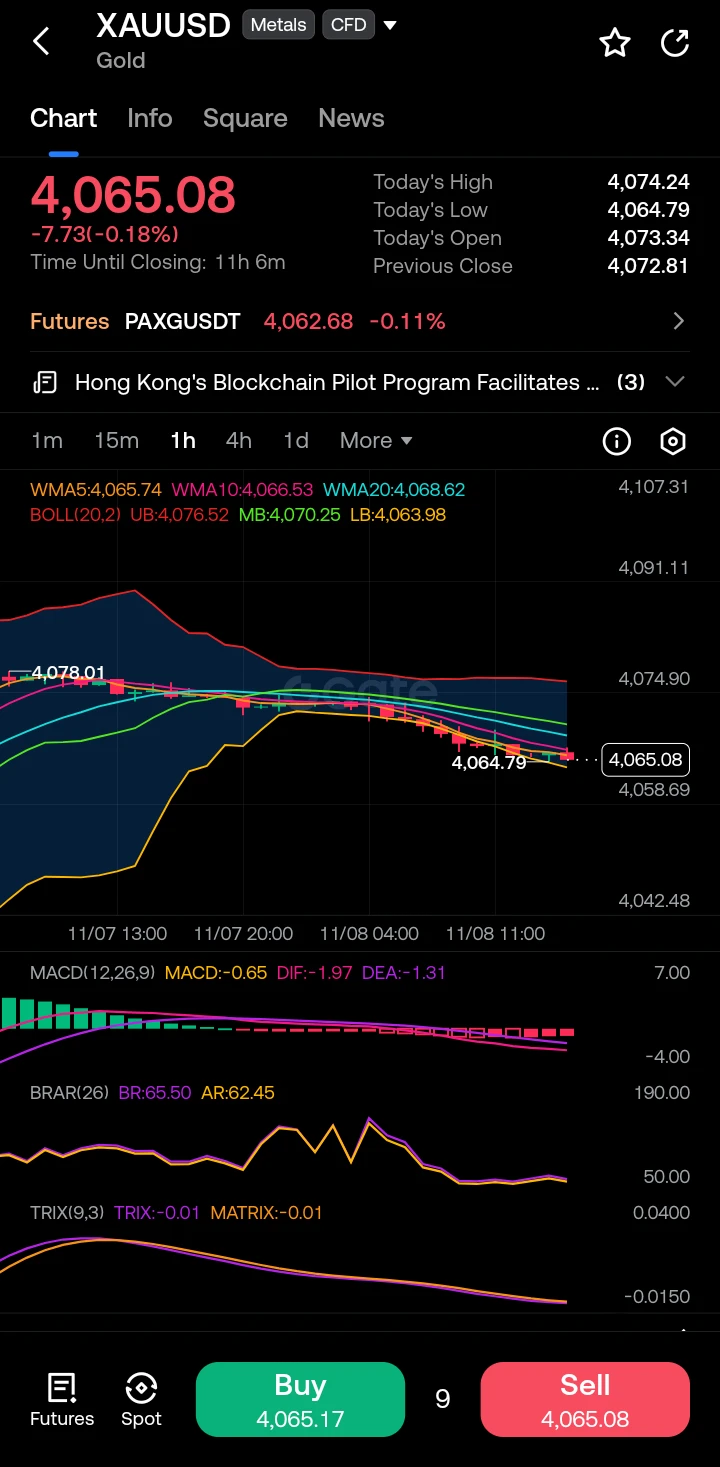
$XAUUSD ‌
Looking at the 1-hour timeframe, Gold is displaying a clear bearish structure, having broken down from the 4,078 level and establishing a series of lower highs and lower lows. The price is currently pinned to the lower Bollinger Band (LB: 4,063.98) and trading below all three short-term WMA averages (WMA5: 4,065.74, WMA10: 4,066.53, WMA20: 4,068.62), which are fanning out downwards as dynamic resistance. Crucially, the MACD is fully submerged in negative territory with the histogram expanding to the downside (DIF -1.97, DEA -1.31), confirming strong bearish momentum. The TRIX oscill
post-image
XAUUSD-0.45%
The booths at the African countries’ exhibits are indeed a bit more rudimentary.
Market update
live-cover
LIVE2,299
$SKYAI #SKYAI
Broken Falling Wedge.
Expecting a solid rise during coming days✍️
SKYAI-7.58%
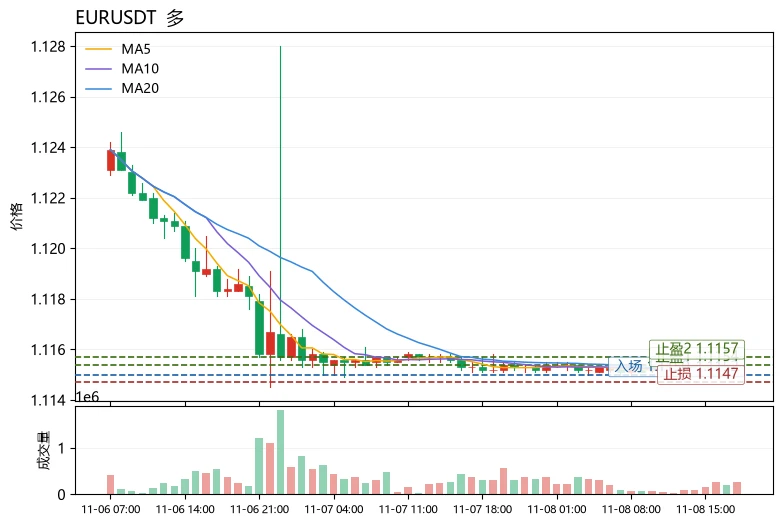
$EUR Current price 1.1152, with resistance at the upper Bollinger Band at 1.11541 and support at the lower Bollinger Band at 1.11506. The 30-candle range is only about 0.07%, compressing price into an extremely narrow band, while funds are clearly sitting on the sidelines ahead of a directional move. In terms of moving averages, MA5=1.11522 is slightly below MA20=1.11523, with the two nearly converged. RSI is just 39, in the relatively weak zone, indicating insufficient bullish momentum; however, the MACD histogram has turned positive (+8.897e-05), while bearish momentum is also fading, leavin
post-image
eur
eureur
Gate.Fun
MC:$5.55KHolders:3
0.06%
ZEC+1.16%
$SOL The liquidation map for the past 7 days shows:
If SOL rises to $91.7, cumulative short liquidation intensity across major exchanges is $138 million.
If SOL rises to $94.2, cumulative short liquidation intensity across major exchanges is $295 million.
If SOL falls to $87.9, cumulative long liquidation intensity across major exchanges is $97.22 million.

Trading strategy:
Place a long order at $87.9, with a take-profit range of $91.7–$300. $SOL ‌
SOL-0.74%
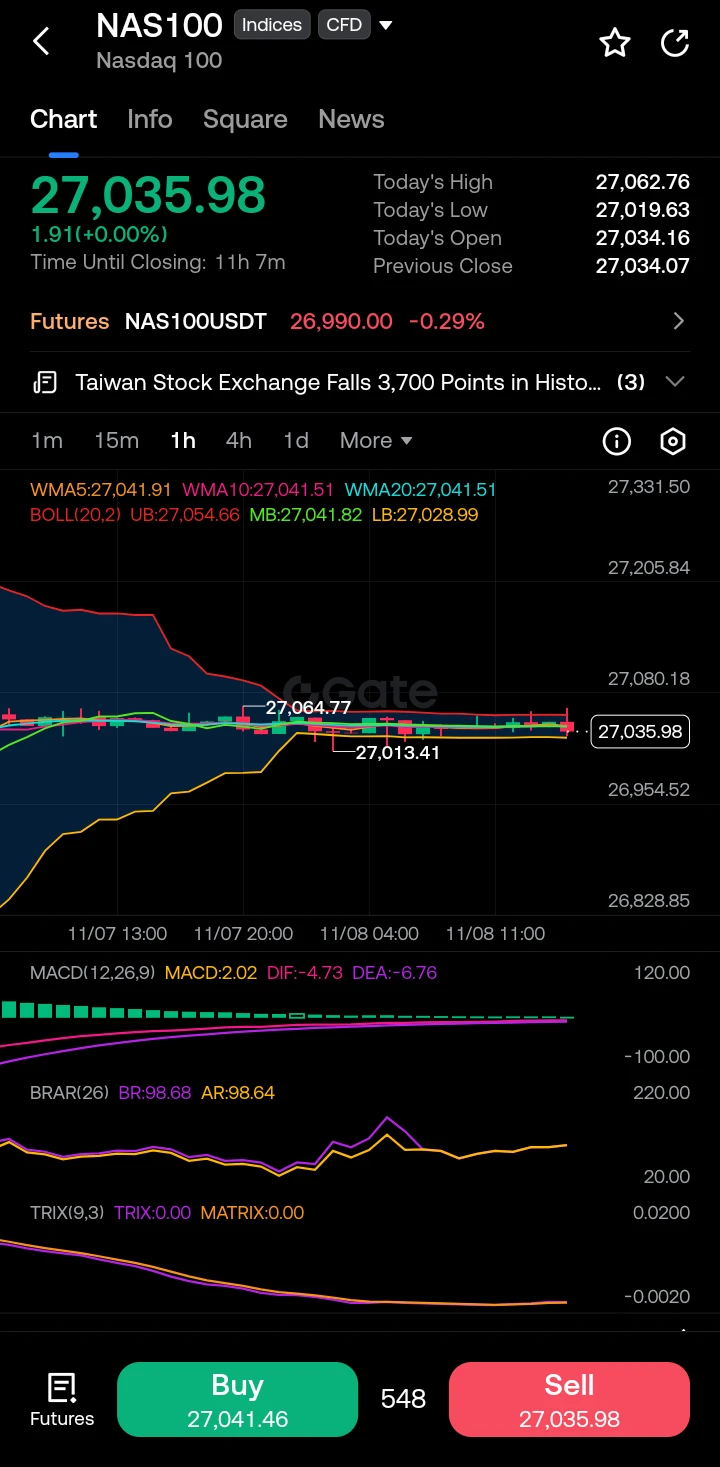
$NAS100 ‌
Looking at the 1-hour timeframe, the index is currently in a phase of extreme consolidation following a prior downtrend. The price has flattened out significantly, hugging the middle Bollinger Band (MB: 27,041.82) and the short-term WMA averages (WMA5/10/20 all clustered around 27,041). The candles have very small real bodies with wicks on both sides, indicating a battle between buyers and sellers with neither side gaining control. Crucially, the MACD lines (DIF -4.73, DEA -6.76) are deep in negative territory but are beginning to converge, suggesting bearish momentum is waning, whi
post-image
NAS100+1.90%
  • 2
Top Crypto Rewards: Invite Friends to Trade Futures and Win a Share of $50,000 in BTC and ETH https://www.gate.com/campaigns/6917?ch=9500&ref=VLARBF1YAG&ref_type=132&utm_cmp=0UCtzoY1
post-image
BTC-0.65%
ETH-1.23%
  • 1
💰 Gate Square content mining rewards distributed (10.26 – 11.1)

All content mining rewards for this period have been distributed. Users can go to Assets → Spot Account to check their credited rewards.

Post on Square with a trading pair tag or trading card. Users can click to trade and earn up to 60% in trading fee rebates. Keep creating, keep earning.

View address: https://www.gate.com/social-mining-commission
Event details: https://www.gate.com/announcements/article/102544

‍#内容挖矿 #GateSquare
post-image
  • 2
  • 1
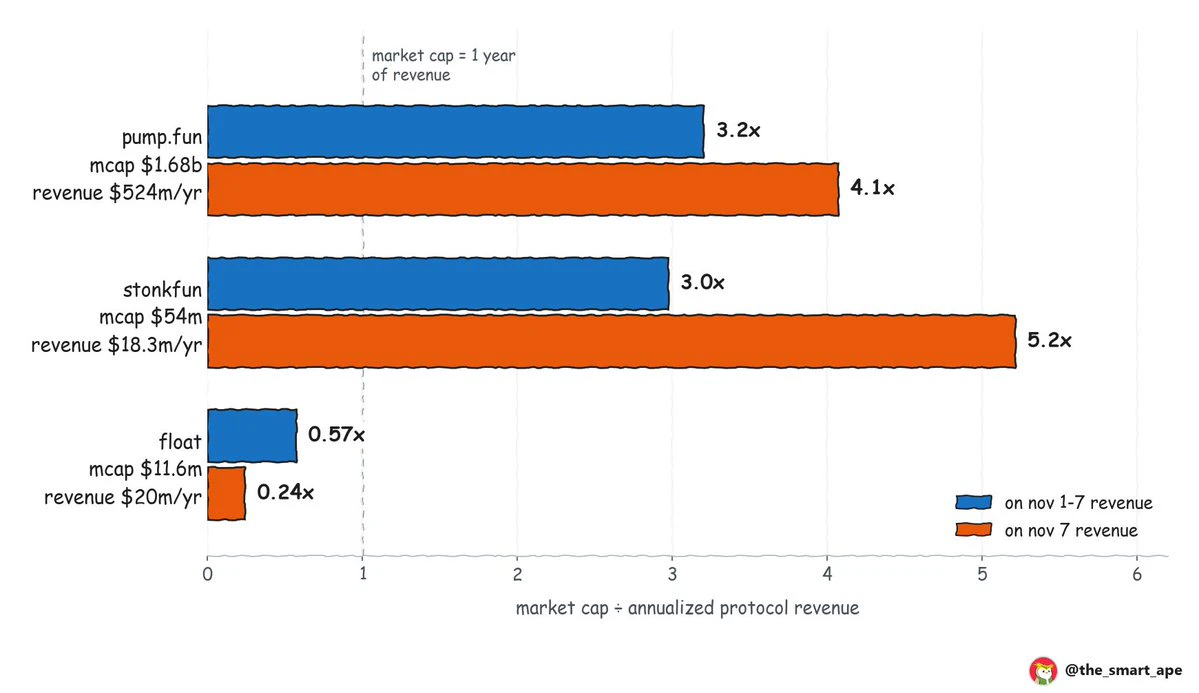
i've never seen growth this fast. @floatdotxyz launched 7 days ago and is already generating more revenue than STONK.
i took the protocol revenue of 3 launchpads for nov 1-7, annualized it, and divided each market cap by it:
> @Pumpfun: $524m/yr revenue, $1.68b mcap → 3.2x
> @LaunchOnSF: $18.3m/yr, $54m mcap → 3.0x
> @floatdotxyz: $20.2m/yr, $11.6m mcap → 0.57x
the case for float being cheap:
> it's 11 days old and already out-earned stonkfun this week ($388k vs $350k)
> 35% of its fees go to buying and burning $float. about 10% of the supply is already burned
> at this pace, the buybacks alon
post-image
STONK+11.55%
Load More

Join 40 M users in our growing community

⚡️ Join 40 M users in the crypto craze discussion

💬 Engage with your favorite top creators

👍 See what interests you

Trending Topics

USCPIDataIncoming

6.81k Views1.56k Discussing

The U.S. October CPI report will be released on November 10 at 8:30 a.m. ET. September CPI came in at 3.7% year over year, and markets will be watching closely for signs that inflation is cooling, especially in core CPI. A softer-than-expected reading could strengthen rate-cut expectations, while hotter inflation may pressure risk assets through higher Treasury yields and a stronger dollar. How do you think this CPI print will move $BTC, U.S. stocks and gold?

USAIStocksHitHard

26.34k Views3.72k Discussing

USNonfarmPayrolls

48.5k Views4.45k Discussing

View More