Square
Following
Hot
News
Notifications
Profile
Share your thoughts
placeholder
Article
only 8 months later…
i wonder if @mcuban has changed his opinion?
post-image
#70%OfAltcoinsFallBelow200DMA
Market Observation: 70% of Altcoins Now Below 200DMA

Recent data from CryptoQuant analyst Darkfost indicates a notable shift in the altcoin market structure. According to the report, approximately 70% of altcoins are currently trading below their 200-day moving average (200DMA). This is a sharp increase from early October, when the figure was around 10%.

The 200DMA is a widely used technical indicator to gauge longer-term market trends. A broad breakdown below this level often indicates a shift in market momentum toward a bearish phase or a period of prolonged
  • 1
Trenches
ZIG
Z
bade
b
ZIG
0x8c...1145
Market Cap
$.
Change
.
24h Vol
$.
Holders
.
STONK
S
bade
b
STONK
6GmA...UNgx
Market Cap
$.
Change
.
24h Vol
$.
Holders
.
BTC
B
bade
b
BTC
C5xp...pump
Market Cap
$.
Change
.
24h Vol
$.
Holders
.
MAGGIE
M
bade
b
MAGGIE
8rHo...PmZV
Market Cap
$.
Change
.
24h Vol
$.
Holders
.
CLAUDIA
C
bade
b
CLAUDIA
2j5S...W2ZM
Market Cap
$.
Change
.
24h Vol
$.
Holders
.
Just got another subscriber.
It's cook o'clock 😋🤞
post-image
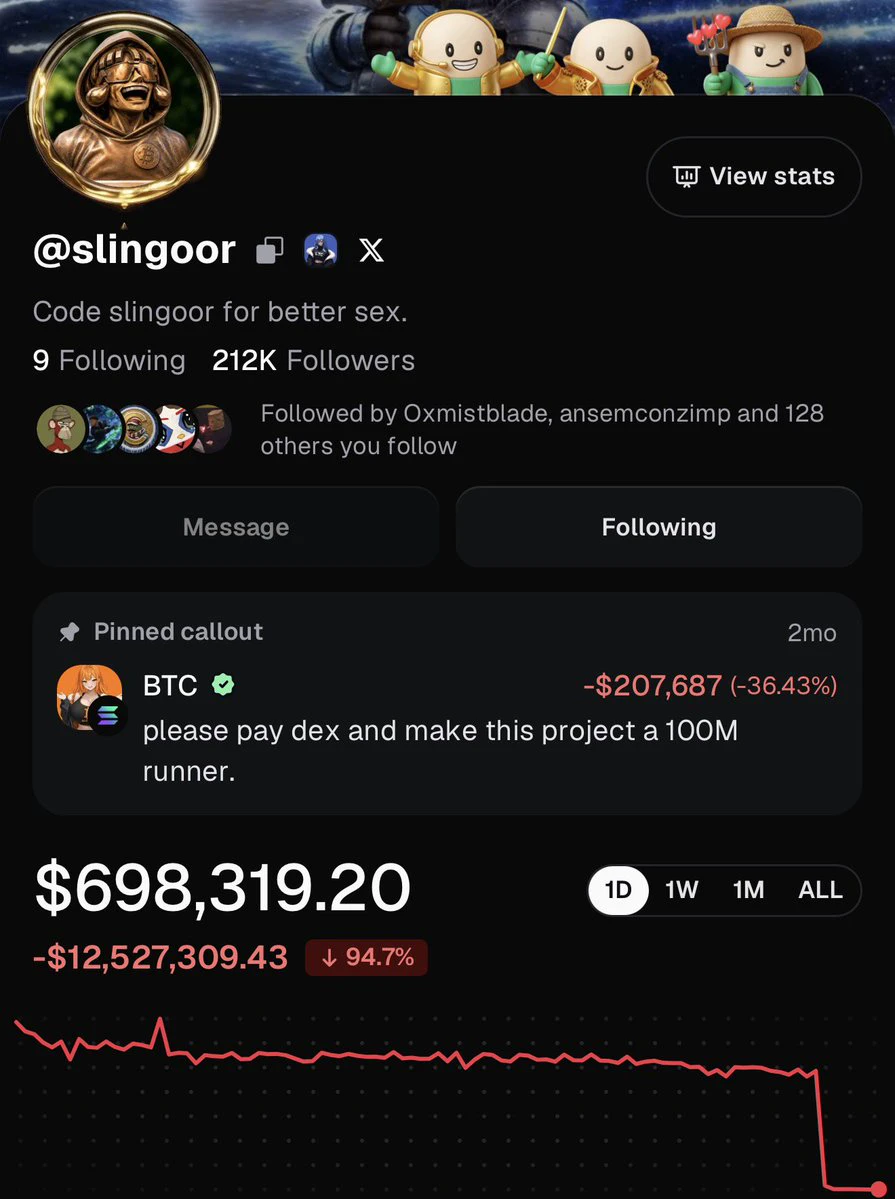
Uhh what happened to Slingoor???
post-image
$JCT It should be stable now. I want to add to my position on the way up, but I don't dare open any more long positions
JCT-3.26%
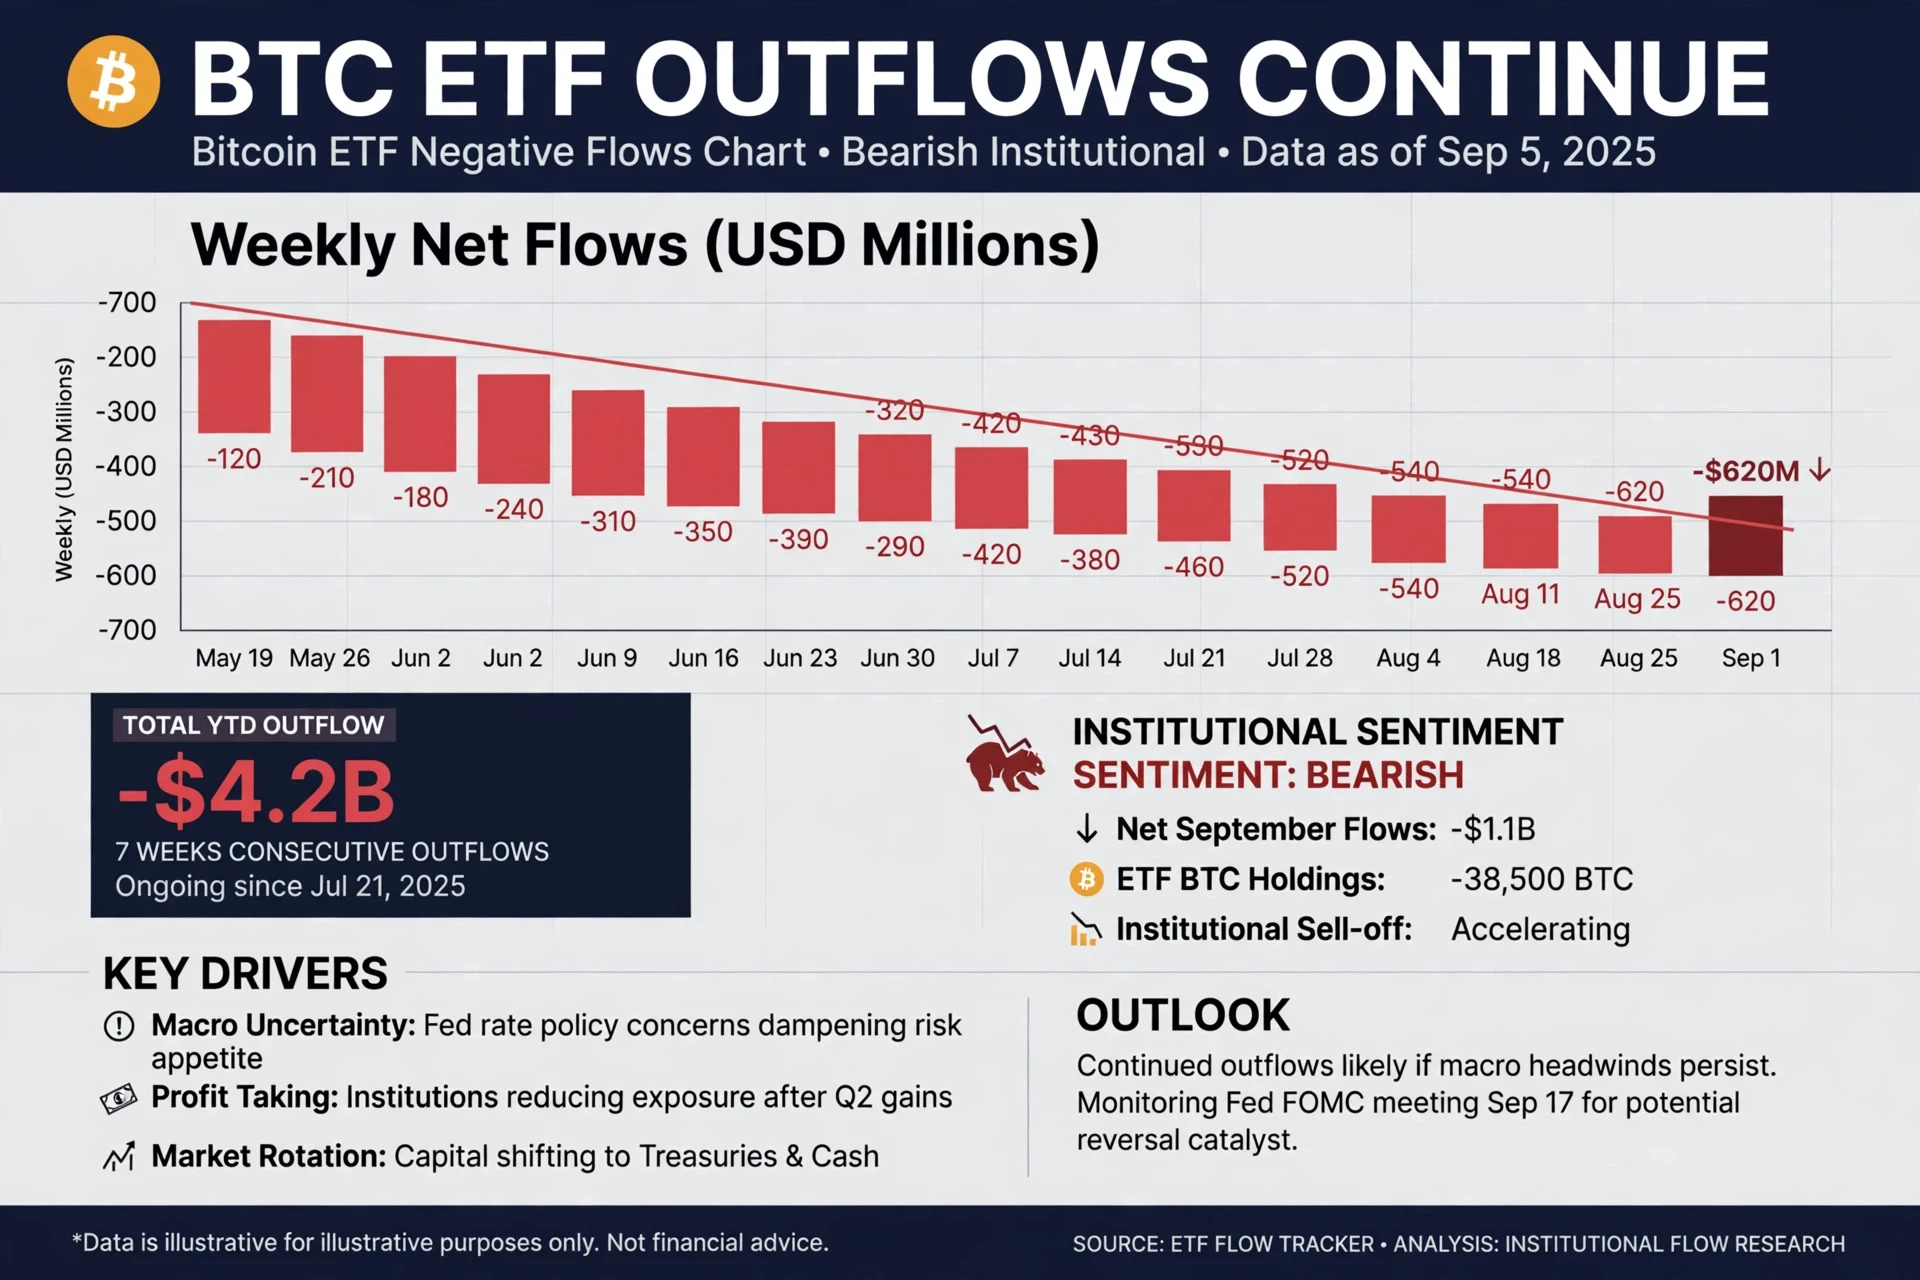
*#BTCETFOutflowsContinue — Institutional Selling Accelerates*

Bitcoin ETFs are under sustained pressure with *7 consecutive weeks of outflows*. YTD total outflow now *-$4.2B*, with latest weekly print at *-$620M* — the largest since July.

September alone saw *-$1.1B* net, with ETF BTC holdings down *-38,500 BTC*. Institutional sentiment has flipped to *Bearish*.

*Key Drivers:*
- Macro Uncertainty: Fed rate policy dampening risk appetite
- Profit Taking: Institutions trimming exposure after Q2 gains
- Market Rotation: Capital shifting to Treasuries & cash

*Outlook:* Continued outflows lik
post-image
BTC-0.31%
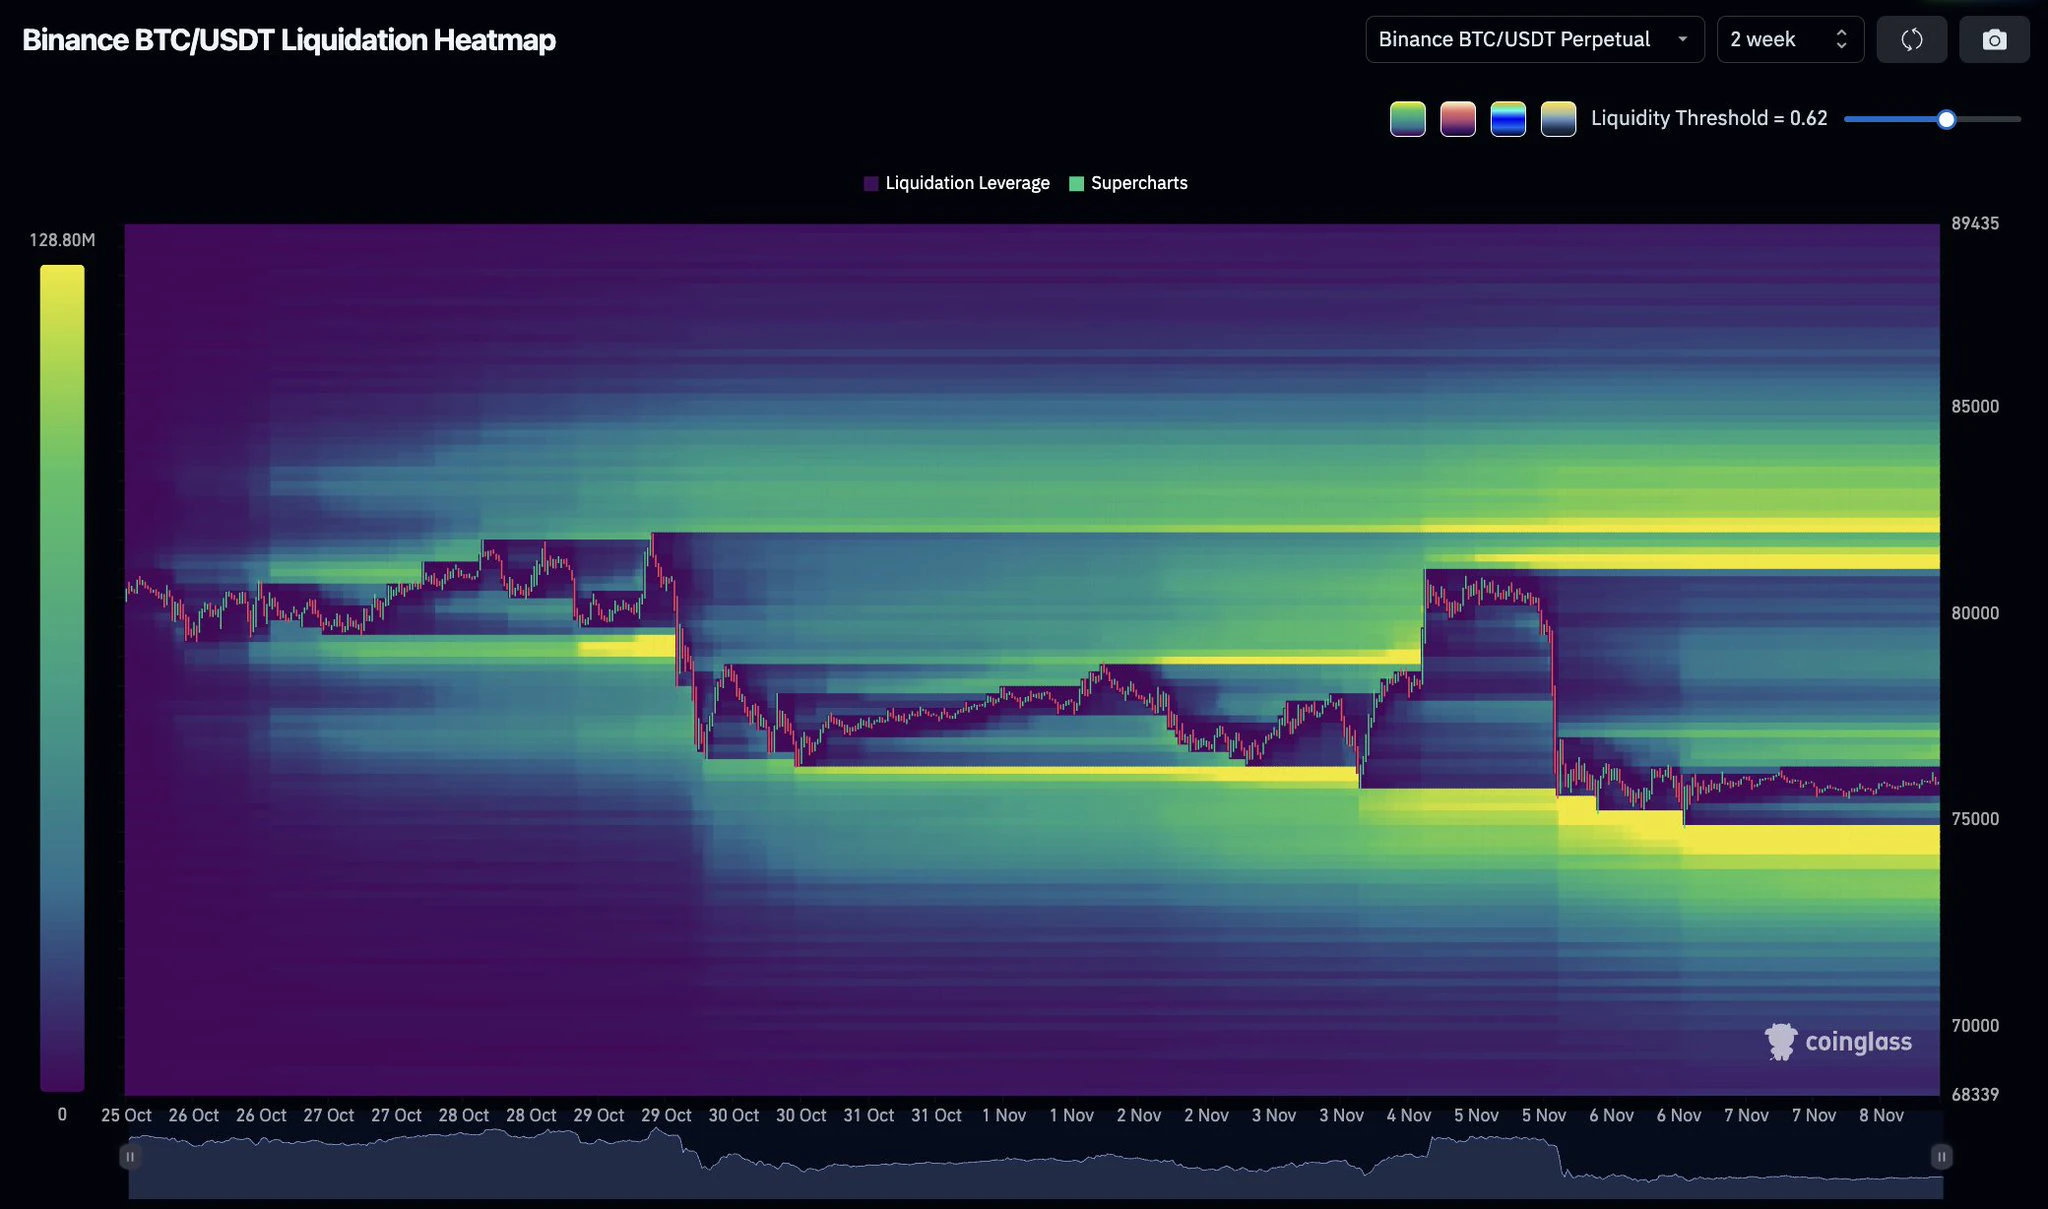
$BTC is near $76,000 with major liquidation clusters on BOTH sides.

Longs around $74,000 to $75,000.
Shorts around $81,000 to $82,000.

Which side gets swept first? 👇

#USCPIDataIncoming
#USAIStocksHitHard
post-image
BTC-0.65%
The biggest fear during mega-cap tech earnings season isn’t weak results—it’s expectations that are too high. Stocks like PLTR, AMD, and NVDA have posted mind-boggling gains over the past few years: PLTR rose about 167% in 2023 and another 340% in 2024, NVDA gained about 239% in 2023 and 171% in 2024, and AMD rose about 127% in 2023. With gains like these, current prices have long since priced in “smooth sailing for the next five years,” embedding very high growth assumptions in their valuations.

If guidance is even slightly softer than expected, or gross margins or next quarter’s revenue out
post-image
PLTR+3.57%
AMD+11.55%
NVDA+2.80%
MSFT-0.95%
AMZN-0.44%
$RSR Price is currently 0.0017, up 10.65% over 24 hours, with trading volume surging to 32M—amid the recent low-volume sideways action among small-cap coins, that kind of volume suggests someone got positioned early.
Let’s pin down the timing: we’re in a high-level consolidation after an intraday rally, less than 6% below the 24-hour high of 0.0018. This is the most nerve-racking spot: chase it and you risk getting stuck at the top; sit it out and you risk missing the move. From my screen-watching experience, after a 10% gain, if volume hasn’t dried up and price is holding near the previous hi
RSR-1.93%
I heard that a KOL was drugged in Thailand and passed out on the street!
Is this true? 🤔
Can anyone recognize which KOL it is? 😍
Bitcoin ETFs saw a net outflow of $412 million, with BlackRock’s IBIT posting a net outflow of $403
live-cover
LIVE39
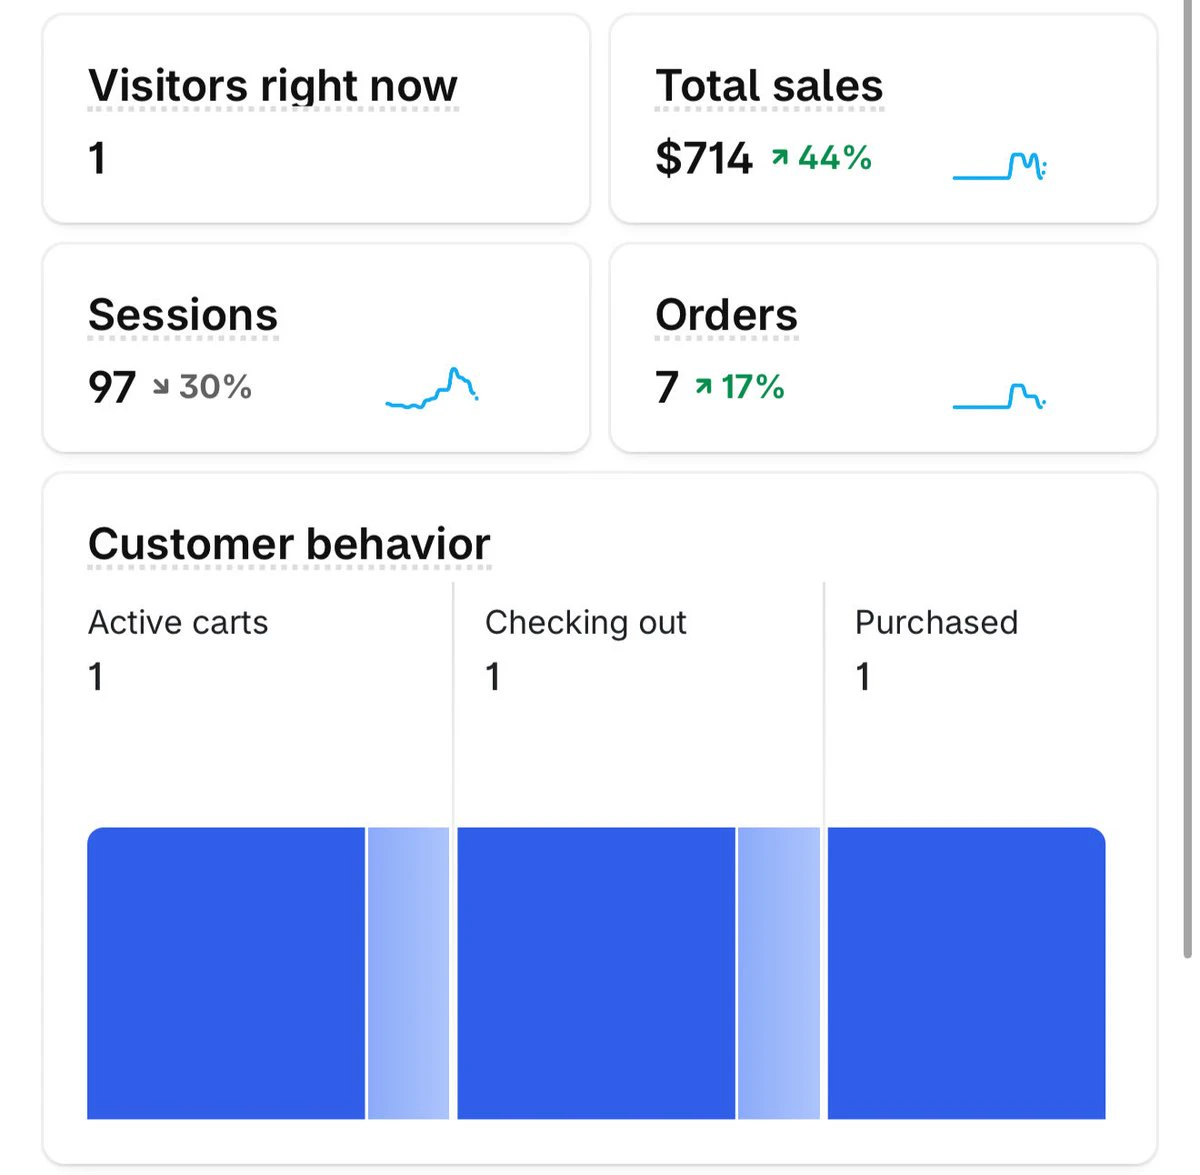
$700 days aren’t bad I guess
post-image
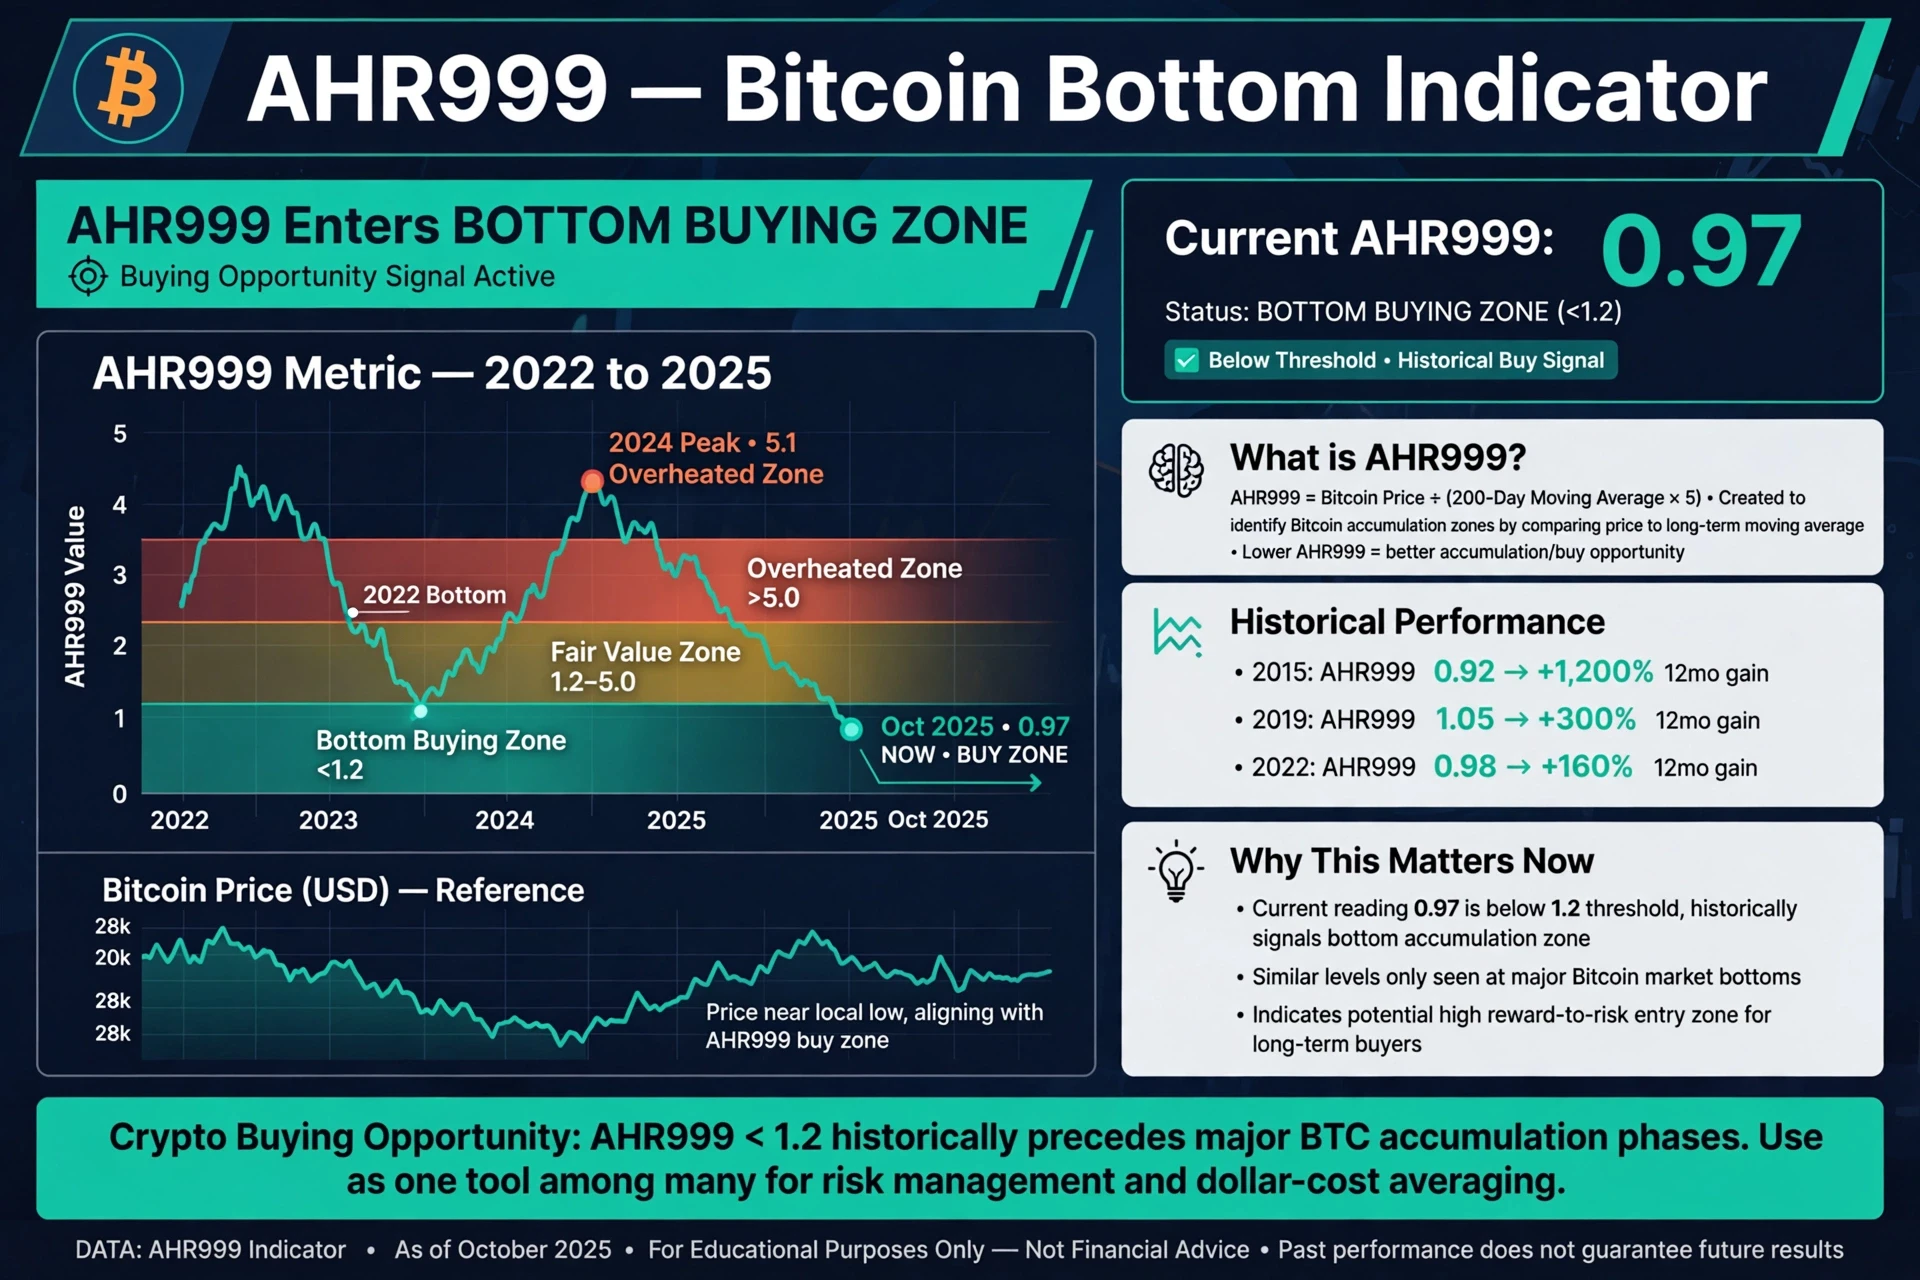
#Ahr999EntersBottomBuyingZone Historic Bitcoin Accumulation Signal*

Bitcoin's AHR999 indicator has entered the *Bottom Buying Zone (<1.2)* — a level historically linked to major accumulation opportunities.

Current reading: *0.97*, below the 1.2 threshold that signals undervaluation. The AHR999 compares BTC price to its long-term moving average to identify buy zones.

Historical context is compelling: In 2015, AHR999 at 0.92 preceded +1,200% 12-month gains. In 2019, 1.05 led to +300%. In 2022, 0.98 led to +160%.

Why it matters now: Readings below 1.2 have only occurred at major market botto
post-image
BTC-0.67%
🚀 BTC LIVE: Bull Run or Big Crash? Where Is Bitcoin Heading Next?
live-cover
LIVE734
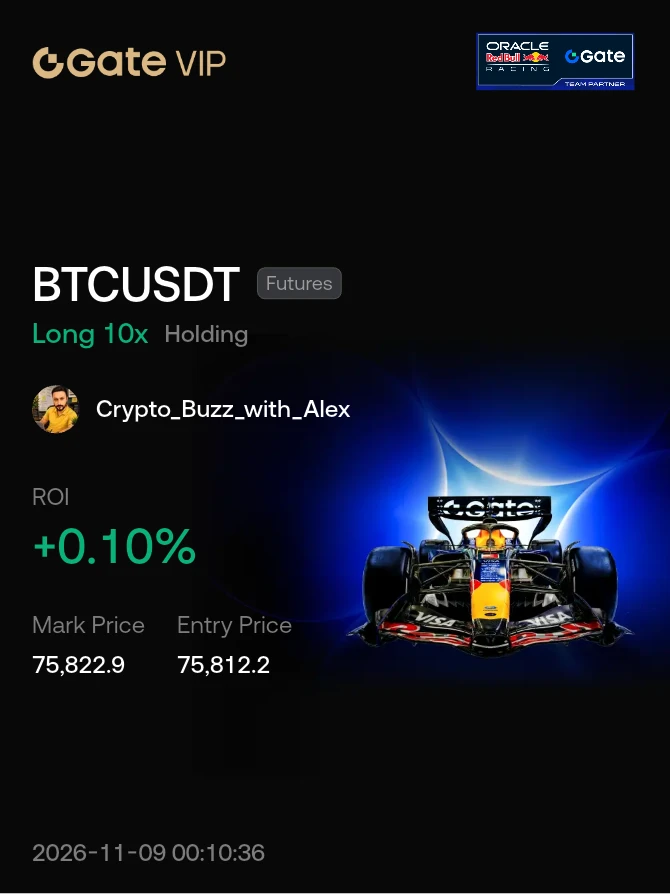
#Share My Holding Returns
another way up to the moon 🌝 if the market is going to respect the structure so we are good and catch the exact point and let's eep pushing it towards upside first to take the liquidity instead of downside. ♥️🎇🎆
#StockTalkSeason
post-image
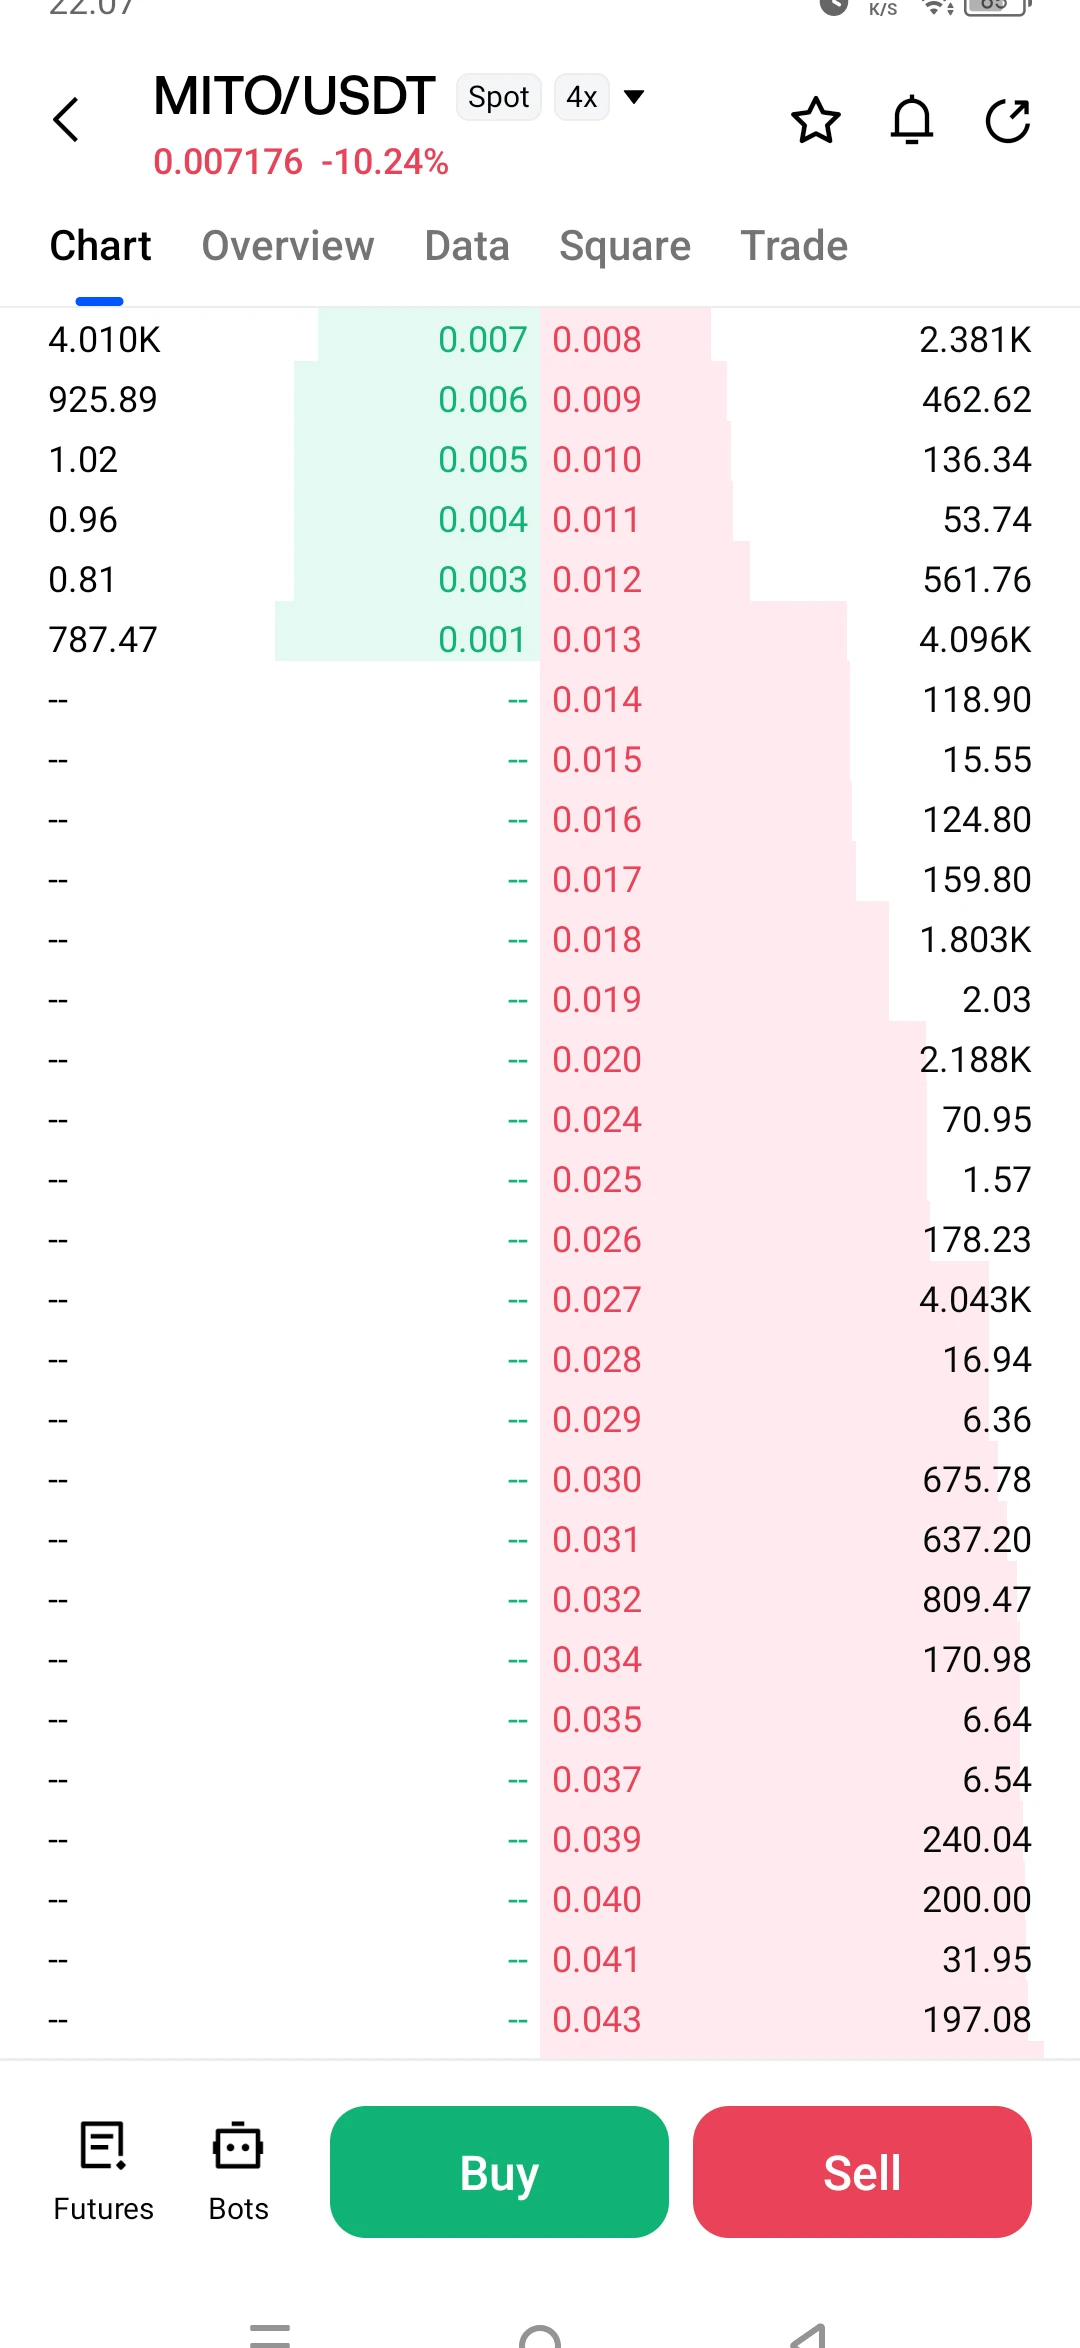
$MITO This order book is completely empty. There are no buy orders; this exchange only has 12M Mito anyway. It’s only worth $70K . But the exchange isn’t publishing posts about this project. I wonder why $BTC
post-image
MITO+8.51%
BTC-0.67%
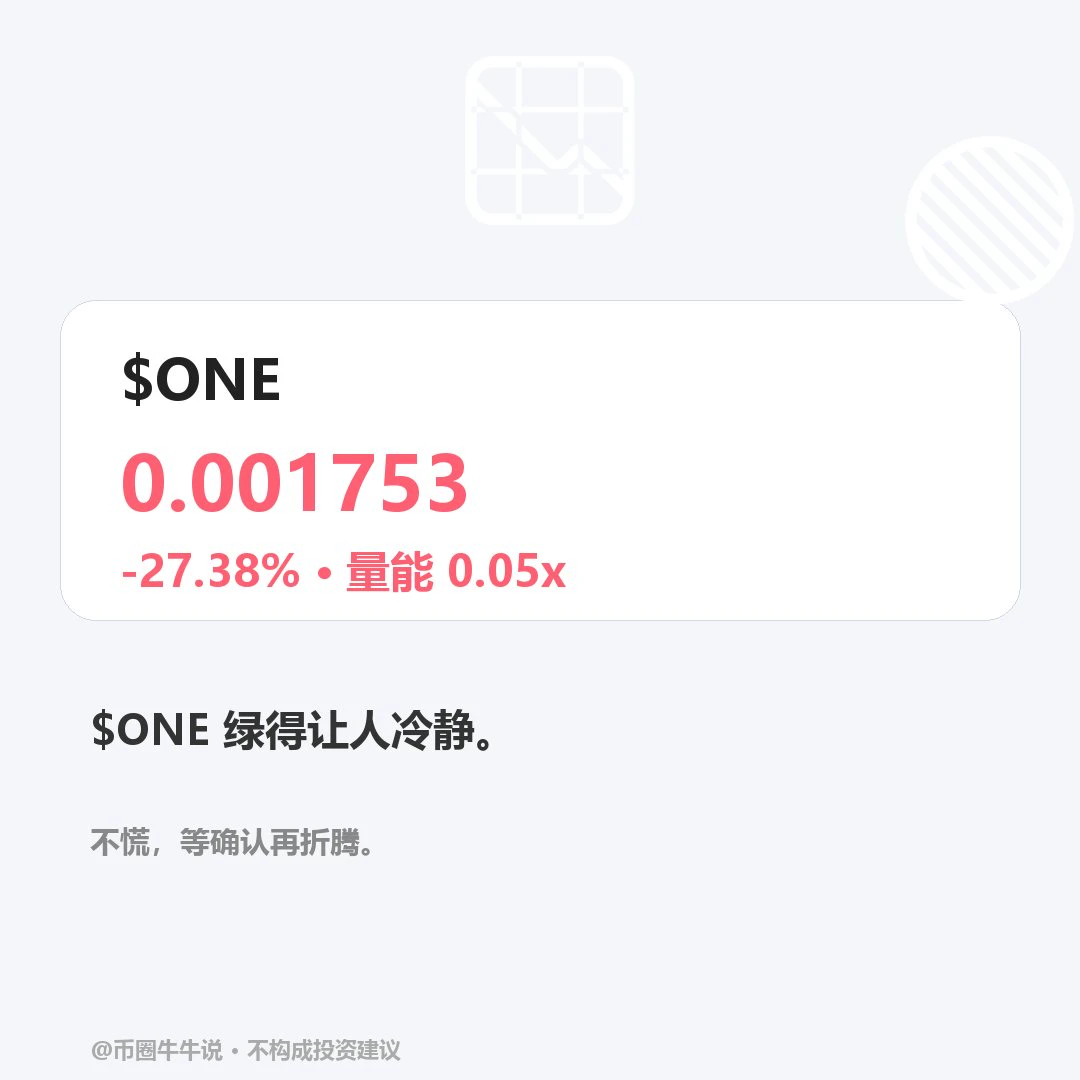
$ONE Current price: 0.001753, 24H -27.38% (0.001692–0.00243). 1H is weak: RSI 35.79/EMA20 0.001896, support at 0.001692/resistance at 0.00243; 4H is strong: RSI 54.93/EMA20 0.001732, support at 0.001027/resistance at 0.002476. The upside condition is holding above the 0.00243 resistance; the downside condition is breaking below the 0.001692 support. Review whether price can hold above 0.00243 and recover after losing 0.001692; the volume ratio is 0.051x, and the setup is invalid without confirmation of participation. Market volatility is high; for observation only.
post-image
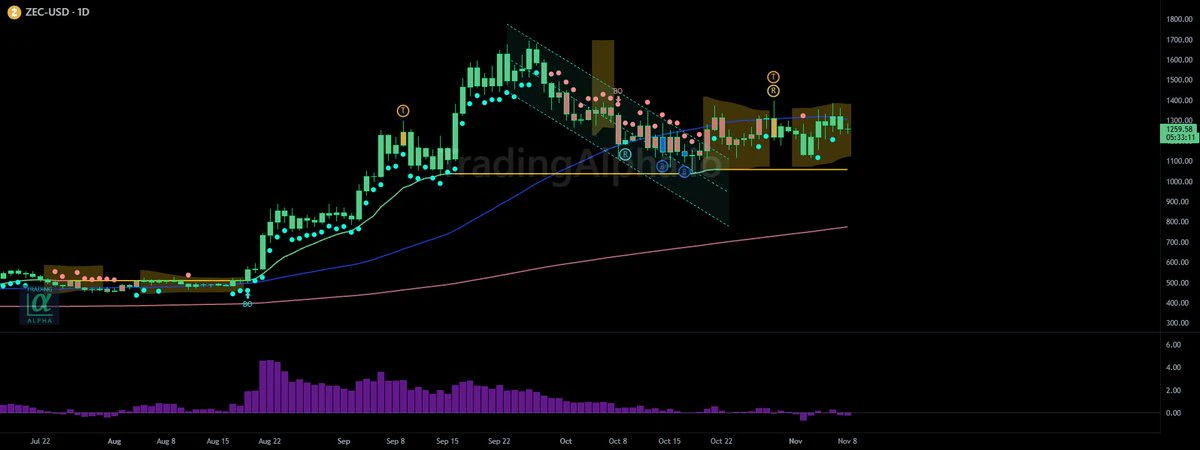
$ZEC moving sideways still, but holding all of that pressure, as well, too. Weekly looks great still, as well.
post-image
ZEC+1.16%
Continue shorting BTC and ETH: ETH at 2,150, BTC at 73,800. #美股AI板块遭遇重挫
post-image
BTC-0.65%
ETH-1.23%
Load More

Join 40 M users in our growing community

⚡️ Join 40 M users in the crypto craze discussion

💬 Engage with your favorite top creators

👍 See what interests you

Trending Topics

USCPIDataIncoming

14.34k Views1.66k Discussing

The U.S. October CPI report will be released on November 10 at 8:30 a.m. ET. September CPI came in at 3.7% year over year, and markets will be watching closely for signs that inflation is cooling, especially in core CPI. A softer-than-expected reading could strengthen rate-cut expectations, while hotter inflation may pressure risk assets through higher Treasury yields and a stronger dollar. How do you think this CPI print will move $BTC, U.S. stocks and gold?

USAIStocksHitHard

28.78k Views3.74k Discussing

USNonfarmPayrolls

55.32k Views4.5k Discussing

View More