



Square
Following
Hot
News
Profile
Share your thoughts
placeholder
Article
Still holding steady at 0.01
post-image
  • 3
A couple stock trades I mentioned are performing great so far.
Who's riding with me?
Trenches
ZIG
Z
bade
b
ZIG
0x8c...1145
Market Cap
$.
Change
.
24h Vol
$.
Holders
.
BTC
B
bade
b
BTC
C5xp...pump
Market Cap
$.
Change
.
24h Vol
$.
Holders
.
HIGH
H
bade
b
HIGH
7ymF...high
Market Cap
$.
Change
.
24h Vol
$.
Holders
.
STONK
S
bade
b
STONK
6GmA...UNgx
Market Cap
$.
Change
.
24h Vol
$.
Holders
.
LEEROY
L
bade
b
LEEROY
98HE...pump
Market Cap
$.
Change
.
24h Vol
$.
Holders
.
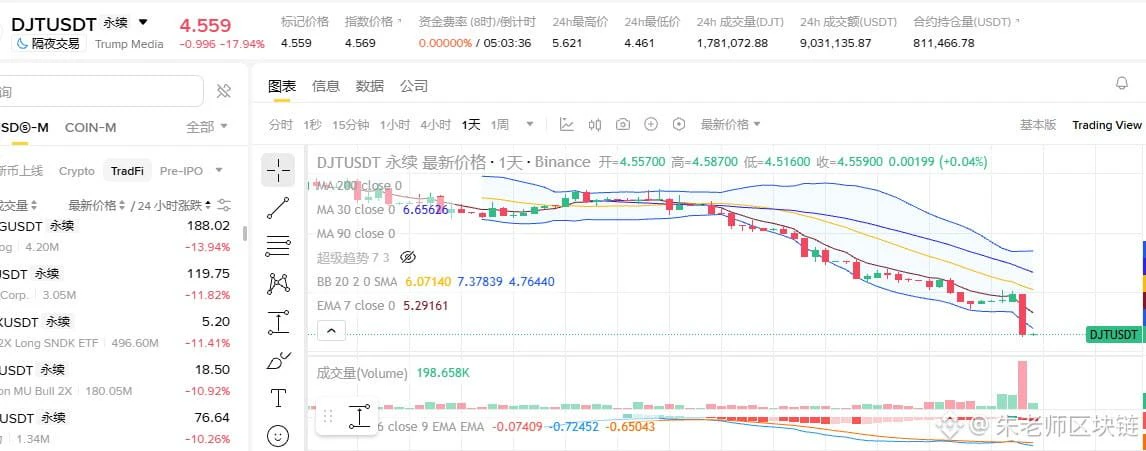
Everything Trump-related, from stocks to crypto, is getting absolutely crushed! 😂
post-image
TRUMP-0.95%
  • 8
  • 2
The gold outlook shared earlier hit all its target levels! The market always moves as anticipated, so just follow the plan. ​​​$XAU
XAU+0.38%
$UNITREE Damn, here we go again. Pumping the price is one thing, but now the funding rate is sky-high too. Going long is nerve-racking—you’re afraid it could crash at any moment. Go short and negative funding will bleed you dry. No solution. $UNITREE
post-image
UNITREE+4.35%
11.5 Market Analysis
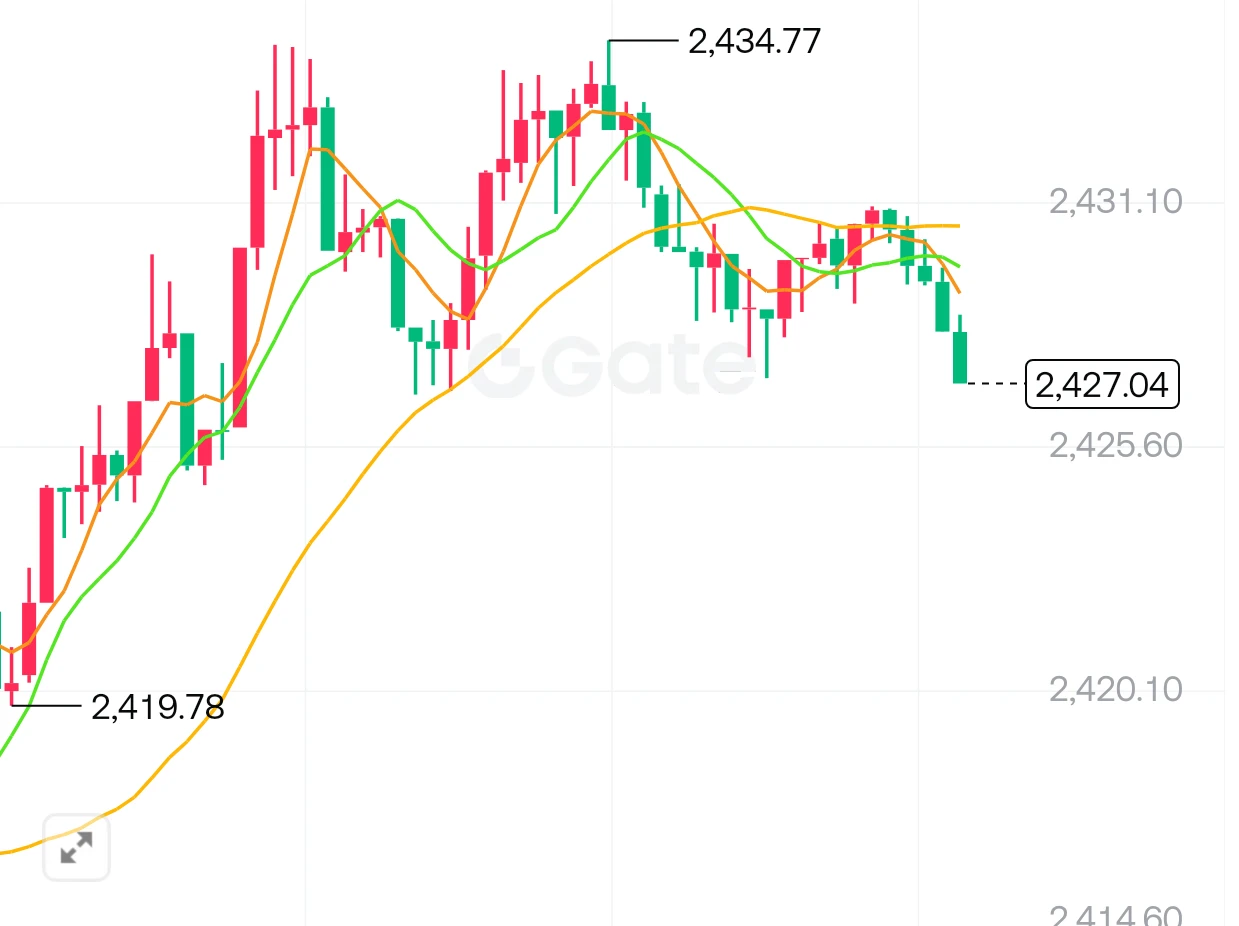
ETH Trading Strategy Reference Setup
Long entry zone: around 2400--2420
Stop loss: 2370
First target: 2450, second target: 2490
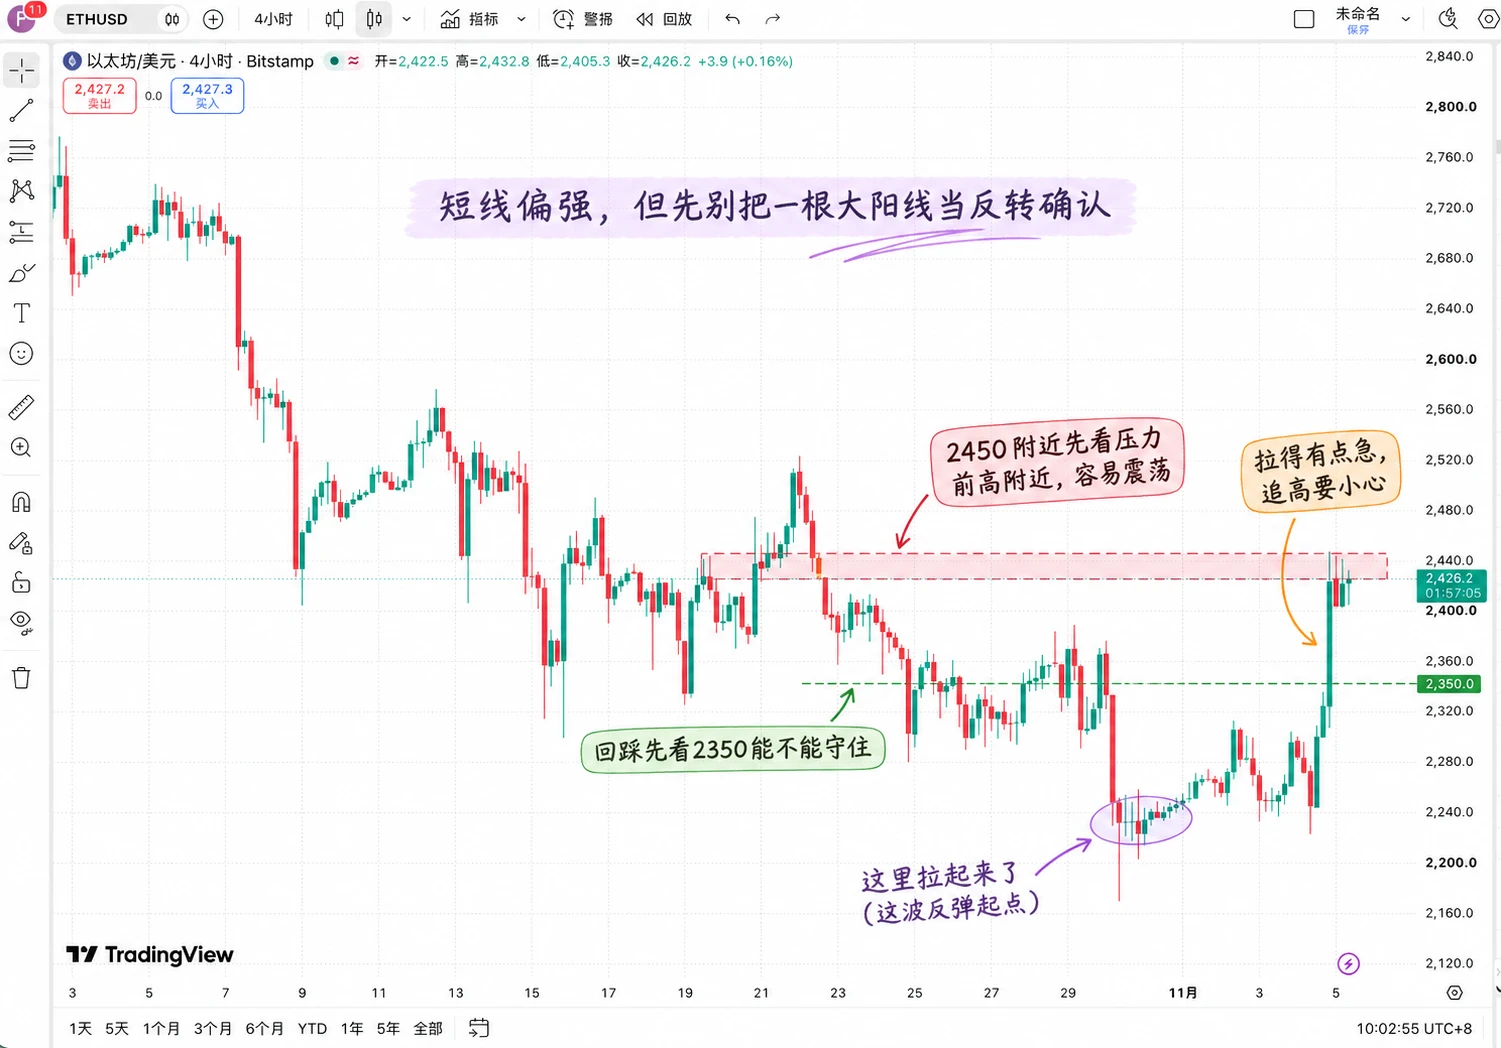
ETH has made a strong rally from 2172.85, with the candlesticks holding above the upper Bollinger Band and the MACD red bars continuing to expand, indicating a typical strong bullish trend. BTC has also rallied sharply in tandem, and bullish sentiment is strong. The current price is around 2432, in the pullback confirmation phase after the breakout. Positions can be opened if the pullback holds above the 2420 support; a slight pullback to around 2
post-image
BTC-0.65%
ETH-1.23%
#BTC重返8万 #每周来晒 #广场交易达人 #WCTCS9 BTC Market Analysis
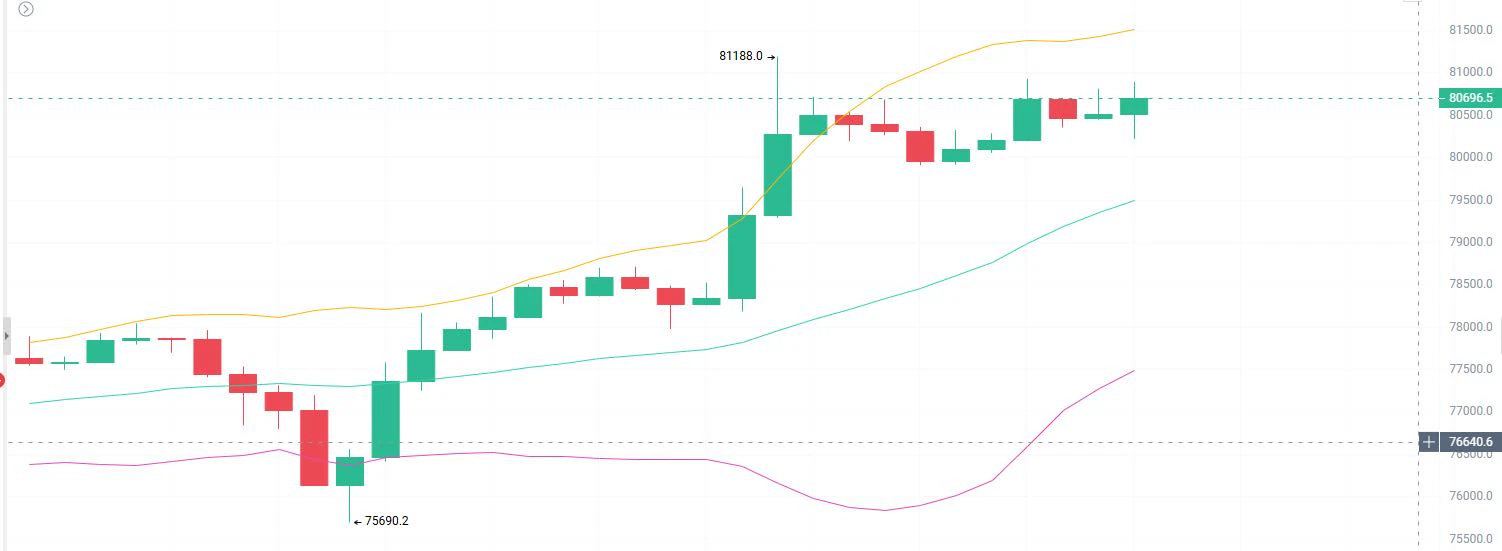
BTC is currently around $80,650, up 4.9% in 24 hours, and has indeed reclaimed the $80,000 level. But this rebound has mainly been driven by short liquidations, while spot inflows have yet to catch up, so near-term price action is more likely to be choppy.
Here are the main things to watch
ETF flows: There have been cumulative net outflows of about $1.157 billion over the past three trading days, so this source of buying has yet to return.
U.S. stocks and macro factors: Falling Treasury yields and a rebound in U.S. stocks have supported this r
ThisIsTranslateContent:
#BTC重返8万 #广场交易达人 #WCTCS9 BTC Price Analysis
BTC is currently around $80,650, up 4.9% in 24 hours, and has indeed climbed back above $80,000[1]. But this rebound is mainly driven by forced short covering, while spot market inflows have yet to catch up, so near-term trading is more likely to be choppy.
Key factors to watch
ETF flows: Net outflows totaled around $1.157 billion over the past three trading days, so this source of buying has yet to kick in.
U.S. stocks and macro: Falling Treasury yields and a rebound in U.S. stocks have supported this recovery; U.S. employment data on November 6 will affect rate expectations.
· Leveraged positions: When the price quickly rebounded from $75,700, concentrated short liquidations amplified the gains. This type of buying often lasts only until the positions are closed.
Several key price levels
$81,000–$82,000: Near-term resistance; a move up to this level could easily be followed by a pullback.
$80,000: The key support level now. A daily close below it could lead to another test of around $77,600.
$85,000–$87,500: The area with the heaviest concentration of underwater holders and sell orders, making a near-term breakout difficult.
Two possible scenarios
If BTC holds above $80,000, ETFs see consecutive inflows, and trading volume expands: upside opens up, with $90,000 as the next target.
If BTC falls back below $80,000: Previous downward pressure will return, and the price could retest $77,600.
For now, trading within a range looks more suitable. Wait for ETF inflows to return and for the daily close to hold above $80,000 before deciding whether a new uptrend has begun.
Whether this rebound can last mainly depends on whether new money enters the market. A price rise accompanied by inflows into ETFs and stablecoins would indicate a more sustainable move.
On-chain data: See who holds the coins
Exchange balances: A decline means coins are being withdrawn and held, easing selling pressure; a rise suggests people are preparing to sell.
SOPR: Above 1 means most sellers are making a profit; below 1 means people are selling at a loss.
Long-term holder activity: Little movement in older coins suggests large holders are not selling.
Realized market cap: If it rises along with the price, that suggests new money is entering; if only the price rises, existing funds are probably just changing hands.
Market indicators: See whether money is flowing in
ETF net flows: Consecutive days of net inflows would show institutional buying has returned.
Total stablecoin market cap: A rise means money on the sidelines is still waiting to enter.
Trading volume: A rally on rising volume is much more solid than one on declining volume.
Funding rates: A return to neutral means leveraged chasing has cooled, making the market healthier.
Watch for these signals
Bullish: Consecutive ETF inflows, growth in the total stablecoin supply, and closes holding above $80,000.
Bearish: A fall below $80,000, a return to net ETF outflows, and a marked increase in exchange balances.
ETF outflows have yet to show a consistent slowdown, and the total stablecoin supply has not reached a new high, so this looks more like a short-term rebound; a trend reversal still needs confirmation from fund flows.$BTC

repost-content-media
BTC-0.67%
  • 3
11.5 Bitcoin Analysis
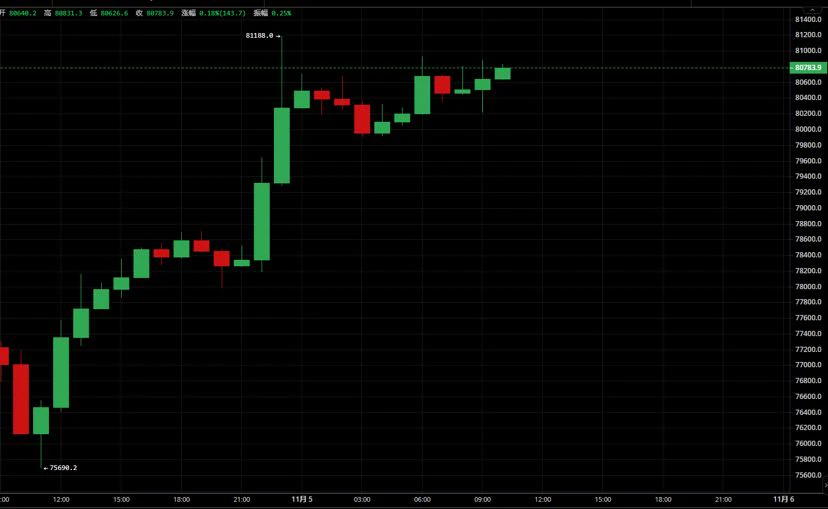
Analysis: Go long on a pullback to around 80000-80300, with a stop-loss at 79500. First target: 81200; second target: 81800.
The 1H chart shows a strong rebound from the low of 75690.2, with a series of sharp gains taking the price to an interim high of 81188. The current price is 80800.1. Short-term moving averages are aligned bullishly and trending upward, providing support, while the price has remained above them. Bullish momentum has been fully unleashed, and the uptrend structure remains intact. Buying support in the pullback zone is strong, keeping the overall outlo
post-image
BTC-0.67%
#GateSquareStockTalk
📈 YOUR MARKET VIEW COULD EARN REWARDS: GATE SQUARE STOCK TALK SEASON
💡 A SIMPLE IDEA
Imagine you are following a stock, watching its price move, and discussing whether it could rise or fall. You already have an opinion, but what if you could share that market view and compete for rewards?
That is the idea behind Gate Square Stock Talk Season, a new campaign inviting users to share their stock market opinions and compete for GT and stock rewards.
📊 WHAT IS STOCK TALK?
Stock Talk Season gives users an opportunity to express their views on the stock market. Instead of kee
post-image
GT-2.41%
11.5 BTC Today's Setup
$BTC
After a strong overnight rally, the price reached a high of 81188 before entering a high-level consolidation. The overall bullish trend remains strong, so focus on buying dips. #BTC重返8万
Support: 80000
Resistance: 81200-81500
Long: Enter near 80000 if the price stabilizes on a pullback; stop-loss at 79600, first target 81200, second target 81800
Short-term short: If the rebound stalls in the 81200-81500 range, consider a small short position. Get in and out quickly; first target 80500, second target 80000
post-image
BTC-0.67%
$BTC That four-hour bullish candle looks intimidating at first glance, but a closer look reveals that big money has no intention of sticking around. The past 30 days tell the story: net outflows of 10.1 billion from the derivatives market, with another 1.777 billion pulled from spot. The current excitement is just short-term money hyping itself up, while real big capital packed up and left long ago. This rally is essentially paving the way for a sell-off; anyone chasing it now is voluntarily putting themselves under the market makers’ feet as a stepping stone.
#BTC$BTC
Risk warning: The above
post-image
BTC-0.67%
Regulatory black swan triggers a bloodbath! Are $SKHYNIX ’s big players slaughtering longs or burying shorts?
Don’t rush to buy the dip in a hole created by bearish news; wait for the bleeding to stop before entering.
My personal view: follow the short-term trend and go short; in the mid-term, wait for signs of stabilization before flipping long.
The evidence is compelling: South Korea’s KOSPI plunged more than 5% amid regulatory panic over AI data centers, SK Hynix slumped nearly 8%, and foreign investors net sold more than 1.3 trillion won in a single day—these are concrete bearish catalysts
SKHYNIX+1.41%
  • 10
Thrusday Trades with Crypto Sat
live-cover
LIVE999
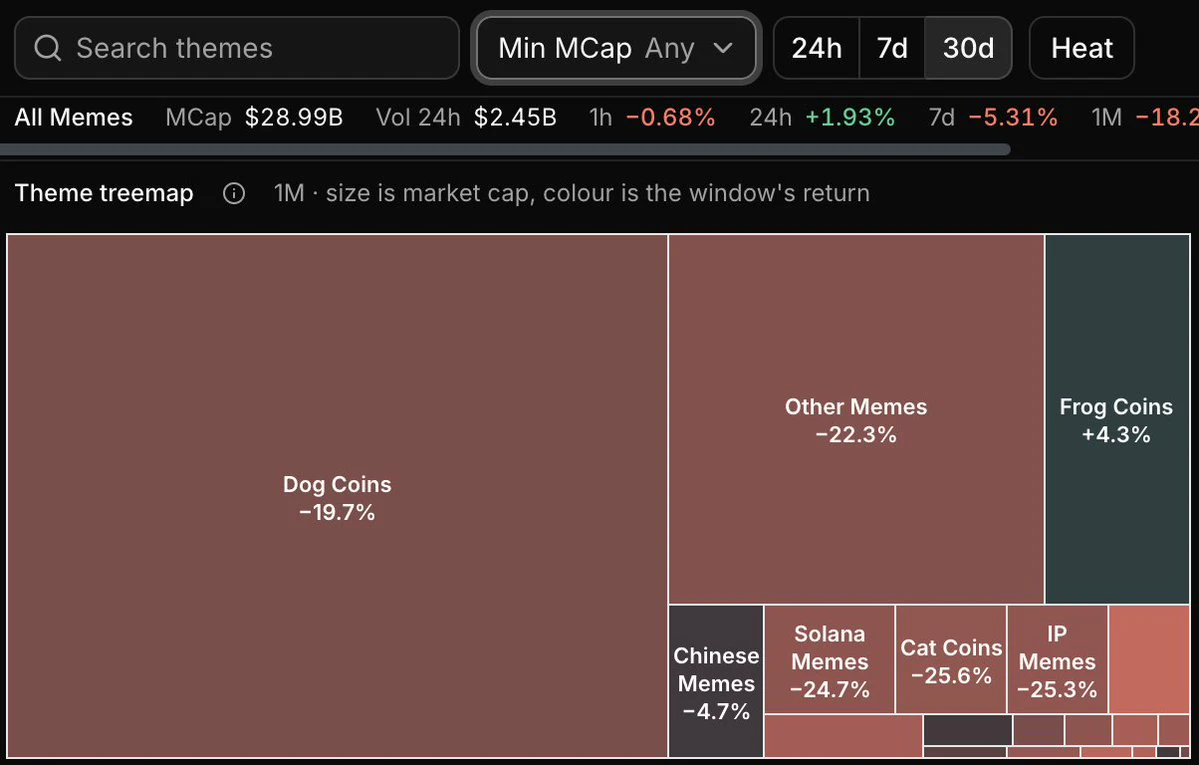
Over the past 30 days, in the Meme market, all sectors broadly saw significant pullbacks except the Frog Coins sector led by $PEPE , which edged higher.
The overall Meme market cap is currently around $28–29 billion, down about 81% from its December 2024 peak of around $150.6 billion.
Personally, I think Meme will persist as an asset class over the long term, but its form will change. The old mass-production model no longer works; the quality bar will rise. The projects that survive in the future will mostly have strong communities, powerful cultural symbols, or some real-world use cases layer
post-image
MEME-0.94%
PEPE+0.97%
I once knew someone who traded gold. He started with $5,000 and grew it to over $60k in less than three months. The most outrageous part was that in the end, he couldn't even protect his principal.
At first, he was pretty steady. He'd make $300 to $500 a day and then stop, and he knew to cut his losses when trades went against him. Later, after catching several big market moves in a row, he started getting carried away. He used to be happy for a whole day after making $500; later, even making $2,000 in a day felt like too little.
I urged him, “You've made so much already—take some money out fi
post-image
XAUT+0.30%
Yesterday, BTC staged an epic short squeeze, gaining 5698 points in a single day. We accurately predicted the move and executed a “short first, then long” strategy, perfectly capturing over 3500 points of intraday movement.
BTC’s 4-hour chart has clearly flashed a high-level warning today. Yesterday’s sharp rally has left the market extremely overbought, and the current candle has a long upper wick, with extremely heavy resistance near 81200. Combined with signs of major players distributing at elevated levels, the price needs to revert after moving off trend, making a short-term technical pul
post-image
BTC-0.67%
ETH-1.26%
MORNING MARKET UPDATE
live-cover
LIVE221
November 5 Morning Analysis
Morning Market Analysis: BTC/ETH Stage Strong V-Shaped Reversals, Bullish Rebound Momentum Unleashed
Yesterday’s market saw an oversold reversal, with BTC and ETH surging sharply from their lows in tandem. Panic-driven short positions were quickly absorbed, and bullish sentiment rebounded across the board, shifting the short-term structure from weak to strong.
BTC bottomed after dipping to 75690, then began a one-way rebound. It posted consecutive gains on the 1-hour chart and is currently trading around 80500. Technically, the price has moved back above the short-t
BTC-0.65%
ETH-1.23%
$ETH It finally showed some backbone! ETH surged from $2,225 to $2,450, up more than 7% in a single day. This rebound actually has some substance!
Just a few days ago, people were worried that $2,200 wouldn’t hold. Now, $2,500 is almost within reach.
So, can it keep going up? What should you do?
1. First, let’s look at the market.
BTC has reclaimed $80k, and ETH is moving even faster this time. 24-hour contract trading volume exceeded $13 billion, and the market has clearly heated up.
But here’s the thing: despite ETH’s sharp rally, open interest in contracts has barely increased, and the fund
post-image
ETH-1.23%
Profiting from both longs and shorts in a single day—that was November 4.
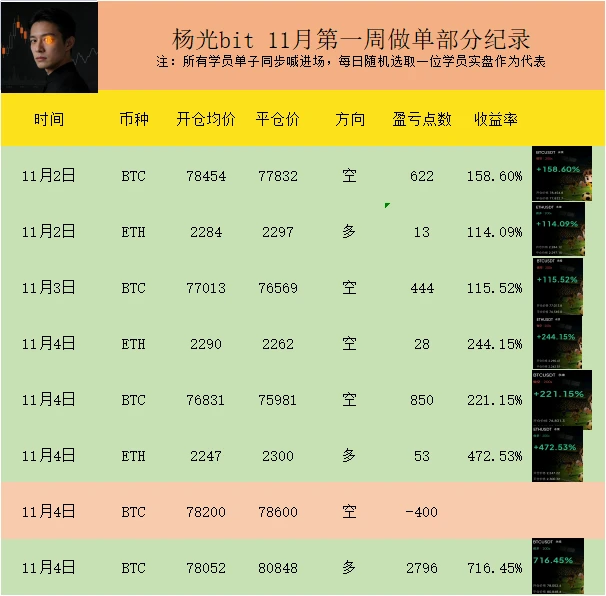
Short when it’s time to short, go long when it’s time to go long, with every directional switch perfectly timed. Not one losing position held, not one trade left waiting to break even.$BTC ‌$ETH ‌#BTC重返8万
post-image
BTC-0.65%
ETH-1.23%
Load More

Join 40 M users in our growing community

⚡️ Join 40 M users in the crypto craze discussion

💬 Engage with your favorite top creators

👍 See what interests you

Trending Topics

BTCBackAbove80K

16.93k Views41.11k Discussing

After a sharp dip, Bitcoin climbed back above $80,000 on May 9 and is currently trading around $80,200. Over 50,000 traders were liquidated in the past 24 hours amid fierce long-short battles. The recurring Iran-U.S. tensions remain the primary short-term variable. Following U.S. airstrikes, Iran\'s Revolutionary Guard claimed to have breached the Strait of Hormuz defense line, leaving the ceasefire outlook uncertain. On the technical side, the daily SMA20 ,$77,970 serves as key support, with the RSI recovering from oversold levels to 43. The $80,000 level is both a psychological barrier and a bull-bear dividing line.Holding above it could lead to a challenge at $85,000, while a break may trigger a retest of the $77,000 area.

DemocratsWinBothChambers

15.81k Views412 Discussing

GateLaunchesTaiwanStockTrading

13.86k Views271 Discussing

View More