Square
Following
Hot
News
Notifications
Profile
Share your thoughts
placeholder
Article
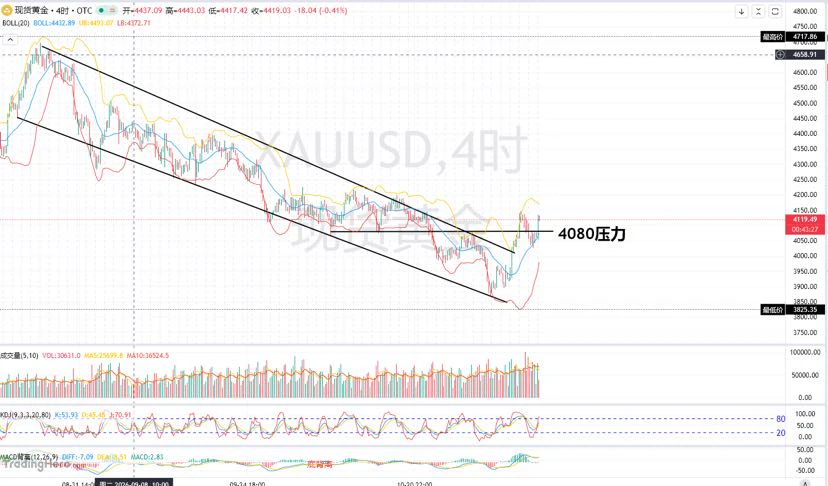
Gold this morning can be summed up in four words: a strong rally followed by high-level consolidation. It surged straight to around 4134, with considerable momentum, then stabilized above 4100 and moved sideways at elevated levels.

The descending trendline on the four-hour chart has capped gold prices for a long time. Recent macro factors broke through that resistance, and prices held above 4100. 4080 has become key support, and price is currently testing the 4100–4080 support zone. Although there is reason to be bullish, don’t chase blindly. On the four-hour timeframe, the strategy is to buy
post-image
XAU+0.38%
XAUT+0.34%
BTC-0.65%
ETH: Called the short at the early-session price; even if you entered late, 2132 was still the entry point.
Panicked when it bounced to 2153? Just lock in the stop-loss at 2163. The message was clear: the rebound was just setting up the drop.
As expected, it plunged hard toward the close. Take-profit at 2088, right on target, banking 399% profit and a solid 6000U.
What does real skill look like? Not losing your nerve at every rise and fall, but staying steady during a shakeout and taking full advantage of the drop.
The broader trend was clear all along. Follow it, and profits may be late, but
ETH-1.23%
Trenches
牛逼
牛
bade
b
牛逼
0x96...7777
Market Cap
$.
Change
.
24h Vol
$.
Holders
.
ZIG
Z
bade
b
ZIG
0x8c...1145
Market Cap
$.
Change
.
24h Vol
$.
Holders
.
BTC
B
bade
b
BTC
C5xp...pump
Market Cap
$.
Change
.
24h Vol
$.
Holders
.
STONK
S
bade
b
STONK
6GmA...UNgx
Market Cap
$.
Change
.
24h Vol
$.
Holders
.
fxUSD
f
bade
b
fxUSD
0x08...d8f6
Market Cap
$.
Change
.
24h Vol
$.
Holders
.
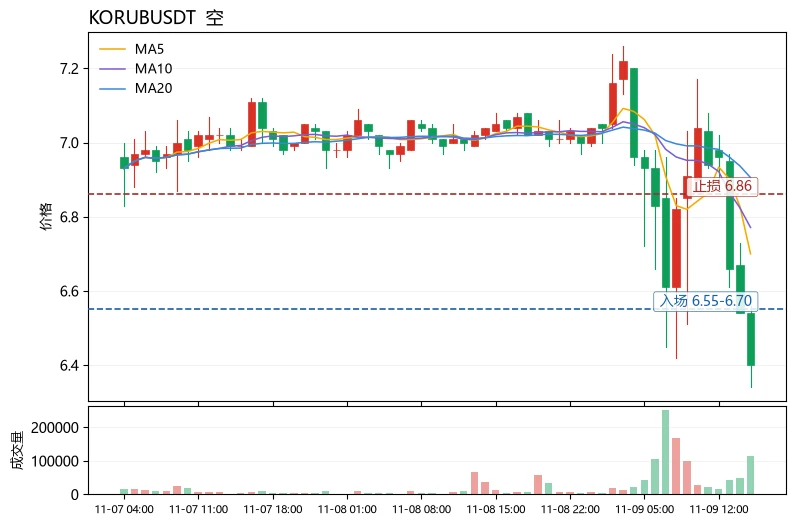
$KORUB The current price is 6.4. Key short-term levels are the Bollinger lower band at 6.50 and MA5 at 6.70. The price has fallen below the lower band and is tracking along it, indicating a weak structure dominated by bearish momentum.
From a capital-flow perspective, the 24h decline is -9.09% and trading volume is 7.8M. Volume does not suggest panic selling, but rather passive position reductions by bulls. MA5 at 6.70 is below MA20 at 6.9055, with the moving averages in a bearish alignment. RSI at 31.0 is near oversold but shows no divergence, while the MACD histogram at -0.05065 is still exp
post-image
KORUB
KORUBSouth Korea Bull
Four.meme
MC:$3.67KHolders:1
0%
SOL-0.77%
ADA-1.48%
1000SHIB | Short 🔴 | Bearish | 15m 24h: -3.64% | Volume: 26.0M USDT Short rationale: price below EMA200; EMA20/50/200 in bearish alignment; RSI14 is 34.6; MACD histogram is negative; ADX14 is 24.3; volume is 2.83x the 20-candle average; trend pullback/continuation. Entry: 0.004353 Stop loss: 0.00443055 Take profit 1: 0.00425606 | Take profit 2: 0.00419789 | Take profit 3: 0.00412034 Entry price is for reference only; do not chase trades. The strategy is invalidated if the stop-loss level is hit. Technical analysis only; not investment advice. $1000SHIB$1000SHIB
post-image
Ethereum forecast played out as expected, with all targets hit✅
Previous setup: short on a rebound into the 2250-2280 range, with the first target at 2200 and a break below opening the way to 2150-2100.
After facing resistance at the highs, the market fell all the way down, hitting a low of 2050 and delivering a 203-point move, breaking straight through the lower end of the expected range.

Market moves are never random. Understand the cyclical structure, position with the trend, and the entire scenario plays out as planned—every part of the analysis is validated.$ETH
ETH-1.23%
Satoshi's Bitcoin Could Be Protected From Quantum Threat
#BTC Core developer Cory Fields has proposed three new mechanisms to defend Bitcoin against future quantum attacks.
Quantum Landmines, Staked Auction, and Sats Auction all require anyone trying to spend BTC protected by older cryptographic methods to lock up matching collateral first.
⚠️ Personal market analysis only. NFA — manage risk and DYOR.
Educational content, not investment advice or a recommendation to buy, sell, deposit, or withdraw any asset. No paid promotion or referral/affiliate links.
post-image
BTC-0.67%
SATS-1.00%
BTC | ETH | Gold | Crude Oil
live-cover
LIVE3,766
@cz_ “Tokenized stocks trade 24/7, giving you an edge on news over the weekend.”
Imagine being able to prove ownership of a digital item without relying entirely on a traditional central platform.
Blockchain technology is helping make new forms of digital ownership possible through tokenization and NFTs.
The internet is evolving, and ownership is becoming an interesting part of that conversation.
#DigitalOwnership #NFT #BlockchainTechnology #Web3
post-image
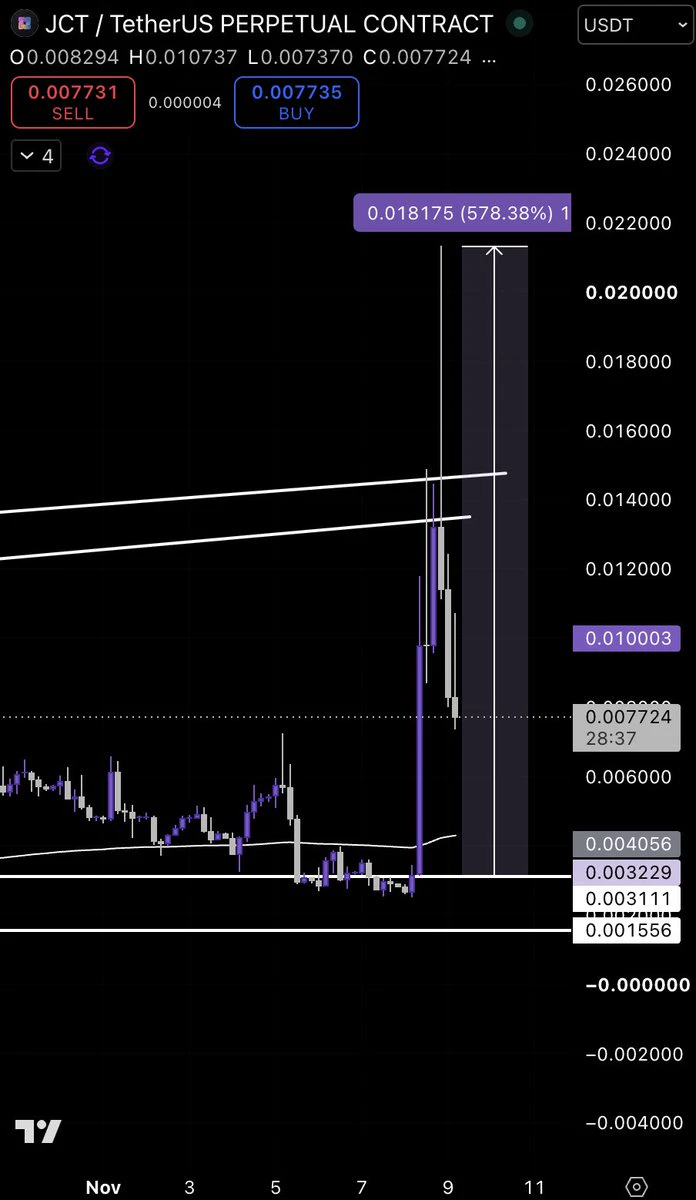
ethereum:0xc477b6dfd26ec2460b3b92de18837fd476ea7549 finally hit the area we were waiting for! 🎯
Price reached our $0.0031–0.0032 accumulation zone before the explosive move.
Now trading around $0.0077, with the next major resistance around $0.0135–0.0147.
Patience pays. We had the levels mapped out before the move. 🟢
post-image
AI bubble, not crypto bubble.
Why is crypto still falling along with it?
Satoshi didn’t cheat on anyone.
post-image
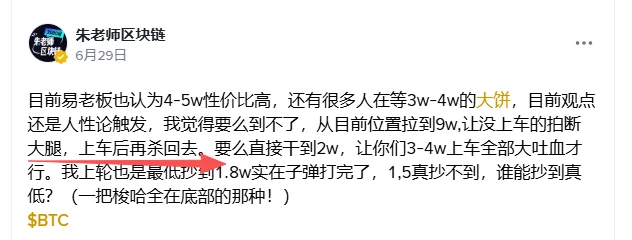
This market isn’t really going to do what I predicted in June and crash back down, is it? I’m scared as hell. $BTC
post-image
BTC-0.67%
Sudden flash crash before BTC’s weekly close! A wick down to $73,510, with $715 million in long
live-cover
LIVE2,284
Gate’s stock margin trading feature is officially live! You can borrow funds to increase exposure to stocks you favor, or borrow shares to sell when you expect a pullback, locking in spot profits or profiting directly from shorting.

The US, Hong Kong, Japanese, and South Korean markets all support trading in both directions. Come learn more details ⬇️
https://gate.com/announcements/article/102638
‍#Gate #TradFi #融券做空 #美股
post-image
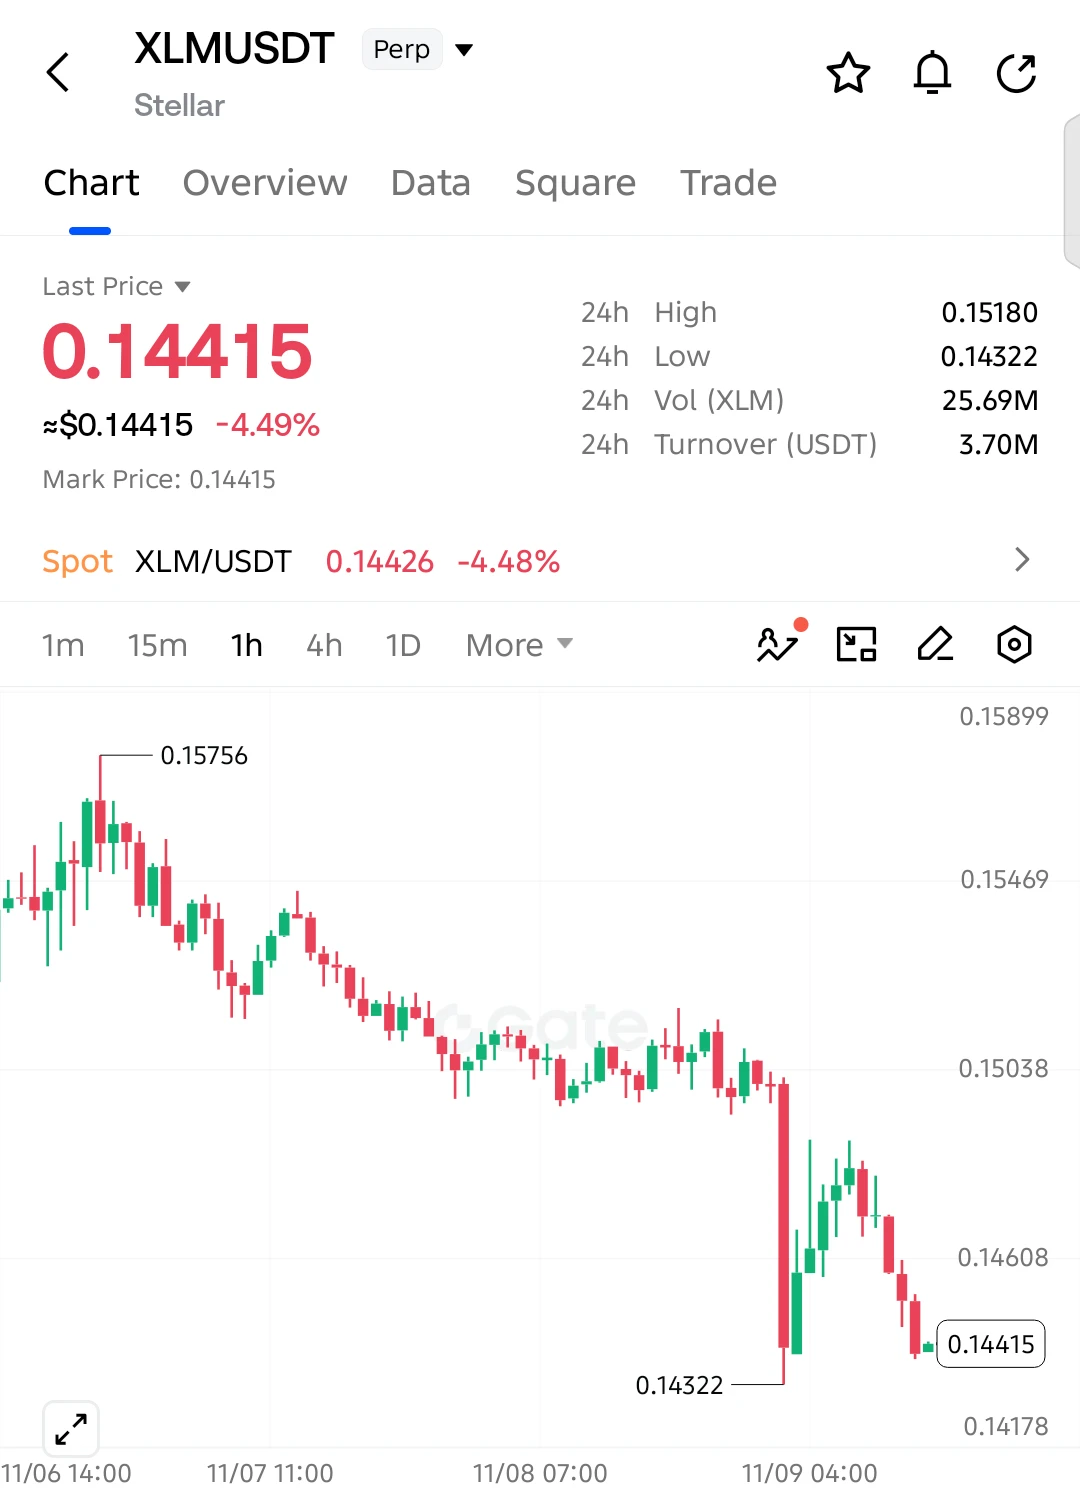
$XLM SHORT SETUP — SELLERS EYE ANOTHER BREAKDOWN!

$XLM is down 4.49%, with bears maintaining strong pressure after the rejection from 0.15756. The latest recovery has failed, putting the 0.14322 support back in focus!

Entry: 0.14415
SL: 0.14650

TP1: 0.14322
TP2: 0.14178
TP3: 0.14000
Final Target: 0.13850

$XLM continues forming lower highs as sellers dominate the market. The recent bounce was rejected near 0.148, and price is now approaching its previous low. A breakdown below 0.14322 could accelerate selling toward 0.14000 and potentially lower.

Invalidation: A sustained recovery above 0.
post-image
XLM-0.64%
Life is insanely busy rn but I would still like to take a moment and say that
$crypto looks good here
post-image
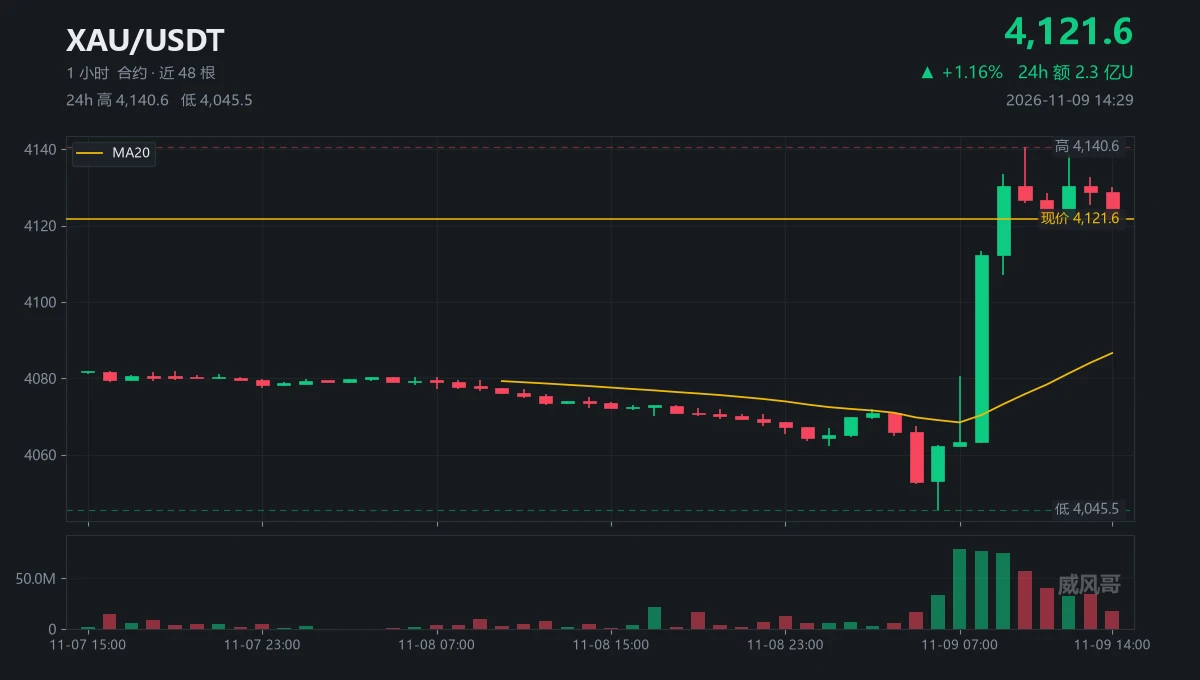
14:29 Let me lay out these ten hours in order
05:00 Dropped to 4052.20, with 16.96 million contracts traded
06:00 It happened again, with a low of 4045.54 and volume nearly doubling to 33.69 million
Together, those two candles still couldn't break below 4045—I made a note of that
07:00 A candle with 78.44 million contracts, the largest of the whole session—I sat right up
But it only closed at 4063.24, with the upper wick reaching 4080.68 before fading
It was the 08:00 candle that actually drove the price up, to 4112.32
09:00 It pushed up again to 4133.48, gaining 1.7% over three hours
Then fiv
post-image
XAU+0.38%
  • 1
What Is the Sortino Ratio? Why Can Focusing Only on Volatility Lead to Misjudging a Trading Strategy?

In cryptocurrency trading, two strategies can have similar returns but very different risk profiles. One strategy may experience frequent, sharp declines, while another may mainly see upward volatility. If risk is measured only by standard volatility, this difference may be overlooked. The Sortino Ratio is a metric that helps complement the analysis.

First, what is the Sortino Ratio?

The Sortino Ratio measures returns above a target return relative to downside risk. It is similar to the Sha
post-image
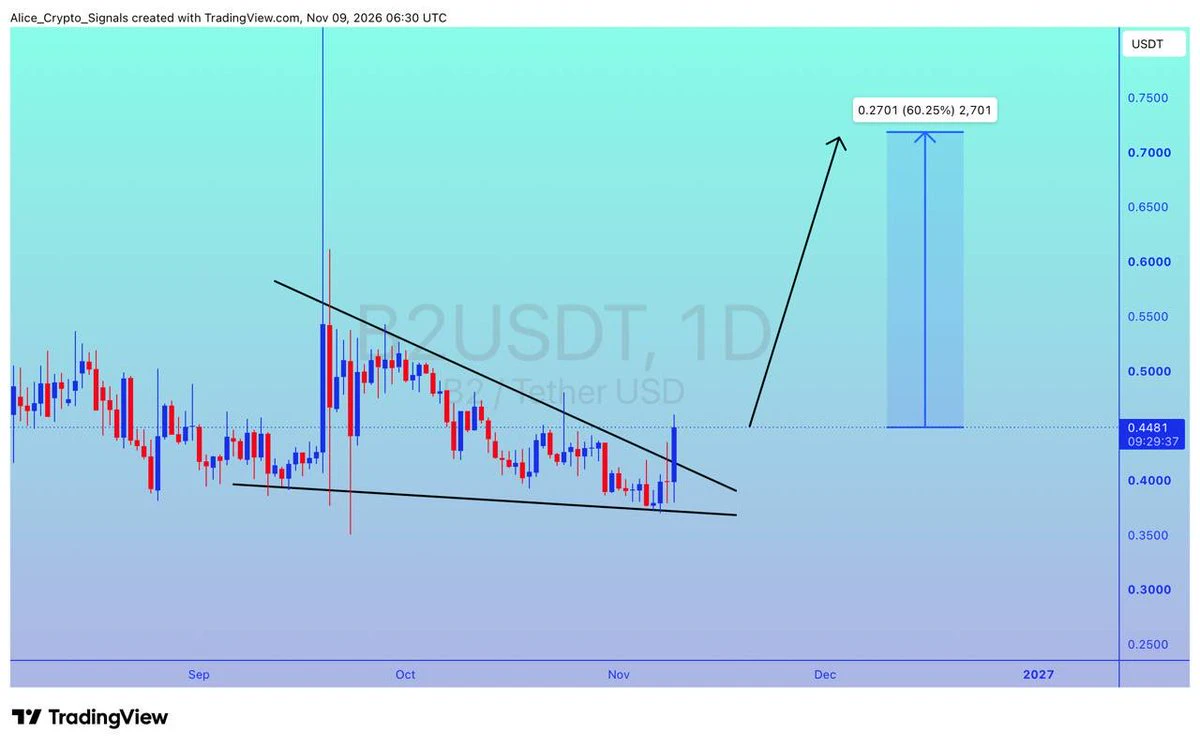
$B2
UPDATE
#B2 looking for breakout. We can see 60%+ gain here ✍🏻
#B2USDT #B2BTC #BTC #Bitcoin #NFTs
post-image
B2-2.19%
BTC-0.67%
$UAI Take the chance to accumulate coins! Prices are still low! You'll regret it if the whales scoop them up tonight!!!
UAI-7.58%
Load More

Join 40 M users in our growing community

⚡️ Join 40 M users in the crypto craze discussion

💬 Engage with your favorite top creators

👍 See what interests you

Trending Topics

USCPIDataIncoming

28.2k Views1.85k Discussing

The U.S. October CPI report will be released on November 10 at 8:30 a.m. ET. September CPI came in at 3.7% year over year, and markets will be watching closely for signs that inflation is cooling, especially in core CPI. A softer-than-expected reading could strengthen rate-cut expectations, while hotter inflation may pressure risk assets through higher Treasury yields and a stronger dollar. How do you think this CPI print will move $BTC, U.S. stocks and gold?

RedBullDoublePodiumInBrazil

1.78k Views30.52k Discussing

BTCFlashCrash

73.42k Views66.23k Discussing

View More