Share crypto content and earn up to 60% commissions through content mining.
placeholder
gatefun
Fam, who understands this? This one “wiped the noise” so hard that it really made the chart snap back into clarity 📉🔥 A few days ago before bed, it was still grinding. It kept trying to charge higher, but it couldn’t get through again and again. I just kept locked onto that breath: the volume didn’t keep up, and the follow-through/support was also weak—there was way too much “liquidity grab” flavor from the long-squeeze bait.
At that time, $CHIP was around 0.05401. What I was watching was heavy pressure at the top. If it tries to push up and nobody’s there to take it, then once it pulls back
CHIP-2.39%
BTC-0.43%
ETH0.22%
View Original
post-image
  • Reward
  • Comment
  • Repost
  • Share
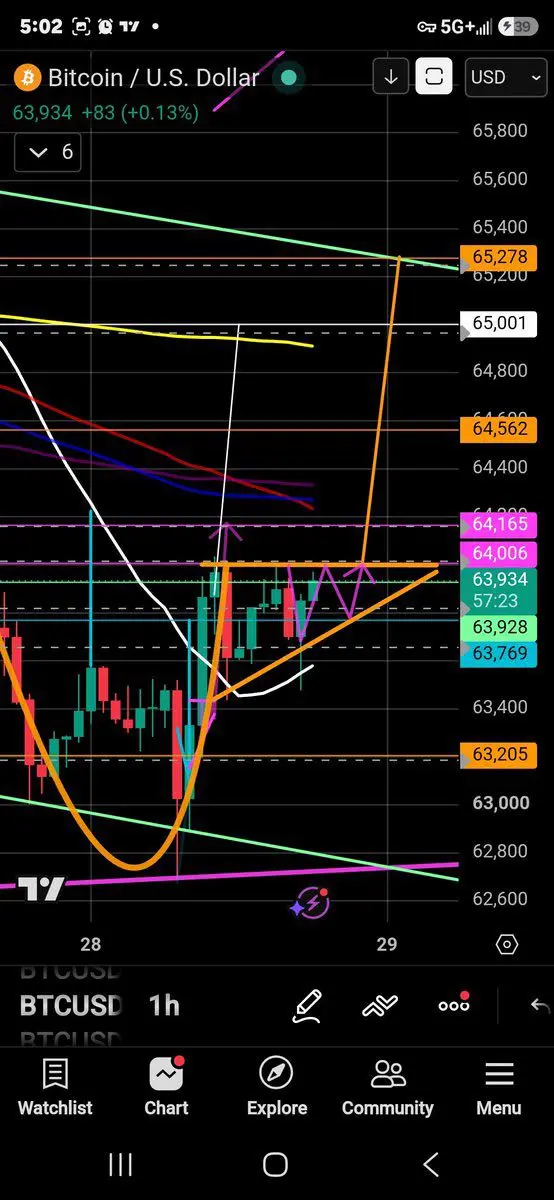
A brief analysis of BTC’s short-term trend from the Dow Theory, Chan theory, Elliott Wave theory, volume-price relationships, order flow, and price action (strategy suggestions)
$BTC #btc
Comprehensive assessment
Dow Theory indicates that the main trend is still a deep downtrend, with a very strong resistance signal above 64,660. The short-term trend has entered a pullback and consolidation phase; the key levels are 64,000 (above) and 63,500 (below).
Chan theory shows that both upward stroke strength (+1,353) and downward stroke strength (-679) are relatively weak; the current phase is a do
BTC-0.43%
View Original
post-image
post-image
  • Reward
  • Comment
  • Repost
  • Share
Too ruthless! After this dump, my screen even feels clearer. 🚨📉 A few days ago, before bed $MON was still hard-up at the high end. A lot of people saw the bounce and wanted to rush in. At the time, I wasn’t focused on whether it would rise—I was focused on whether anyone would be there to catch it.
Before the board fully kicked off, every time MON surged it always lacked a breath, and volume didn’t keep up. The moment the overhead pressure got touched, it turned soft 👀 So at that time I judged the bounce more like a bull trap, and I followed the plan to open a long around 0.02670.
Now the
MON-3.48%
BTC-0.43%
ETH0.22%
View Original
post-image
  • Reward
  • Comment
  • Repost
  • Share
Good morning to all crypto pre-rich bro and sis
post-image
  • Reward
  • Comment
  • Repost
  • Share
Woke up and I’m fully energized! 📉😎 A few days ago, right around early morning, it was still grinding around a high level—on the surface the chart looked strong, but on closer inspection, the order-book support was insufficient, and the overhead suppression was always clearly visible.

Back then I was watching $ENA . Around 0.10828 I gave an early bearish signal to handle it—not because I only said it after it started falling, but because even before the chart fully kicked off, you could already smell the “no-volume” kind of rally. 👀📢

Don’t fear it grinding; fear that you’ll panic first.
ENA-2.22%
BTC-0.43%
ETH0.22%
View Original
post-image
  • Reward
  • Comment
  • Repost
  • Share
Silver—this round of bearish pressure—who exactly is taking over the bag?

$XAG /USDT - Short SHORT

Trading plan:
Entry: 59.75 – 59.79
SL: 59.98
TP1: 59.61
TP2: 59.51
TP3: 59.35

Why focus on this structure?
- The 4H timeframe signal clearly points to SHORT; the RSI on the 15-minute chart has already broken below 43, with bearish momentum dominating.
- Current price 59.77 is hovering just below the EMA; once it breaks 59.61 (TP1), the odds of bearish acceleration increase significantly.
- Why now? The 1D trend is in a ranging zone; the bearish signal has just been triggered, and the entry
XAG-0.25%
View Original
post-image
post-image
  • Reward
  • Comment
  • Repost
  • Share
you were not too much.
you were too much
for people
who were too little.
there is a difference.
and one day
someone will need
exactly the ocean
you were told
to shrink. 🌹
post-image
  • Reward
  • Comment
  • Repost
  • Share
WORLD CUP PREDICTION
gate liveLIVE
1,714
  • Reward
  • Comment
  • Repost
  • Share
$BTC Update Weekly
Bitcoin Open Interest Delta (365-day) just recorded the second largest decline in history on a USD basis.
However, when measured in coins across 30 exchanges, the delta remains positive.
This suggests OI is still elevated relative to current prices — setting the stage for potential massive liquidations on the next strong move.
#PredictWorldCup🇳🇴vs🏴󠁧󠁢󠁥󠁮󠁧󠁿
BTC-0.41%
post-image
post-image
  • Reward
  • 5
  • Repost
  • Share
ColdStartUnderTheAurora:
OI denominated in USD vs coins tells two different stories, classic case of why you always check both metrics before making a leveraged bet.
View More
One memecoin will do a #100x.
Which one is it? 👇
MEME-1.49%
post-image
  • Reward
  • Comment
  • Repost
  • Share
ZEC bullish signal 95%, but RSI is only 39—who’s lying?
$ZEC /USDT - Go LONG
Trading plan:
Entry: 505.26 – 508.92
SL: 489.50
TP1: 520.28
TP2: 529.08
TP3: 542.27
Why focus on this structure?
- 4H EMA bullish alignment, the 1D trend is clearly bullish, but the 15-minute RSI is only 39, indicating the short-term is severely oversold.
- ATR 7.32 suggests volatility may expand; current 507.09 is near the support zone, and the LONG risk-reward is over 1:2.
- Why now? RSI is at a low level + trend resonance—a typical pullback buying window, not chasing after a pump.
Discussion:
Will this wave hit TP1
ZEC2.14%
View Original
post-image
post-image
  • Reward
  • Comment
  • Repost
  • Share
Guys, who understands this?! This round of dumping really gave me a boost in energy 📉🔥 A few days ago, right before bed, the chart was still grinding at high levels. Many people thought it was going to keep pushing. I was watching it and felt something off: the breakout up had no volume, and the support looked thin— the trap-for-longs vibe was getting stronger and stronger 👀

$GIGGLE Back then, around 30.22, I gave a short idea. It wasn’t about chasing the sell-off; it was because every time it went up, it always fell short by a breath. The overhead suppression was obvious. Before the mar
GIGGLE-1.49%
BTC-0.43%
ETH0.22%
View Original
post-image
  • Reward
  • Comment
  • Repost
  • Share
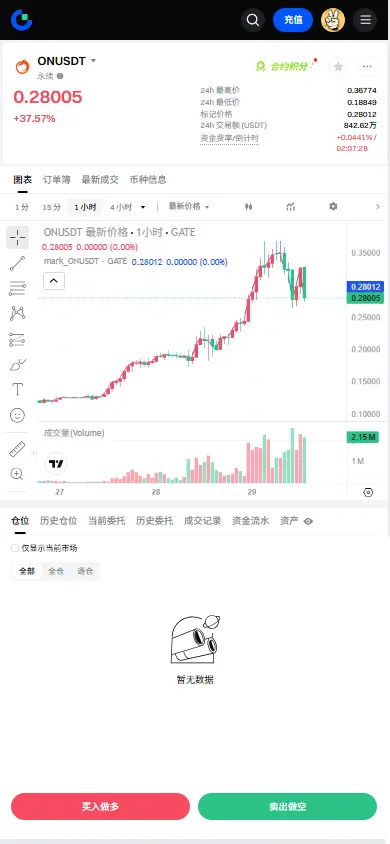
This round is a classic pattern of first scaring people, then pumping the market. After that initial pullback and retest in $IO , many thought it was going to break down—but the long positions held from 0.16220 to 0.16536. Now it’s up 138.33%, and the chart directly flushed out the panic sellers.
What really caught my attention is that after the drop, it didn’t continue to sell off with heavy volume. Instead, it quickly recovered, which suggests there are buyers underneath. Most people, seeing a sharp drop, only think about running—but trading can’t just look at the surface. After sweeping one
IO-2.87%
BTC-0.43%
ETH0.22%
View Original
post-image
  • Reward
  • Comment
  • Repost
  • Share
So satisfying! After grinding at the high level for half a day, the final wick straight dropped and basically nailed the direction in plain sight 🚨📉. On my last look before sleep at $CYS , it was still pretending to be strong, but I instantly felt something was off with this setup.

While everyone is still debating whether to chase, I watched the rebound strength of CYS and found that volume didn’t keep up—the overhead suppression is obvious. Every time it surged up, there wasn’t anyone there to catch 👀. At this kind of position, I’d rather wait for the shorts to push, so I opened a long ne
CYS2.28%
BTC-0.43%
ETH0.22%
View Original
post-image
  • Reward
  • Comment
  • Repost
  • Share
It looks like just a routine pullback, but on closer inspection you’ll see the key level above has never been resolved, and every time price approaches the highs, there’s a clear hesitation.
For this $EPIC , what I’m watching is the continuation after the breakdown. My entry was at 0.4740; then price dipped to 0.3895, with a return of +434.04%. This feedback matches my review expectations.
During the drop, I didn’t just focus on the result—I observed whether the selling pressure stayed consistent and whether the rebound had strength. When weakness continues, what you fear most is having your sh
EPIC15.45%
BTC-0.43%
ETH0.22%
View Original
post-image
  • Reward
  • Comment
  • Repost
  • Share
You were still stalling a few days ago, and today you directly give the answer! 🔥📉 After my last look before sleep, I felt something was off—$AVAX the upside push had no force, and the volume didn’t keep up. The more it pulled, the weaker it got. The biggest risk at this position isn’t that it doesn’t drop—it's that someone chases in and then gets reverse-swept.
At the time, the short from 9.375. Now looking at 6.55—your return rate is already up to +2135.85%. Whether it feels comfortable or not, you can check for yourself ✅🎉 This move isn’t luck; it’s the rhythm playing out after pressure
AVAX-3.61%
BTC-0.43%
ETH0.22%
View Original
post-image
  • Reward
  • Comment
  • Repost
  • Share
100u challenge to 10wu — Day 17, a slight loss $ETH
ETH0.22%
View Original
post-image
  • Reward
  • 3
  • Repost
  • Share
GasfeeComplainer:
The road from 100u to 10wu is still long—don’t get too carried away with futures leverage; staying alive is the most important.
View More
This trend is really a bit ridiculous! 🔥📉 A few days ago, when everyone was still watching from the sidelines in the afternoon, $OPEN was showing a rebound on the surface. But in reality, every time it went up, no one was there to take it—I knew this move couldn’t be fooled by a fake breakout.
At the time, I was watching around 0.1821. When I saw a no-volume surge, with insufficient follow-through, and the overhead resistance pressing down hard, what I was suggesting was to go short along with the high-level pressure—🎯👀
Now the price has moved to 0.1467, with returns of +1367.67%. If you n
OPEN-5.45%
BTC-0.43%
ETH0.22%
View Original
post-image
  • Reward
  • Comment
  • Repost
  • Share
NEAR drops below a key support level for nearly 4 hours; bearish signals are fully in place
$NEAR /USDT - SHORT sell
Trading plan:
Entry: 1.8643 – 1.8735
SL: 1.9128
TP1: 1.8360
TP2: 1.8141
TP3: 1.7812
Why focus on this structure?
- 15-minute RSI is only 26.51; in the oversold zone, selling accelerates and the short-term bounce lacks strength
- 4-hour EMA bearish alignment; 1.8735 is the last line of defense
- Prioritize TP1 1.8360; if it breaks, it directly targets TP2 1.8141
Discussion:
Will this bearish move first bounce to 1.8360, or will it directly smash through 1.8141?
NEAR-1.23%
View Original
post-image
post-image
  • Reward
  • Comment
  • Repost
  • Share
Load More

Join 40 M users in our growing community

⚡️ Join 40 M users in the crypto craze discussion
💬 Engage with your favorite top creators
👍 See what interests you
  • Pinned