


Square
Following
Hot
News
Profile
Share your thoughts
placeholder
Article
Go long here. 🚀Entry range: 0.0559 - 0.0564Profit target 1: 0.05875Profit target 2: 0.06083Invalidation level: 0.05422The price has reclaimed the MA25 on the 15-minute chart, indicating a healthy consolidation above the 0.05600 support level. RSI(6) is 54.99, and the MA99 on the 1-hour chart is overhead at 0.05695, leaving sufficient room for a trend-following short-term trade targeting the recent 24-hour high. Click here to trade 👇👇👇Market dynamics: $SOL : Current price 105.55 - 24-hour change: +0.90%$ZEREBRO : Current price 0.051092 - 24-hour change: +26.12%
post-image
SOL+3.92%
ZEREBRO+27.81%
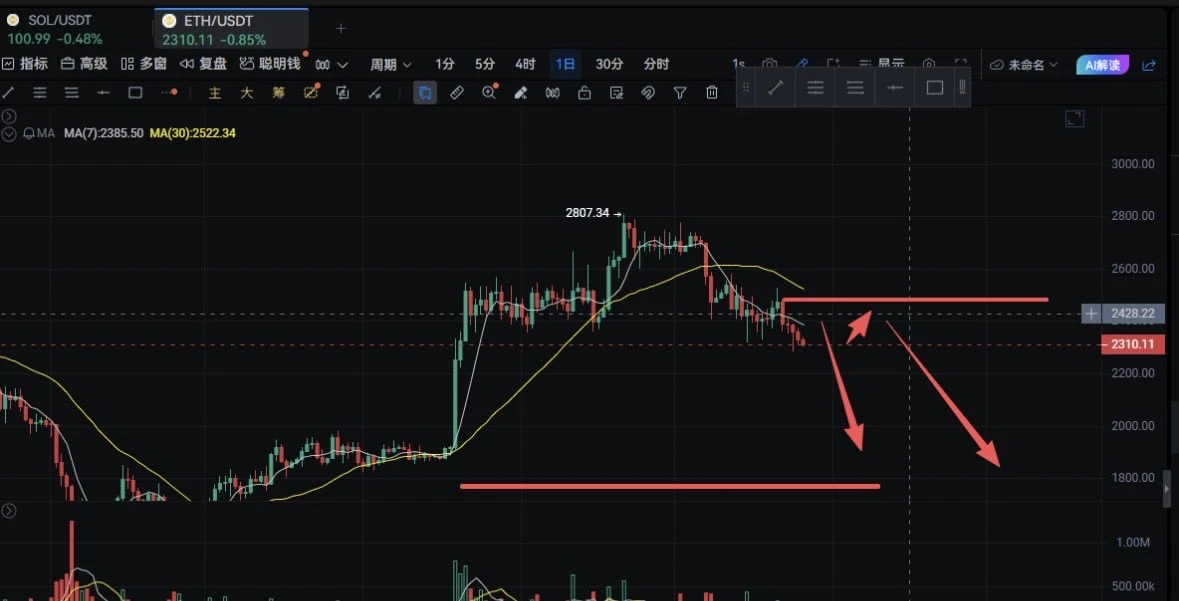
Starlink | October 16, 2026 SOL Plan for Today
Direction: Short-term rebound recovery; go long after a pullback confirmation, and do not chase highs.
Entry range to watch: 103.5–104.5
First target: 106
Second target: 107.5–108
Defensive reference: Below 102
Yesterday, SOL dipped as low as 100.46 but never effectively broke below the 100 round-number level. It then saw a volume-backed rebound and returned above 105.
This level is worth watching.
$100 is an important psychological level. Its failure to sustain a break below it yesterday indicates buying support emerged at lower levels. However,
post-image
BTC+1.74%
ETH+3.94%
SOL+3.60%
What in the world ?! 🤯
post-image
live market update
live-cover
LIVE2,040
$FIL5L 0.18292 Negative 5% one second, positive 4.5% the next。。。You’re directly changing the page too??Not even pretending anymore?
post-image
FIL5L+12.74%
#USSeptemberPPIBeatsExpectations Wholesale Inflation Surges, and Energy Is the Main Driver
Producer prices in the United States rose far more than analysts expected in September 2026, and the report is drawing attention from traders, businesses and policymakers.
The headline numbers
The Producer Price Index (PPI) rose 1.3% month over month, more than double the roughly 0.6% increase economists anticipated. The Bureau of Labor Statistics said this was the largest monthly advance since March 2022. The prior months were smaller: 0.5% in August and 0.2% in July.
On an annual basis, the index rose
Falcon_Official
#每周来晒 #USSeptemberPPIReleased
#ShareWeekly Producer Inflation Meets a $80K Bitcoin Test: Can the Fed Afford to Ease?
Bitcoin is entering September’s U.S. Producer Price Index release with a difficult macroeconomic backdrop. The key question is whether wholesale inflation confirms the price pressures already visible in consumer data or offers the Federal Reserve some room to reconsider its policy path.
Economists are forecasting a 0.6% monthly increase in headline PPI for September, compared with 0.4% in August. Core PPI, excluding food and energy, is expected to rise 0.3%, up from 0.2%. The annual headline rate is forecast at 5.5%, compared with 5.4% previously. These are expectations, not confirmed results; the actual figures must determine whether producer inflation has surprised markets.
The starting point is already uncomfortable for policymakers. September CPI rose 0.6% month-on-month and 3.7% year-on-year, while core CPI increased 0.3% monthly and 2.6% annually. Gasoline prices climbed 9.1% during the month, adding to headline inflation pressure. If producer prices also exceed expectations, markets may worry that higher business costs could feed into consumer prices and make a near-term shift toward easier monetary policy more difficult.
The composition of PPI will matter as much as the headline. A surge concentrated in energy or goods could signal a different inflation problem from persistent increases in services. Investors should watch final-demand goods and services, energy-related components, transportation and trade services, alongside any revisions to earlier readings. A softer headline accompanied by stubborn core services would not necessarily deliver a clean bullish signal.
Bitcoin’s sensitivity to interest-rate expectations is already visible in the current market backdrop. On October 15, Barron's reported BTC at $80,743, down 1.2%, after an overnight low of $80,247, as hotter consumer inflation strengthened rate-hike concerns. These are reported market levels, not a verified PPI-release reaction.
Three scenarios now matter. If headline and core PPI both come in below forecasts, Treasury yields and the dollar could face downward pressure, potentially improving conditions for BTC and other risk assets. If both exceed expectations, renewed rate-hike concerns could strengthen the dollar and weigh on crypto. A mixed report may leave markets focused on core services, revisions and whether the increase is broad-based.
The confirmation test is the cross-market response: BTC’s price and volume after publication, the U.S. dollar index, Treasury yields and Nasdaq futures. A brief Bitcoin bounce alone would not establish a lasting trend; sustained movement alongside rates and the dollar would provide stronger evidence of a macro-driven repricing.
The central issue is not whether one inflation report automatically makes Bitcoin bullish or bearish. It is whether producer-price pressure changes the expected path of monetary policy and whether traders have already priced that risk into BTC.
Will September PPI reinforce the case for tighter U.S. monetary policy, or give Bitcoin room to recover? The actual release and the market’s reaction not the forecast alone will decide which signal carries more weight.
repost-content-media
GAS+3.88%
FUEL-2.39%
EURUSD-0.35%
  • 2
market updates on today $BTC & $XAU
live-cover
LIVE1,507
2026.10.16 Intraday Market Analysis
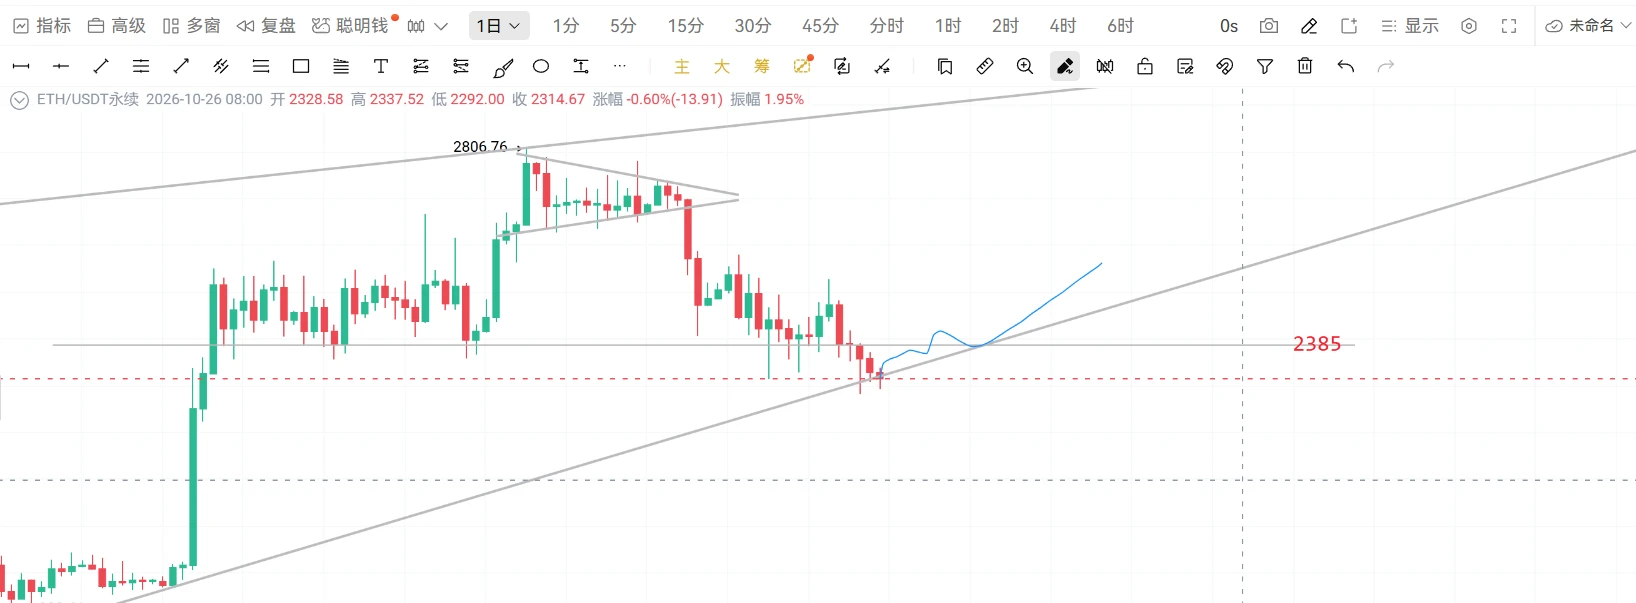
The impact of the news continuing will last for around half a month... The news flow is still bearish... It will continue to ferment on Saturday and Sunday, and begin to establish a foothold next Monday... The current short-term trend is a phased rise, but the market will still decline slowly and retest the bottom
Intraday: After range-bound fluctuations, the market will be pushed higher, with the primary focus on short positions... Today will grind for a long time; gradually scale into short positions
Resistance: 2500, 2550, 83500, 85800
Support: 2400,
post-image
ETH+3.88%
BTC+1.76%
After rebounding from the lows, the market has entered a sideways consolidation phase, leading many to wonder whether there are no more shorting opportunities. Back-and-forth price action is normal, and no effective breakout has occurred within the current range. There is clear resistance above, with short-term resistance at 83500. Below 84300, key support is at 80000. Overall, the market remains in a broad 84300-80000 consolidation range, with the intraday strategy still focused on shorting into strength.
Place short positions in batches above 83000; for a more conservative approach, enter at
BTC+1.76%
ETH+3.88%
$BTC Earlier today, I mentioned that late shorts were at risk of getting squeezed.
This is exactly what we’ve seen now, resulting in price pushing up roughly 3.5% from the lows.
However, that does not mean that longs are safe yet.
BTC still needs to reclaim $84.4k first in order to break bearish structure and shift momentum back in favor of buyers.
Until there is a confirmed break back above that level, another retest of the lows remains possible.
That said, with all the unswept lows taken out and the majority of the remaining liquidity now resting above price, I would still slightly favor a f
post-image
BTC+1.76%
PPI explodes to 6.3%, ripping through the market! Bitcoin fiercely defends the $80k mark, while Huang Renxun’s one sentence sends the crypto world into a frenzy!
Wall Street’s scythe can’t cut through Bitcoin’s bones, but rate-hike expectations can wipe out your positions overnight!
Brothers, US September PPI surged 6.3% year-on-year last night, hitting a four-year high and directly triggering rate-hike panic across the market. Bitcoin briefly fell below $80k, touching a low of $80,154, a nearly three-week low, but then rebounded strongly and is now trading at $82,331.
My view is clear: $80k i
BTC+1.76%
ETH+3.88%
Scumbag Watch: BTC Update 10.16
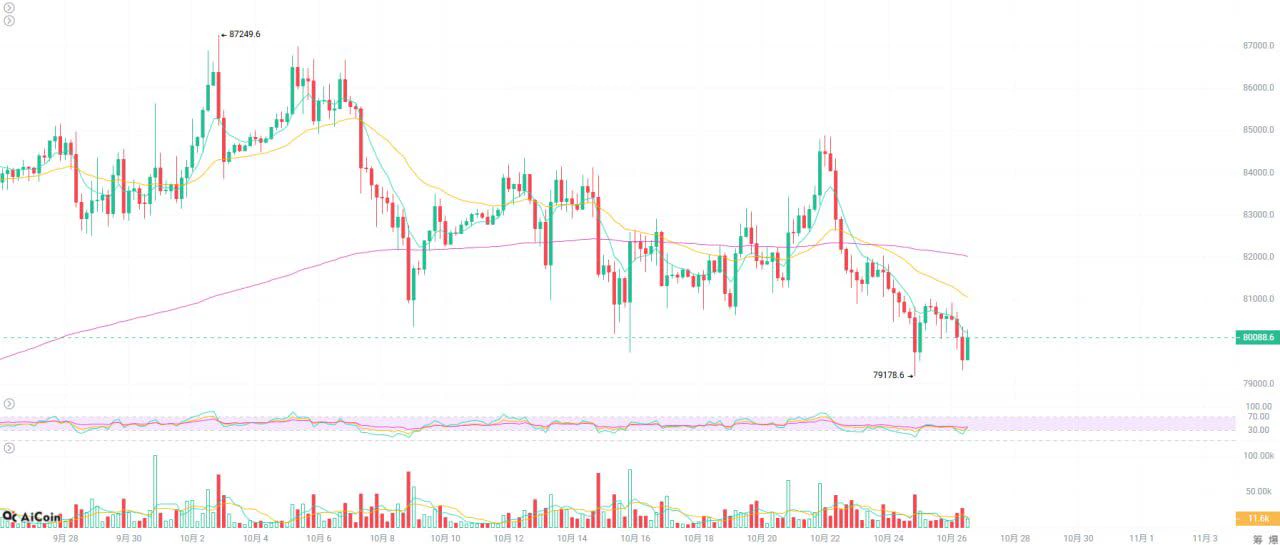
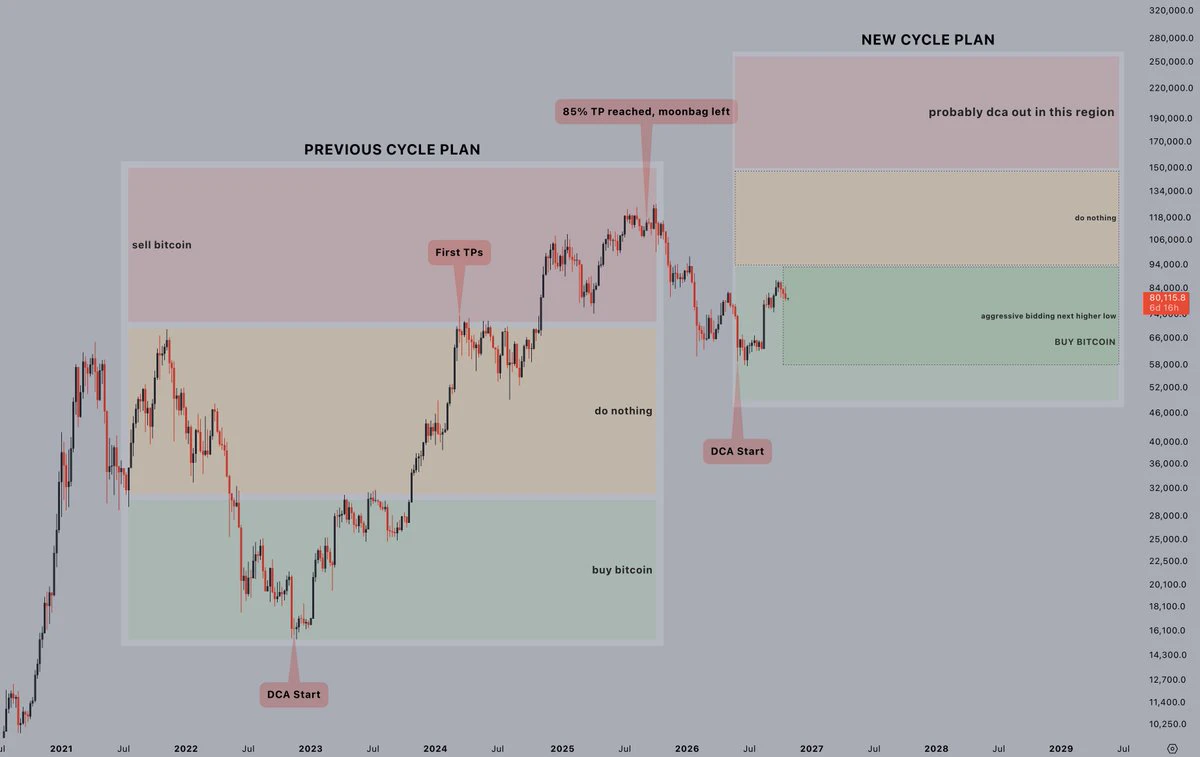
Bitcoin briefly pierced the 80,000 level yesterday before quickly reclaiming it and is currently consolidating around 82,000. It is currently facing resistance from the 5-day and 10-day moving averages, and breaking through requires reclaiming 82,500.
Scumbag has a short position here
The stop-loss will be placed around 83,500
Scumbag’s ultimate take-profit target is 71,000
Of course, 80,800, 78,800, 77,500, and 76,300 are all take-profit levels$BTC
BTC+1.74%
  • 1
$XAUT 10.16 Gold outlook
From the chart, gold remains in a downtrend channel on the larger timeframe, but signs of stabilization and a rebound have emerged on the smaller timeframe. In the short term, lightly enter long positions with the trend, then go short after encountering resistance
Trading reference: Go short once around 4175; if it breaks through, go short around 4115, targeting 4130–4100
post-image
XAUT+0.50%
My friend asked me to find out: Is there still any hope for someone who bought Unitree Technology at 1,100 at the open?
It has been steadily sliding with no rebound whatsoever. After being cut in half, it can still be cut in half again.
At this rate, we’ll probably see Unitree Technology back at its IPO price before the end of the year.
Does every generation get its own PetroChina?
post-image
Micron's earnings report dazzled, yet the stock still plunged—why are its results and share price “fighting” each other?

This is the most puzzling part of this storage-stock pullback—Micron just delivered the best earnings report in its history, yet its stock fell the hardest.

First, the results. Micron's fourth-quarter fiscal 2026 revenue was $54.23 billion, up 379% year over year and 31% quarter over quarter, setting a record for the sixth consecutive quarter. GAAP net income was $37.7 billion, up more than 10x year over year. Adjusted EPS was $33.42, with both revenue and adjusted EPS e
MU+1.93%
wtf
What the hell am I looking at?
This car can fly
post-image
Current price 1376.61, up only +0.95% over 24h, with a trading volume of 40.9M USDT, yet the amplitude across 30 candlesticks is as high as 10.57%—a low gain paired with high volatility indicates a typical long-short rotation zone, not a trend acceleration phase. MA5=1380.32 remains above MA20=1354.25, and the MACD histogram at +6.893 maintains a bullish bias, but RSI=51.7 has returned to neutral. The price is running just below the upper Bollinger Band at 1401.61, with clear resistance at the upper band. The Fear and Greed Index is 63, in the greed zone; sentiment is warm but not extreme, an
SNDKB
SNDKBSNDKB
Four.meme
MC:$3.87KHolders:1
0%
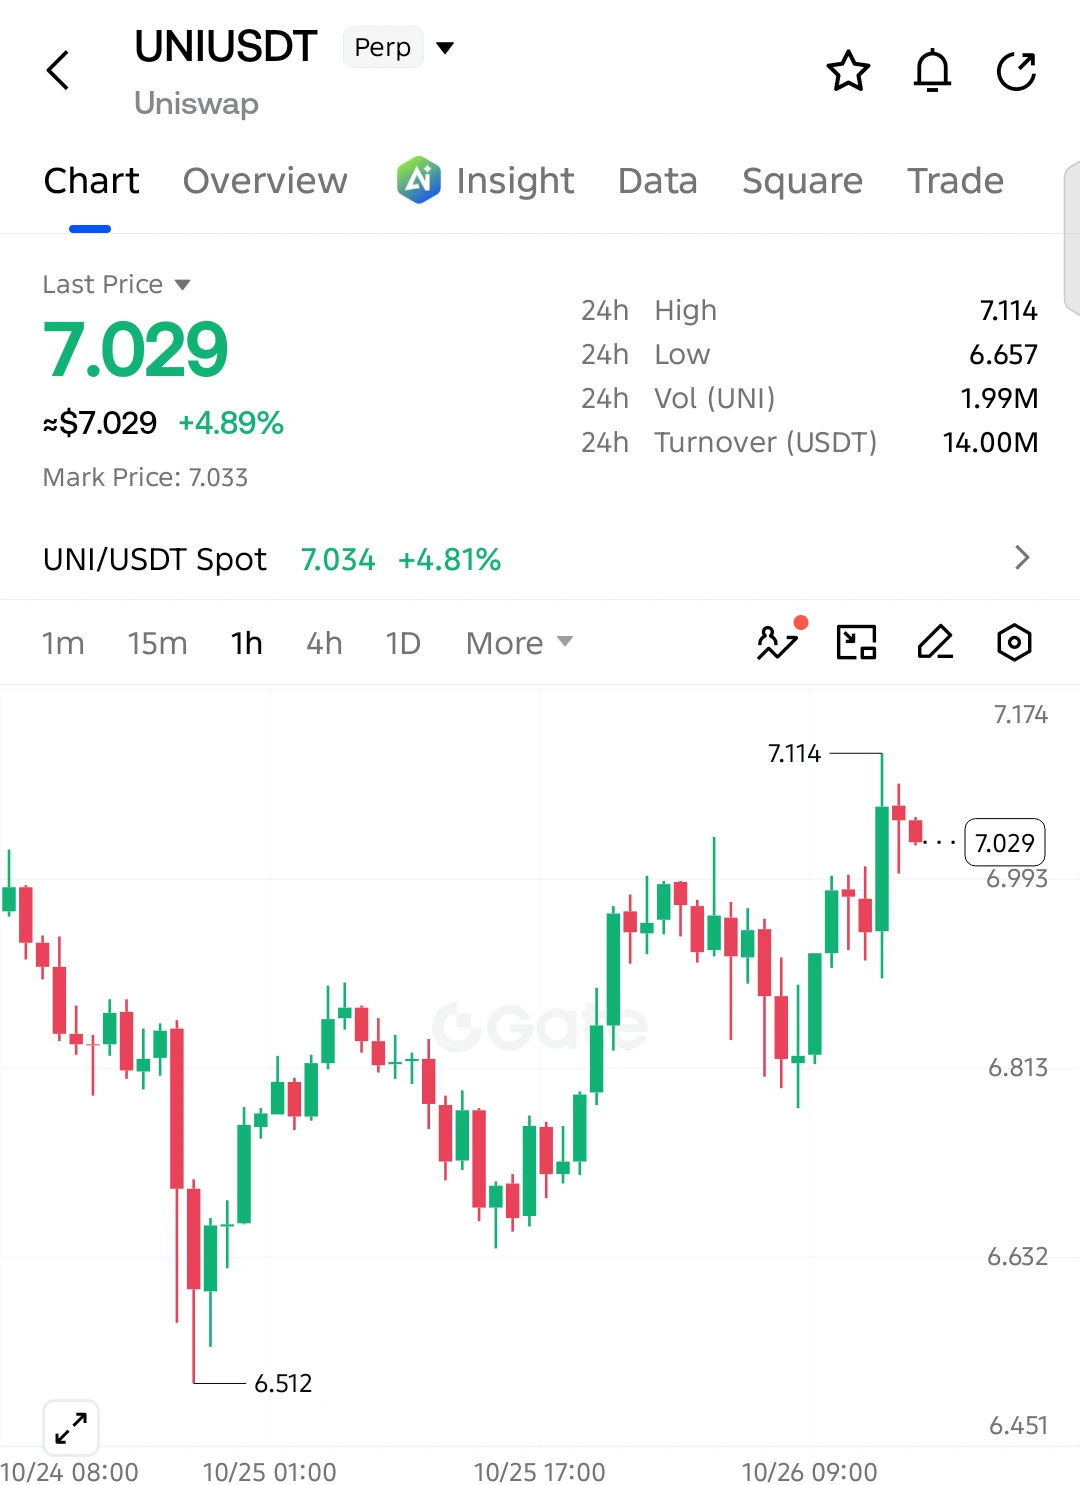
UNI+8.70%
WLD+7.68%
$ARB Current price is 0.1926, with the first resistance above at the Bollinger upper band of 0.2045 and support below initially at MA20's 0.1862. The key point here is not the absolute gain, but the relative strength compared with similar assets.
Looking across the market, ARB is up 7.18% over 24h, compared with just 0.72% for XRP and 1.21% for SOL. ARB's funding rate is -0.0003%, the only negative one among the three, indicating that longs are not crowded and shorts are still paying. This combination of "rising price + negative funding rate" is often healthier during the early stage of a ral
post-image
ARB+12.19%
XRP+2.62%
SOL+3.92%
XR-2.70%
Flying Tesla Roadster @ #ALM solana:DFMt2FyLpB6ekPNAzVErLXgpSnJ9CRf1VnxBAkTLpump
post-image
TSLAG+2.12%
SOL+3.92%
Do you have an update to this touching story?
post-image
Load More

Join 40 M users in our growing community

⚡️ Join 40 M users in the crypto craze discussion

💬 Engage with your favorite top creators

👍 See what interests you

Trending Topics

USSeptemberPPIBeatsExpectations

91.35k Views1.9k Discussing

US September PPI came in at 6.3% YoY, well above the 5.3% market expectation, pointing to renewed producer-side inflation pressure. Weekly jobless claims were 199K, broadly in line with forecasts. Could hotter inflation further reduce room for rate cuts, and what does it mean for $BTC, US stocks, and gold?

DrLinHanSpeaksAtOxfordUnion

135.63k Views1.86k Discussing

KOSPIJumps3.3%

47.29k Views1.88k Discussing

View More