
Square
Following
Hot
News
Notifications
Profile
Share your thoughts
placeholder
Article
$SNDK Rush in and go long; it will soon rise to $1,050. Trust me.
post-image
SNDK-0.18%
$UNITREE Unitree toy factory, you're incredible. I can accept taking a loss at the top, but even these fee vampires can't suck as much as you. I'm done playing with you. Bye.
post-image
UNITREE+4.35%
  • 1
Trenches
牛逼
牛
bade
b
牛逼
0x96...7777
Market Cap
$.
Change
.
24h Vol
$.
Holders
.
PIEVERSE
P
bade
b
PIEVERSE
0x0e...25a9
Market Cap
$.
Change
.
24h Vol
$.
Holders
.
STONK
S
bade
b
STONK
6GmA...UNgx
Market Cap
$.
Change
.
24h Vol
$.
Holders
.
ON
O
bade
b
ON
0x0e...1d48
Market Cap
$.
Change
.
24h Vol
$.
Holders
.
FLOAT
F
bade
b
FLOAT
Bv1a...BMmr
Market Cap
$.
Change
.
24h Vol
$.
Holders
.
Green mountains and clear waters made tangible!
post-image
Tonight we vibe to good movies, 🍕 and some good wine 🍷 #Blessed
post-image
It's almost 7 a.m. I was going to get up early and sneak a peek at the charts, check the liquidation heatmap. Good grief, those bright yellow bands all over the screen woke me right up. A peaceful morning—and the damn market maker has been laying landmines for us all night!

$BTC The price is grinding wildly around 75000. Take a close look at the heatmap: overhead, between 75500 and 76000, there's a thick, glowing yellow line, packed with shorts who aren't afraid to die. But look lower, and between 73000 and 73500 there's also an extremely thick line of long positions. Once the morning liquid
BTC-0.65%
ETH-1.23%
SOL-0.74%
11.10 ETH Public Outlook
【Long Position Outlook】$ETH
  Entry range: around 2080-2100
  Stop-loss level: 2050
Staggered take-profit levels
  First target: 2120
  Second target: 2138
Third target: above 2159
Long-term target: above 2200

Trade factors: The price has fallen below the Bollinger Band middle line, with the bands opening downward. Short-term moving averages are bearishly aligned, and MACD is below the zero line. A low-level golden cross has appeared, signaling a recovery. Market depth shows long positions have the advantage in both numbers and capital.

Tradi
ETH-1.23%
BTC-0.65%
New streamer bts market
live-cover
LIVE1,453
Bad Boy’s RKLB Watch 11.10
Rocket Lab closed at 58.86, up 10.91%. It reached an intraday high of 59.69 and a low of 53.010.
I hadn’t posted about the little rocket for nearly half a month. Coming back, I see it’s been making all kinds of moves, but the stock price is still right where it was.
The intraday high was 59.69, very close to the 30-day moving average. A pullback from this level is still quite possible.
I checked the little rocket’s earnings report after the market closed today. I’ll cover the earnings analysis separately.
The stock recently hit a low around 44, still some distance fr
RKLB+10.84%
What is liquidity risk? Why might a profitable position still be impossible to exit at the expected price?

In cryptocurrency trading, many people focus on price movements but overlook another question: When you actually want to sell, is there enough buying interest in the market to absorb your order? If the bid-ask spread widens and order book depth is insufficient, the actual execution may fall short of expectations even if your account shows a profit.

First, what is liquidity risk?

Liquidity risk is the risk that an asset cannot be bought or sold smoothly within the required timeframe at
post-image
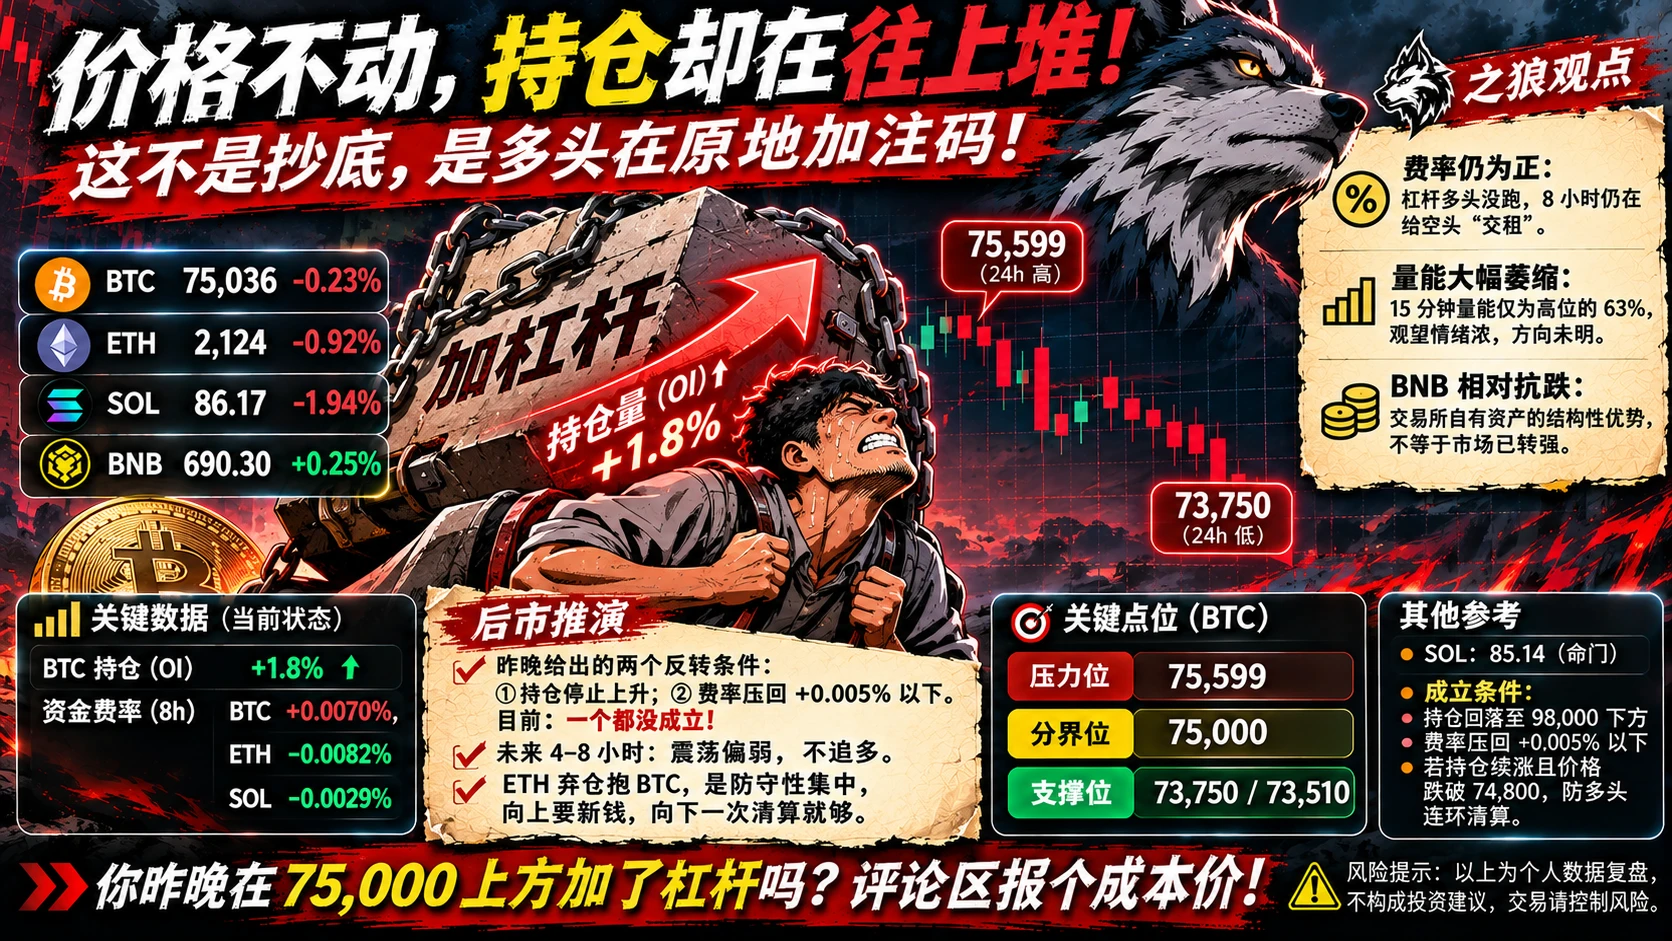
#美国10月CPI即将公布 Price is flat, but open interest keeps climbing. After touching 75,368 last night, BTC closed three consecutive 1-hour candles lower, while longs added 1.8% more leverage—this is the ugliest setup right now.
Market:
At 10:00, BTC was 75,036 (24h -0.23%), ETH 2,124 (-0.92%), SOL 86.17 (-1.94%), and BNB 690.30 (+0.25%). 24h high: 75,599; low: 73,750.
Key points today:
First, prices are falling, but funding rates are still positive. That means leveraged longs haven't left; they're holding on and paying shorts an overnight fee every 8 hours. Shorts aren't in a hurry because the marke
post-image
BTC-0.65%
ETH-1.23%
SOL-0.77%
BNB-0.76%
Even knockoff versions of Alice Huang have appeared
post-image
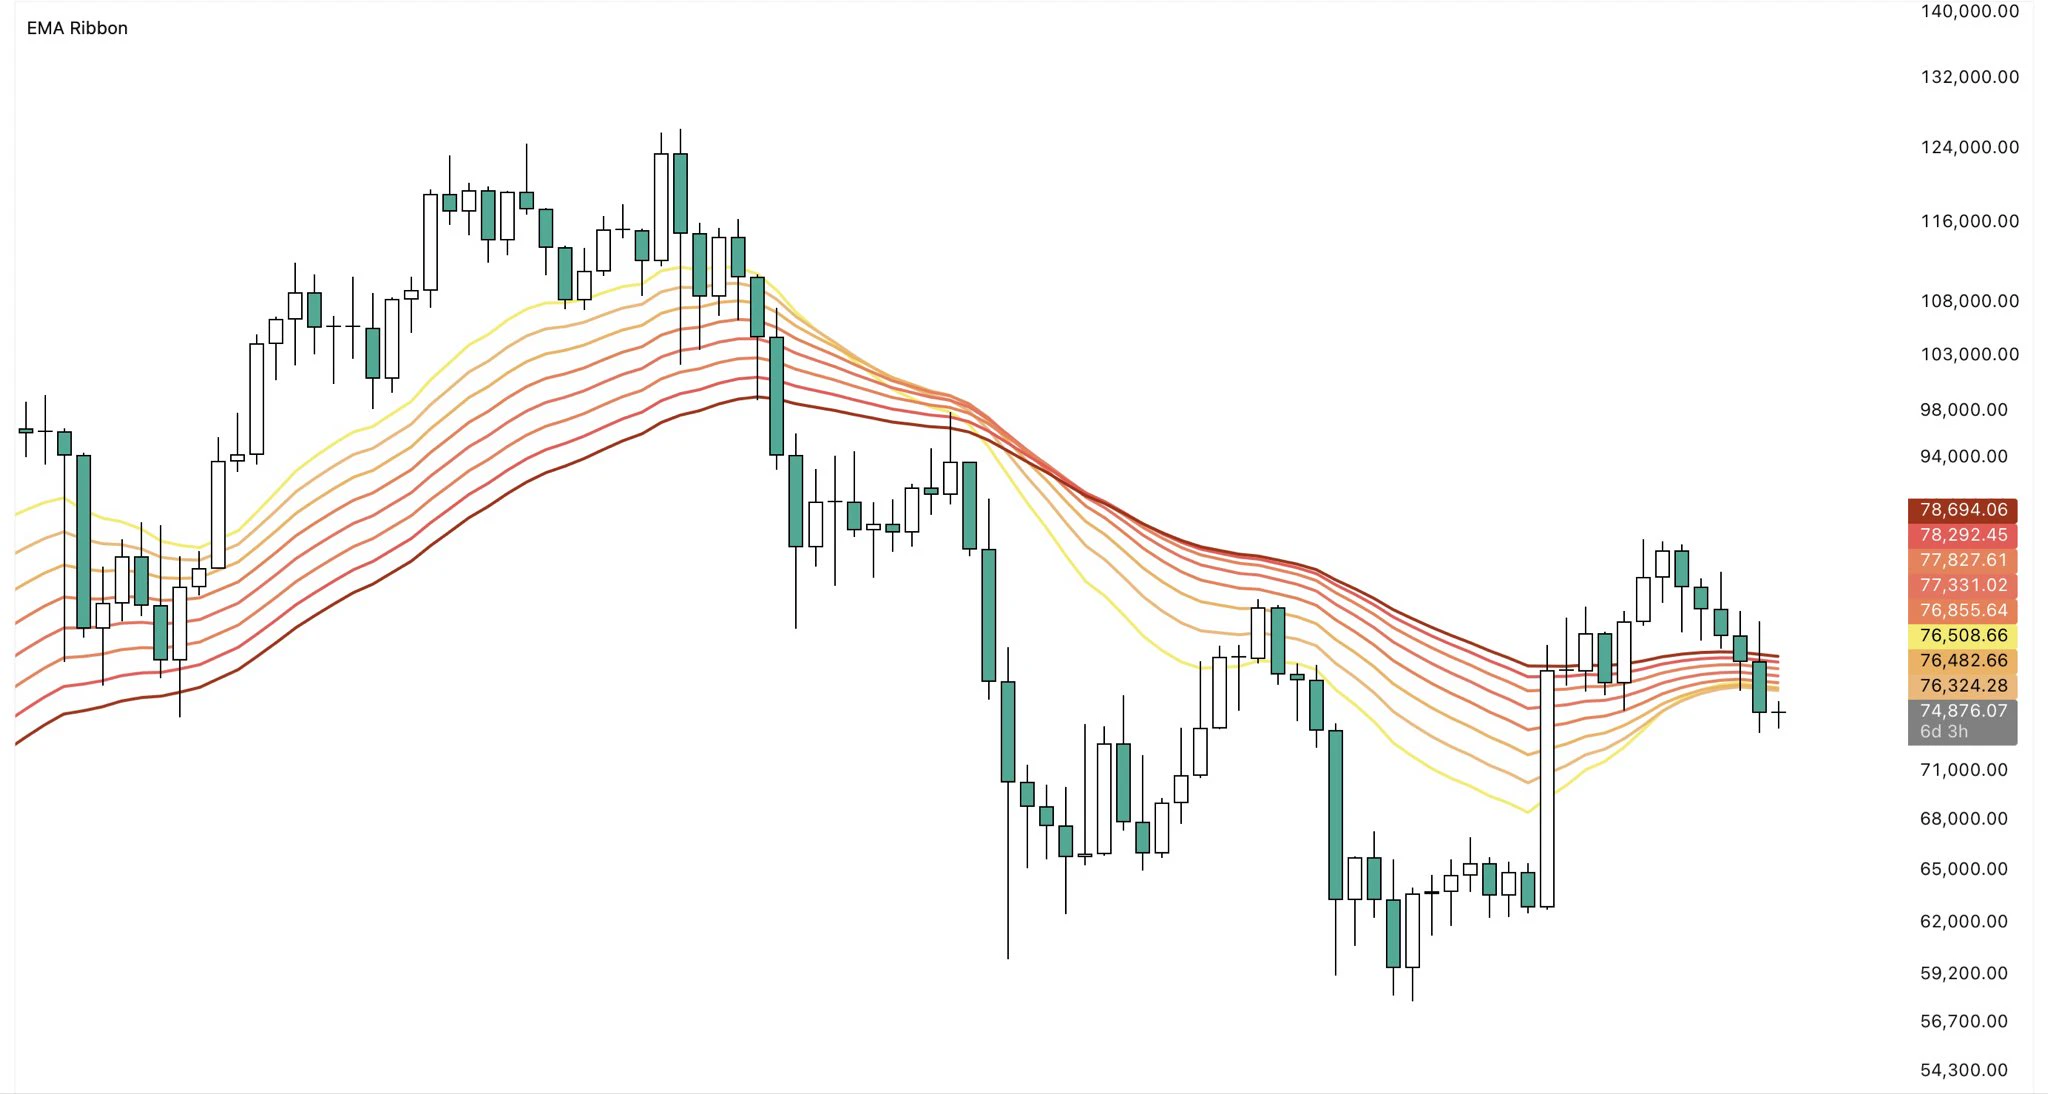
$BTC Price has lost the EMA ribbon.

The longer price remains below it, the worse this looks for BTC.

Ideally, we want to see a quick reclaim of $76k followed by a move back above the ribbon.

Otherwise, the ribbon could start acting as resistance and put further pressure on price.

For now, reclaiming it would be one of the first signs that buyers are starting to regain control.
post-image
BTC-0.67%
BTC Today's Outlook | Range-bound during the day; sell high and buy low within 74,500–76,000!

BTC is currently trading around 75,000. The rebound after the sharp drop to 73,333 has not yet formed a clear reversal. For today, trade based on the range and don't bet on a one-way move in advance.

Today's trading plan:

Go long at 74,500–74,800, stop-loss below 74,200, targets 75,200 and 75,500.

Short at 75,700–76,000, stop-loss above 76,300, targets 75,200 and 74,800.

If the price doesn't enter the planned range, don't chase rallies or sell-offs.

U.S. CPI will be released at 21:30 tonight, an
post-image
BTC-0.65%
ETH-1.23%
#TrenchesDualChainPK

TRENCHES DUAL-CHAIN PK CONTEST: BASE VS ROBINHOOD FOR 30,000 USDT

🏁 THE CHALLENGE BEGINS

Imagine opening your crypto app, seeing two different blockchain ecosystems competing for attention, and having to decide which one deserves your support. One side represents Base, while the other represents Robinhood. Both enter the spotlight, but this time, the competition comes with something bigger than ordinary community discussions.

The Trenches Dual-Chain PK Contest brings these two ecosystems into a competition for a combined prize pool of 30,000 USDT. It creates an oppor
HOOD-0.69%
ETH-1.26%
The three major U.S. stock indexes all rose last night, with the S&P 500 up 2.3%, the Nasdaq up 2.7%, and the Dow Jones up 2.2%. The S&P 500 also posted its strongest single-day performance in seven months. Based on their usual correlation, a rebound in risk appetite of this magnitude should have prompted some reaction from crypto, but in reality, $BTC is currently stuck around 74900, up just 1.5% from this cycle's low; Ethereum, meanwhile, is hovering around 2120 and is actually down 1.3% on the day. Traditional and crypto markets are clearly going their separate ways this time.

First, let'
post-image
BTC-0.67%
The morning strategy identified 4146-4155 as a potential pullback zone. Price fell as expected to 4120, successfully capturing 26 points!$XAU ‌
XAU+0.38%
#GateSquareCommentChallenge

GATE SQUARE COMMENT CHALLENGE: CAN YOUR FIRST COMMENT EARN YOU A SHARE OF 20,000 USDT?

💬 THE FIRST QUESTION: CAN ONE COMMENT MAKE A DIFFERENCE?

Have you ever opened a post, noticed an interesting discussion, and wanted to be the first person to share your thoughts? On Gate Square, being early in the conversation could bring an additional opportunity.

The Gate Square Comment Challenge introduces first-comment rewards, giving participants a chance to earn from a weekly prize pool of 20,000 USDT. This makes commenting more than just a way to express an opinion. I
post-image
Oil prices have dropped below $85 following Representative Thomas Massie's filing of articles of impeachment against U.S. Secretary of Defense Pete Hegseth.
It is noted that Mr. Hegseth has been overseeing the conflict with Iran, and market analysts interpret the move to remove him as a potential indication that the United States may intensify efforts to End the war and restore access to the Strait of Hormuz.

#oil #crypto #cryptotrading #altcoins #cryptocurrency
  • 1
$MU For Micron’s move down from $1,114 to $650, the Fibonacci 0.236, 0.382, 0.5, and 0.618 levels are $759, $827, $882, and $936, respectively.

So, I plan to take profit on my long position between $827 and $882. $936 may be reached, but I don’t want to take that risk.
MU-0.63%
[NEW STREAMER] market update
live-cover
LIVE2,323
Load More

Join 40 M users in our growing community

⚡️ Join 40 M users in the crypto craze discussion

💬 Engage with your favorite top creators

👍 See what interests you

Trending Topics

USCPIDataIncoming

48.32k Views2.16k Discussing

The U.S. October CPI report will be released on November 10 at 8:30 a.m. ET. September CPI came in at 3.7% year over year, and markets will be watching closely for signs that inflation is cooling, especially in core CPI. A softer-than-expected reading could strengthen rate-cut expectations, while hotter inflation may pressure risk assets through higher Treasury yields and a stronger dollar. How do you think this CPI print will move $BTC, U.S. stocks and gold?

USIranTalksShowNewProgress

5.03k Views1.23k Discussing

KoreanStocksJumpOver5%

569 Views4.81k Discussing

View More