


Share your thoughts
placeholder
Article
Why did Zcash go private? Because it didn't want anyone to see its massive pump.
---
$ZEC
$SPCX
post-image
ZEC+8.55%
SPCX-3.84%
  • 1
Tired of the compliance chaos? 🏦 Anver Yoffe, ex-eToro Regtech head, just launched an AI startup aimed at tackling the $3 trillion compliance crisis. Could this reshape the financial landscape? 💡 $CLHEAR #Fintech
$BULLA Long】1H momentum expansion + order book imbalance
$BULLA 1H RSI 79.25, MACD histogram +0.0014, bullish momentum released. 4H MACD histogram -0.0005 is contracting, with limited bearish pressure. Order book imbalance 22.33%, Bid/Ask 1.58, with clear buy-side support. After breaking above the 4H upper band at 0.0874, volatility expanded significantly.
🎯Direction: Long
⚡Entry/limit order: 0.09308889 - 0.09336900
🛑Stop-loss: 0.08870055
🚀Target 1: 0.10037167
🚀Target 2: 0.10387301
🛡️Trade management:
- Execution strategy: After reaching Target 1, reduce the position by 50% and move the
post-image
BULLA+20.60%
BTC-0.21%
ETH-0.61%
SOL-0.56%
#晒出我的持仓收益 Stop pretending, will you? Hurry up and get on.
post-image
Nobody is warning you about $PONS /USDT while the 15m RSI sinks below 33 and the daily trend stalls in a range.

$PONS /USDT - SHORT

Trade Plan:
Entry: N/A – N/A
SL: N/A
TP1: N/A
TP2: N/A
TP3: N/A

Why this setup?
Why now? The 15m RSI at 32.8 shows the short-term momentum is exhausted and leaning bearish, which is the first clue that a continuation might be forming. The 1h ATR is not available, so the real edge comes from the daily range acting as a compression zone where $PONS /USDT is being trapped between indecision and a potential breakdown. The 4h higher-timeframe trend labeled range
PONS-22.58%
🔥 YOUNAS TRADER LIVE | BTC, ETH & Altcoins 🚀 | Market Update
live-cover
LIVE594
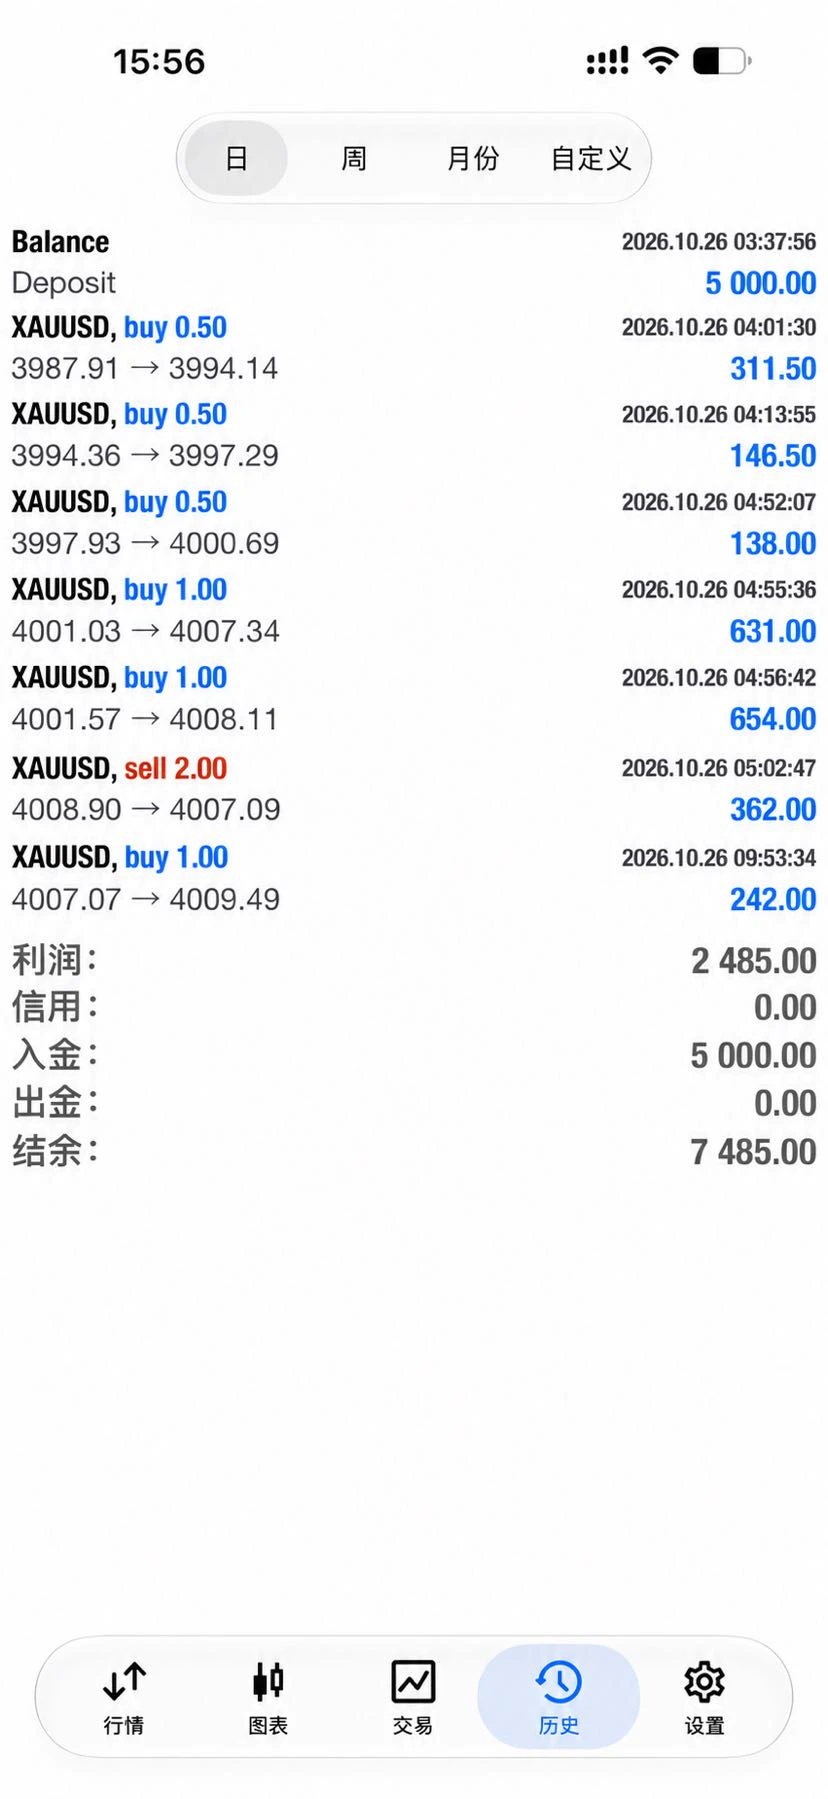
Gold-Mining Diary Day 1
Today's profit was 65u; yesterday's profit was 44.6u.
Principal: 100u. I've only been trading for a few days, so I don't know if this is the newbie protection period.
#xauusd
BTC Strategy and Trading Recommendations

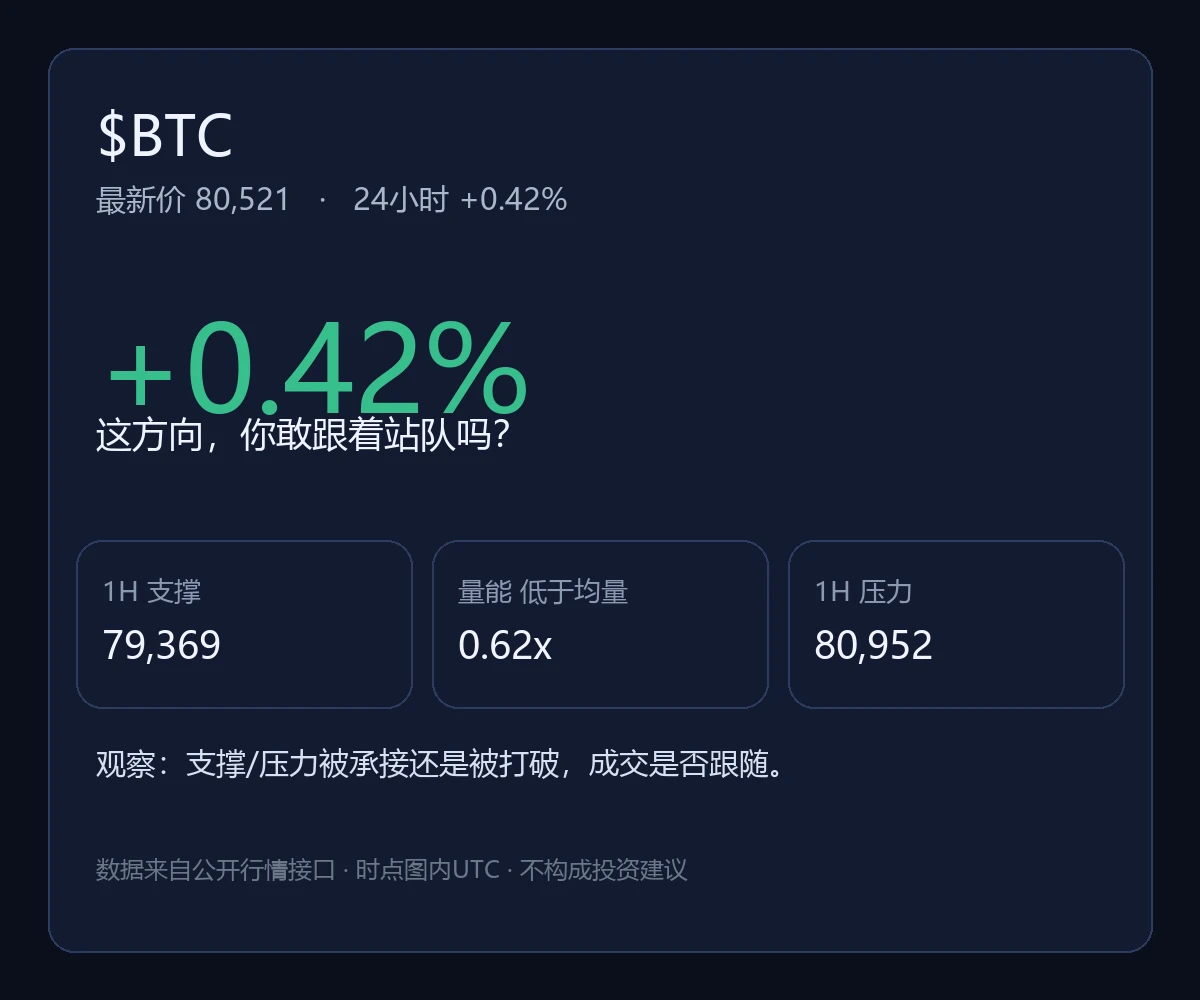
Current price: 78534. The market has moved sideways within a narrow range over the past 24 hours. Market sentiment indicators show that bears have the upper hand, but the price has not seen a deep decline, indicating consolidation within a high-level range.

On the four-hour chart, the market remains range-bound, with the price stabilizing above key support and the Bollinger Bands moving sideways; the MACD is flattening as the lines converge, momentum between bulls and bears is balanced, and the RSI is in the neutral zone. The current bias is merely
post-image
BTC-0.26%
$SOL Signal】Short continuation + 1H momentum bearish
$SOL 1H MACD histogram -0.0749, RSI sits at 48.25, buy-side ratio 0.40, while sell orders continue to exert pressure. 4H Bollinger Band lower band 102.07 and upper band 106.07; price is sliding below the middle band. Order book depth imbalance is 6.66%; the best bid is slightly thicker but cannot withstand continuous selling pressure. Funding rate is -0.0057%, with no resistance from longs.
🎯Direction: Short
⚡Entry/Limit order: 103.2094 - 103.5200
🛑Stop-loss: 104.5552
🚀Target 1: 101.9672
🚀Target 2: 101.1908
🛡️Trade management:
- Execut
post-image
SOL-0.60%
🚨 BREAKING: The U.S. Treasury just bought back $12.5 BILLION of its own debt, bringing total buybacks this month to $25 BILLION.
post-image
[Treasury Department Shells Out $6 Billion to Prop Up the Market, Market: Not Enough to Matter]
The U.S. Treasury stepped in last night, announcing plans to buy back up to $6 billion in long-term Treasuries to rein in borrowing costs that have been soaring.
The result? The market did not even blink—Treasuries kept falling after the announcement. The 10-year yield had just hit a new high since 2023 last week, and the $6 billion poured in did not even make a ripple.
Put bluntly, it is like bailing water from a leaking dam with a ladle. The action is real, and so is the resolve, but the hole is b
post-image
SNDK+0.84%
I was just about to go to the forum and rant, but then I saw my balance and thought, forget it—the market is always right. A few days ago, before bed, I was still watching $SNDK grind along. I really had no confidence at the time, thinking I might end up waiting in vain again.
But when I opened the charts this morning, it had already surged on its own, without giving me even a moment to hesitate. Why did I dare to enter early? It was forming a base without breaking down, trading volume kept shrinking during the pullback, and it was obvious that funds were quietly entering at the bottom.
Now th
post-image
SNDK+0.84%
SOL-0.60%
XRP-1.26%
Insiders are calling this the most obvious long setup on $USELESS /USDT that nobody is talking about yet.

$USELESS /USDT - LONG

Trade Plan:
Entry: 0.24869 – 0.25821
SL: 0.20775
TP1: 0.28773
TP2: 0.31058
TP3: 0.34486

Why this setup?
Why now? The daily trend is already bullish, the 1h price sits exactly at the entry reference of 0.25345, the 15m RSI is at 26.8 showing extreme oversold pressure, and the 1h ATR of 0.019043 quantifies the volatile expansion that justifies the entry zone between 0.24869 and 0.25821. That means the market has enough fuel to push toward TP1 at 0.28773 and then T
USELESS-6.77%
I walked the jungle hike to Playa Las Ánimas. Mexico.
Everyone down on 50%+ on the hat.
We still up over 20X
🤣🤣
The repricing will be aggressive with capitulation and general trench pullback.
The hat strategy goes 9 figures.
post-image
$IOST Signal】Go long + short squeeze in the 1H RSI overbought zone
$IOST 1H RSI 90.53, funding rate -1.12%, and short liquidation pressure continues to build. The price is hugging the upper Bollinger Band, while the 4H MACD shows bullish expansion. Sell orders are slightly heavier in the order book, OI is flat, and the price is making new highs without an increase in open positions, indicating this rally is driven by short covering. Chasing longs around the current price of 0.00195 offers an average risk-reward ratio. Momentum has not yet been exhausted; the key point is whether 0.001947-0.
post-image
IOST+123.11%
Gn legends 🌃
Rest well
See you all tomorrow 💤
post-image
##SpaceX总市值重回2万亿美元 SpaceX Returns to $2 Trillion: The Tug-of-War Between Faith and Reality
On September 8, 2026, SpaceX's share price rose 3.65% to $153.35, bringing its total market capitalization back to $2.02 trillion, a new high since July 7. After nearly two months of volatility, the space giant has reclaimed the $2 trillion mark.
Supporting this market capitalization is the capital market's continued bet on three narratives. Starlink is the foundation—as of June 2026, SpaceX had launched more than 12,318 satellites in total, contributing over two-thirds of the company's revenue. Starship
post-image
SPCX-3.84%
BTC UPDATES
live-cover
LIVE1,699
Calling all my Apple nerds
Are the new iPhone 18s worth it?
post-image
Load More

Join 40 M users in our growing community

⚡️ Join 40 M users in the crypto craze discussion

💬 Engage with your favorite top creators

👍 See what interests you

View More