


Share your thoughts
placeholder
Article
9.7 Coco's midday Silk Road payoff: 4423→4381, target reached, pocketed 42 points of profit 🍐! Friends at the source have already taken 🥩 #黄金
GLDX-0.43%
PAXG-0.51%
I just hit refresh, and it shot straight up, as if I had startled it. The $ETH order I placed before bed a few days ago—I had planned to hold it as long as it didn't break down—ended up completing its mission at the bottom, sending me straight into profit with one candle.

The pullback held, and buyers were quietly accumulating. The judgment was spot-on. The entry price was around 1883.20; checking again just now, the current price has already reached 2492.88, with the position's return hitting +5630.28%.

It only counts as profit once it's in the bag; floating gains are just numbers. Take p
post-image
ETH+0.60%
ZEC+0.58%
SNDK+0.03%
LTC rose from 50 to nearly 60 after two days of positioning, surging 20%. Did anyone regret not buying more as soon as it took off? #Gate上线打金狗限时免Gas费
LTC+7.36%
You don't always 3 signs in just one picture
4.44 eth
3.69 weth
and 55
It's all meant to happen
444
369
55
Send QUOTRONS a lot higher 🚀
$QUOTRON
@Quotrons404
post-image
ETH+0.59%
but it could 20x
post-image
Find the one North Star goal and build relevant moats around the core.
If something does not align with your core goal, you should not do it.
post-image
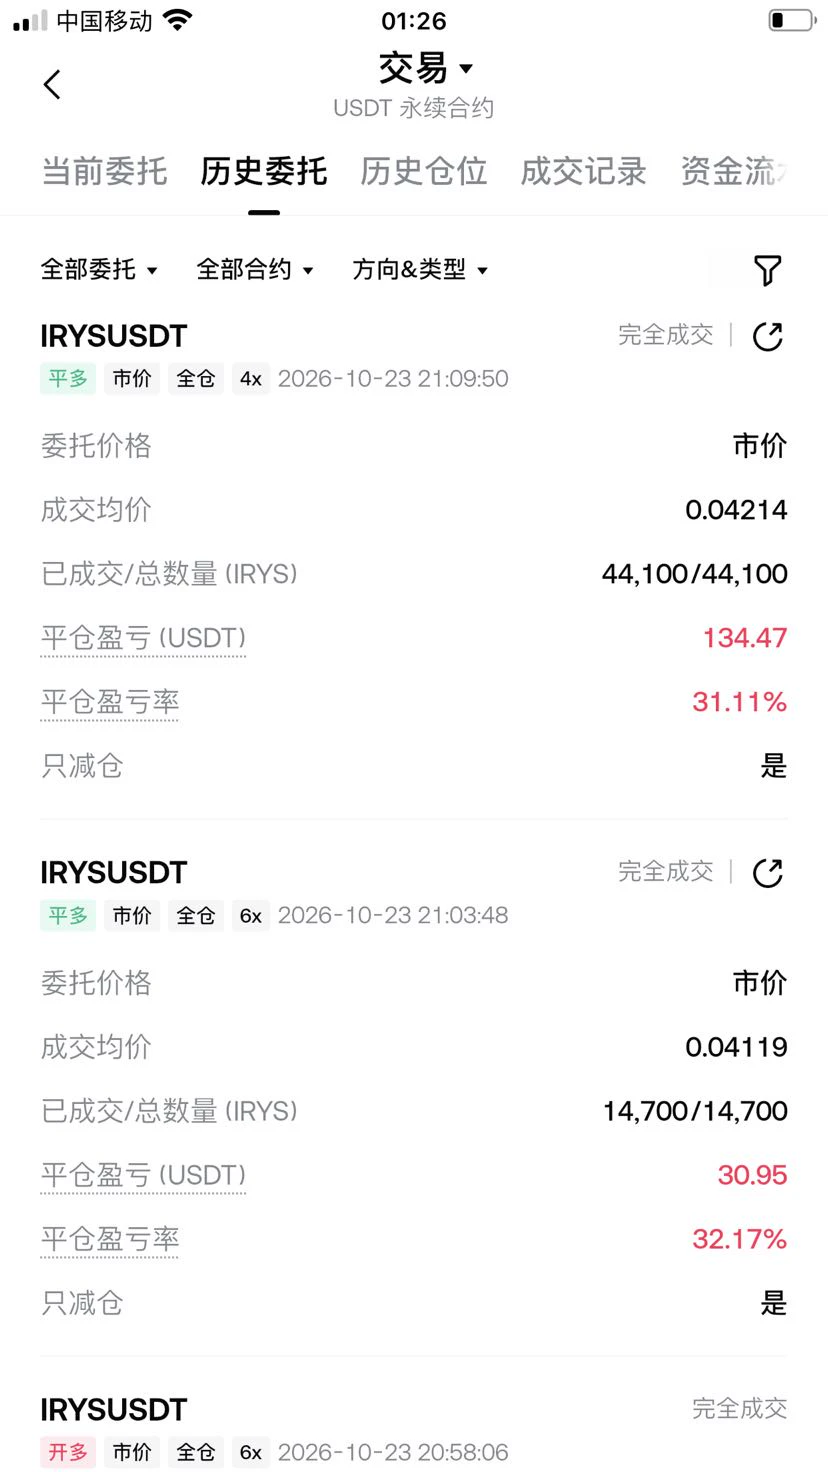
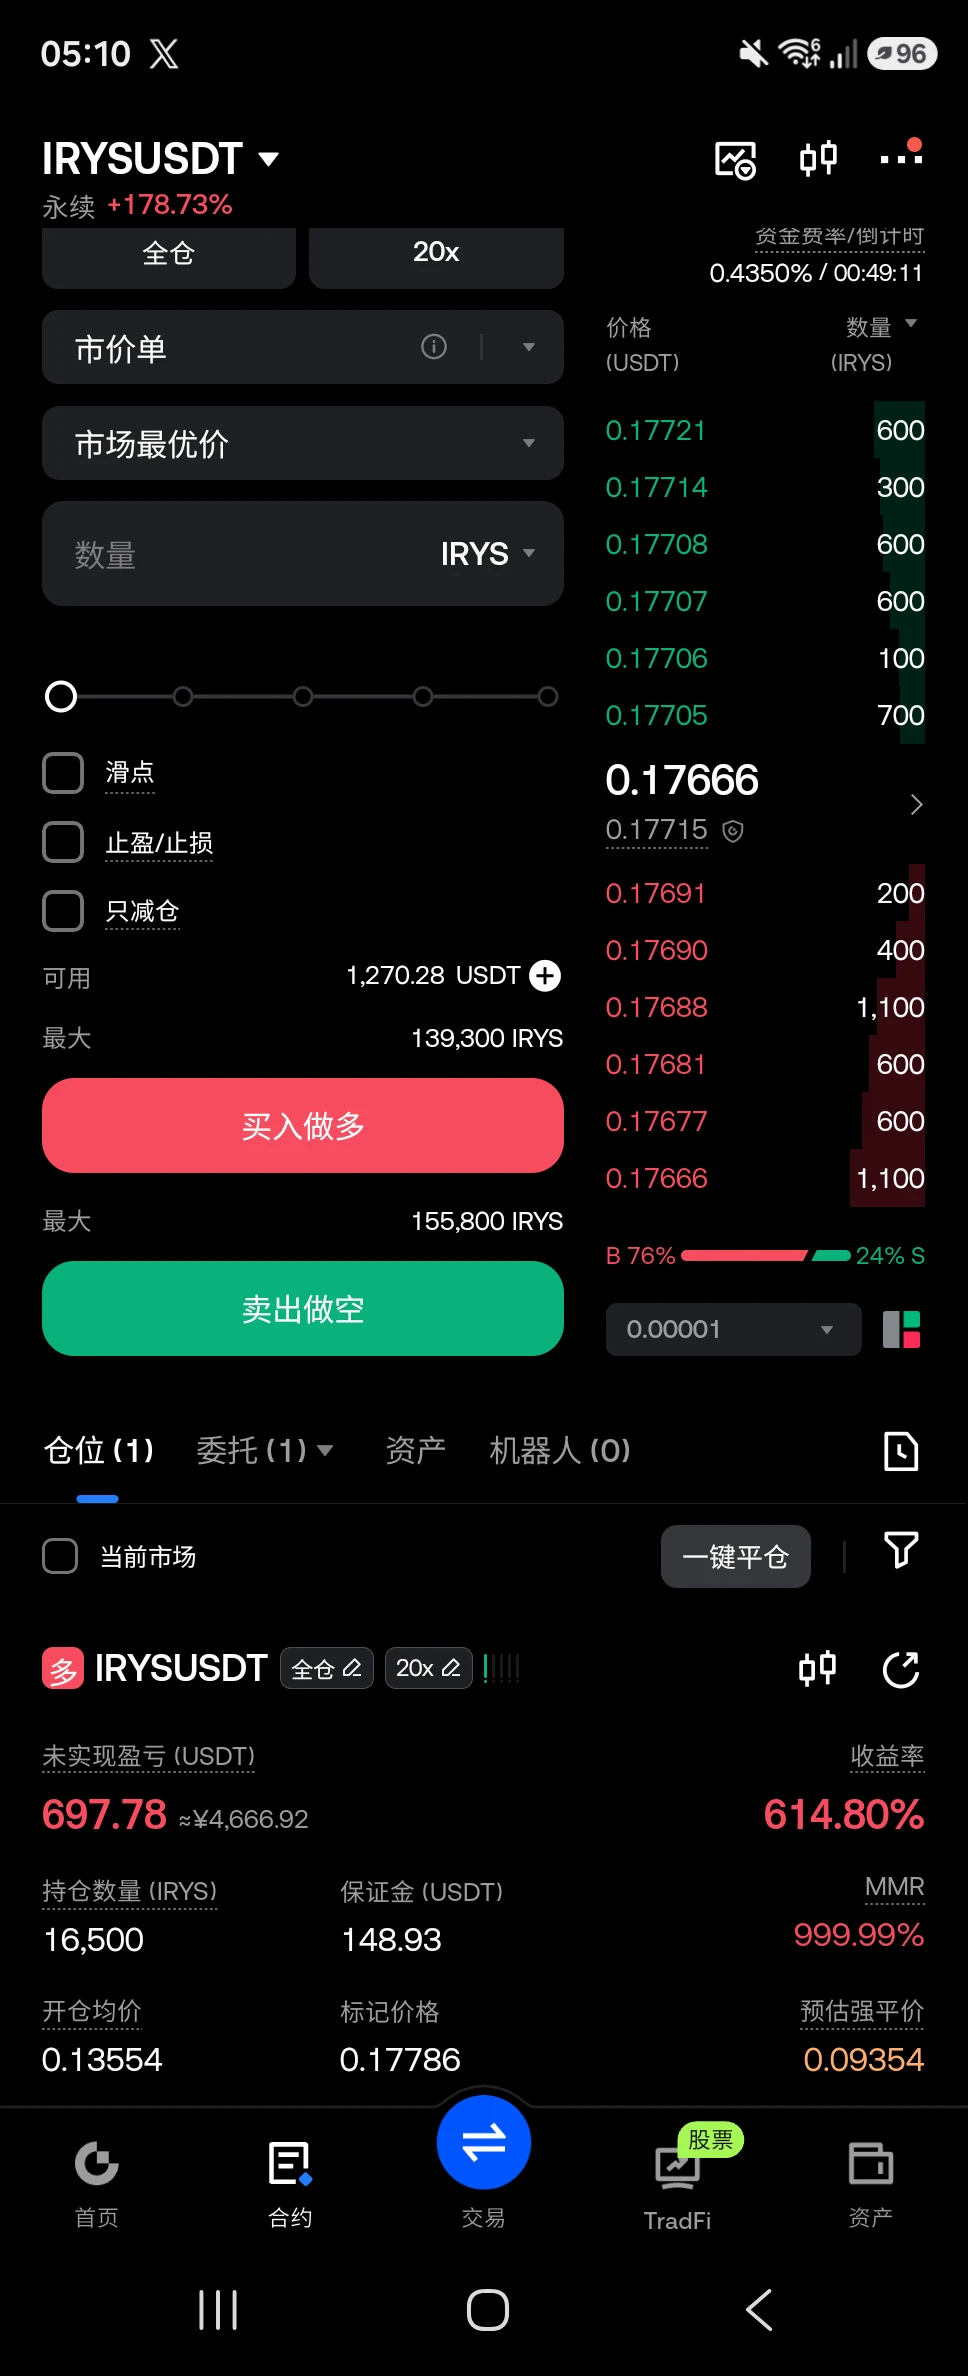
This was purely the market being in a good mood and casually scattering some gold coins—one just happened to hit me on the head. A few days ago, the last thing I saw before bed was heavy selling pressure and low trading volume, clearly unable to hold. I placed a short at 0.008967, and when I woke up, the current price was 0.008708, with +57.96% securely locked in. This market really came through. I closed 70% of the position first, moved the stop-loss on the remaining 30% to the entry price, and let it keep flying. For trades you’re not confident in, taking a look keeps you clear-headed; buyin
post-image
ZEC+0.58%
LAB-3.38%
A free mining project recommended by a friend—just enter your address and email to start mining
No wallet connection required; old addresses get a 3x points bonus
No cost required—just click once a day
Any address that has interacted with the BNB ecosystem can participate
It’s free anyway, so hopefully it brings some good karma
BNB-0.62%
Nobody is talking about the LINK setup hiding in plain sight right now.

$LINK /USDT - LONG

Trade Plan:
Entry: 13.204 – 13.322
SL: 12.696
TP1: 13.688
TP2: 13.972
TP3: 14.397

Why this setup?
Why now? The daily trend is bullish, the 1h ATR is 0.236231, the 15m RSI sits at 46.48, and the entry zone holds between 13.204 and 13.322 around the 1h price of 13.263. The ATR tells you the average hourly move, so a sweep of 13.204 is a normal intraday dip, not a breakdown. The 15m RSI at 46.48 means the bounce is neither exhausted nor overheated, leaving room for the daily momentum to lift the 1h pr
LINK+8.15%
🚨 THIS IS NOT GOOD: THE THREE ROUTES THAT MOVE THE WORLD'S TRADE ARE ALL CONSTRAINED AT THE SAME TIME.
→ Strait of Hormuz: under Iranian blockade since February, ~20% of world oil and gas cut off
→ Red Sea/Suez: disrupted since late 2023 by Houthi attacks, carriers still routing around the Cape
→ Panama Canal: daily transits cut from 36 to 34 on Sept 3, then to 32 on Sept 15
Panama handles roughly 5% of world trade. Rainfall in its watershed is 34% below average.
Here's the part that makes it worse. Ships fleeing Hormuz rerouted through Panama, transits up 16% year over year through May. That
$BTC .D/weekly — Bear Flag at Resistance
❇️ #Bitcoin dominance has formed a textbook Bear Flag — and the flagpole high rejected perfectly at long-term resistance.
📊 Bear Flag structure complete
🔴 Rejection at multi-year resistance trendline
🎯 Breakdown = Altseason trigger
✍️ When BTC dominance breaks down from a Bear Flag at resistance, it signals capital rotation into alts. The setup is clean.
Altseason is one breakdown away 🚀
post-image
BTC-0.25%
With this price action, I don't even need to think—the account is dancing on its own.
During the repeated intraday swings, the rebound looked lively, but volume failed to follow. I kept my eye on the key level above $SKYAI ; it tried to break through several times but fell just short, which was a classic bull-trap signal. Without hesitation, I placed a short order and waited for the pullback.
When I checked the chart again after lunch, the price had already slid to 0.0577. With an entry cost of 0.21986, the +1808.29% gave me the answer directly. This profit feels great; those who were already o
post-image
SKYAI-1.83%
XRP-0.19%
DOGE+2.48%
How was I supposed to know this feature existed?
When placing trades, I like to find coins from the gainers and losers lists. Every time I want to return to the top, I have to keep swiping the screen.
Today, I happened to double-tap the word “Futures,” and it took me straight back to the top.
I’ve been using it for so long, and I only just discovered this hidden feature. 😂
$SPCX
SPCX is currently trading around the $0.00205 area, making this a very interesting but highly speculative market structure. With such a small market valuation and limited trading activity, SPCX can experience sharp percentage moves even from relatively small changes in buying or selling pressure. This is exactly why I am focusing on confirmation from momentum, volume, and trend indicators rather than looking at price movement alone.
Current Market Structure
The current price is approximately $0.00205. The most important level for the immediate structure is the $0.00200 psychological s
post-image
SPCX-1.19%
Only a 95% confidence score separates $LAB /USDT from a violent breakdown.

$LAB /USDT - SHORT

Trade Plan:
Entry: 0.07000 – 0.07032
SL: 0.07172
TP1: 0.06899
TP2: 0.06821
TP3: 0.06704

Why this setup?
Why now? The 4h trend is bearish and the 1h price is sitting at 0.07016, which also marks the entry_ref for this setup. The 15m RSI reads 40.62, signaling weakening momentum before a possible sharp move lower. The 1h ATR of 0.000649 tells us the average hourly range, so a break below 0.07000 could easily target TP1 at 0.06899 and then TP2 at 0.06821. The daily trend reinforces the short bias,
LAB-3.38%
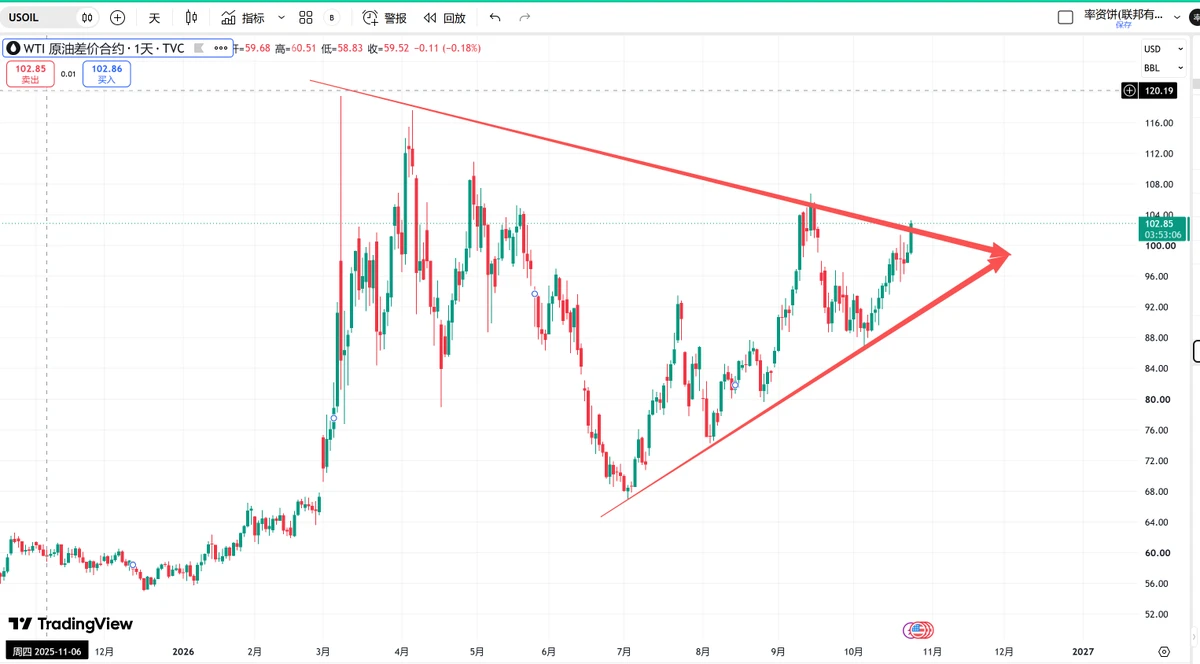
BTC, Gold, and Crude Oil Analysis
live-cover
LIVE2,484
🚀 $DOGE Descending Wedge Breakout: Price breaks out of a multi-month wedge structure, targeting $0.2180
#DOGE #Dogecoin #Altcoins #Crypto
post-image
DOGE+2.46%
#AltcoinOISurpassesBitcoinforFirstTimeinOveraYear
ALTCOIN OI SURPASSES BITCOIN A MAJOR DERIVATIVES MARKET SHIFT
The crypto derivatives market has just delivered one of the strongest signals of changing trader positioning in more than a year: total altcoin perpetual-futures open interest has moved above Bitcoin’s for the first time since December 2024. The crossover is based on Coinalyze data and shows that a larger share of outstanding leveraged positions is now concentrated across altcoins rather than BTC.
WHY THIS UPDATE MATTERS
Open interest represents the total value of derivative contra
post-image
Jiaa_Insights
#AltcoinOISurpassesBitcoinforFirstTimeinOveraYear ALTCOIN OI SURPASSES BITCOIN A MAJOR DERIVATIVES MARKET SHIFT
The crypto derivatives market has just delivered one of the strongest signals of changing trader positioning in more than a year: total altcoin perpetual-futures open interest has moved above Bitcoin’s for the first time since December 2024. The crossover is based on Coinalyze data and shows that a larger share of outstanding leveraged positions is now concentrated across altcoins rather than BTC.
WHY THIS UPDATE MATTERS
Open interest represents the total value of derivative contracts that remain open and unsettled. When altcoin OI moves above Bitcoin OI, it does not automatically mean that every altcoin is bullish. Instead, it tells us that traders are becoming increasingly active and willing to deploy leverage outside Bitcoin.
This is a major change in market structure.
For months, Bitcoin remained the primary center of derivatives positioning. Now traders are rotating more aggressively toward the broader altcoin market, suggesting that risk appetite is expanding beyond BTC.
The timing is also important because the combined market capitalization of altcoins outside the top 10 has moved above $200 billion and has risen more than 10% since the beginning of September. That means this rotation is happening alongside an increase in spot-market capitalization rather than being purely a futures phenomenon.
ALTCOIN SEASON OR LEVERAGE TRAP?
This is where I would be careful.
The first interpretation is bullish: capital and trader attention are moving deeper into the altcoin market, creating the conditions for stronger relative performance across selected altcoins.
But the second interpretation is equally important: higher OI means higher leverage.
If too many traders become positioned in the same direction, even a relatively normal correction can trigger liquidations. Those liquidations can then force additional positions to close, creating a much larger move than the original price change.
So rising altcoin OI is both a bullish participation signal and a volatility warning.
BTC VS ALTCOINS
Bitcoin is still trading around the $80K region, but the derivatives structure is changing underneath the market.
This creates an interesting setup.
If BTC remains stable while altcoin OI continues expanding, traders may continue searching for higher-beta opportunities in Ethereum, Solana, Zcash, DeFi tokens and other large or mid-cap assets.
If BTC breaks higher at the same time, the combination could become even stronger because rising BTC liquidity can create a broader risk-on environment.
However, if BTC suddenly loses major support while altcoin leverage remains elevated, altcoins could experience significantly larger percentage declines than Bitcoin.
That is why the next BTC move is still extremely important for the entire altcoin market.
ZEC IS A PERFECT EXAMPLE
Zcash provides one of the clearest examples of what this rotation can look like.
ZEC open interest reached approximately $2.4 billion, while its price pushed through $1,000 and short liquidations reached roughly $34 million.
This shows both sides of the current market.
When momentum accelerates, high OI can fuel a powerful short squeeze.
But if sentiment suddenly reverses, that same leverage can become fuel for a long-liquidation cascade.
The lesson is simple: high OI can amplify both directions.
WHAT I AM WATCHING NEXT
The most important confirmation now is whether altcoin OI continues rising while spot market capitalization also expands.
If both increase together, the move would suggest genuine market participation rather than leverage alone.
If OI rises rapidly while spot prices and market capitalization stop advancing, the setup becomes much more dangerous because derivatives exposure would be growing faster than underlying demand.
I would therefore monitor three things closely:
1. Altcoin OI
Continued expansion would show that traders are maintaining strong interest in altcoin derivatives.
2. Altcoin spot market capitalization
Continued growth above the $200B area would provide stronger confirmation that the rotation is not purely leverage-driven.
3. BTC stability
Bitcoin holding the $80K region would give altcoins more room to continue outperforming. A sharp BTC breakdown could quickly change the entire risk environment.
BULLISH SCENARIO
If Bitcoin remains stable or moves higher while altcoin market capitalization continues expanding and OI grows in a controlled manner, the current rotation could develop into a much broader altcoin rally.
In that scenario, traders may continue moving down the risk curve:
BTC → ETH → large-cap altcoins → mid-cap altcoins
The strongest projects with improving liquidity, volume and momentum would likely attract the greatest attention.
A sustained decline in Bitcoin dominance would add another confirmation signal for this rotation.
BEARISH SCENARIO
The biggest risk is excessive leverage.
If altcoin OI continues increasing rapidly while prices become overextended, the market could become vulnerable to a sharp liquidation event.
The previous December 2024 episode is worth remembering: the last time altcoin OI exceeded Bitcoin's, several mid-cap altcoins later experienced significant corrections even while Bitcoin remained comparatively stable.
That does not mean the same pattern must repeat now, but it demonstrates why this indicator should not be interpreted as a guaranteed buy signal.
MY MARKET VIEW
For me, this update is bullish for altcoin participation but cautious for leverage risk.
The fact that altcoin OI has overtaken Bitcoin after more than a year is a major structural development. It suggests traders are becoming increasingly interested in opportunities beyond BTC.
The additional confirmation is that altcoin market capitalization outside the top 10 has already moved above $200 billion and gained more than 10% since the start of September.
That makes the current environment much more interesting than a simple derivatives-driven pump.
But I would not call it a guaranteed altseason yet.
For me, the confirmation will come when:
Altcoin OI ↑
Spot market cap ↑
Trading volume ↑
BTC remains stable or bullish
BTC dominance continues weakening
If those conditions remain aligned, the probability of sustained altcoin outperformance increases.
FINAL TAKE
The most important message from today's data is not simply that altcoins have more open interest than Bitcoin.
The bigger message is that risk appetite is moving deeper into the crypto market.
Traders are no longer concentrating their derivatives exposure primarily around Bitcoin. They are increasingly willing to take leveraged positions across altcoins.
That can become the foundation for a powerful altcoin expansion.
But it can also create a much more fragile market.
More OI = more opportunity.
More OI = more leverage.
More leverage = bigger moves in both directions.
So my strategy would be to watch OI + volume + spot market capitalization + BTC structure together, rather than treating the OI crossover alone as a buy signal.
The next few sessions could reveal whether this is the beginning of a sustained altcoin rotation or simply a leverage-driven expansion that eventually produces a sharp correction.
ALTCOIN OI > BITCOIN OI
ALTCOIN MARKET CAP: ABOVE $200B
SEPTEMBER ALTCOIN MARKET CAP GROWTH: 10%+
KEY SIGNAL: CAPITAL AND LEVERAGE ARE ROTATING TOWARD ALTCOINS
KEY RISK: LIQUIDATION CASCADES
The market is clearly changing. Now the question is whether altcoins can turn this derivatives dominance into sustained spot-market strength.
BTC-0.28%
ETH+0.60%
SOL-0.52%
ZEC+0.58%
  • 2
Load More

Join 40 M users in our growing community

⚡️ Join 40 M users in the crypto craze discussion

💬 Engage with your favorite top creators

👍 See what interests you

View More