Square
Following
Hot
News
Profile
Share your thoughts
placeholder
Article
Gm legends ☀️
Saturday = no trading. just our preset levels and some fresh air.
Market will always be here, your health won’t.
Enjoy your weekend 🤝
post-image
$LSK #LSK
Breaking Falling Wedge.
Successful retest could trigger 50-55% rise during short term✍️
LSK+1.34%
  • 1
Trenches
AGT
A
bade
b
AGT
0x5d...e274
Market Cap
$.
Change
.
24h Vol
$.
Holders
.
CNPY
C
bade
b
CNPY
0xc6...ddd2
Market Cap
$.
Change
.
24h Vol
$.
Holders
.
FOLIO
F
bade
b
FOLIO
0x5f...e411
Market Cap
$.
Change
.
24h Vol
$.
Holders
.
FTR
F
bade
b
FTR
DFMt...pump
Market Cap
$.
Change
.
24h Vol
$.
Holders
.
DOPE
D
bade
b
DOPE
0xf9...8899
Market Cap
$.
Change
.
24h Vol
$.
Holders
.
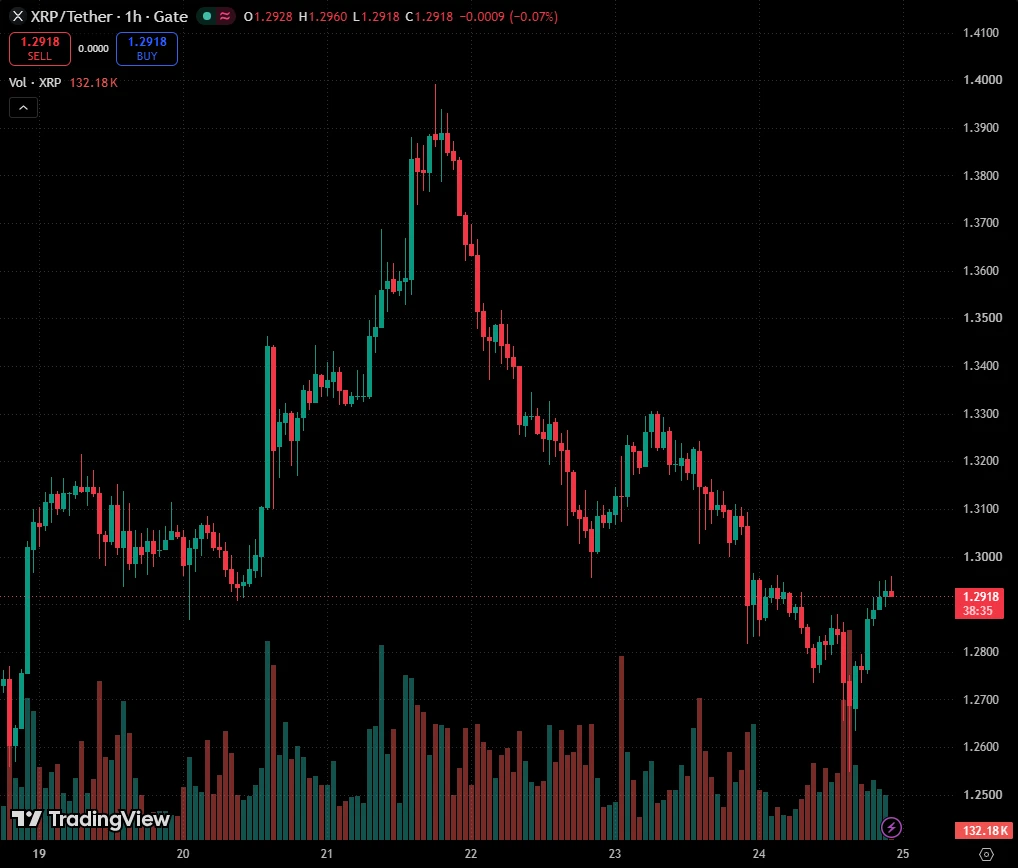
$XRP Strongly bullish: If buyers regain control, a rebound from the 1.28 support zone could drive the price back up to 1.35–1.42. Long $XRP Entry: 1.3000–1.3100 Stop-loss: 1.2700 Take-profit 1: 1.3300 Take-profit 2: 1.3500 Take-profit 3: 1.3800 Take-profit 4: 1.4200 Trade here $XRP : 👇
post-image
XRP-3.05%
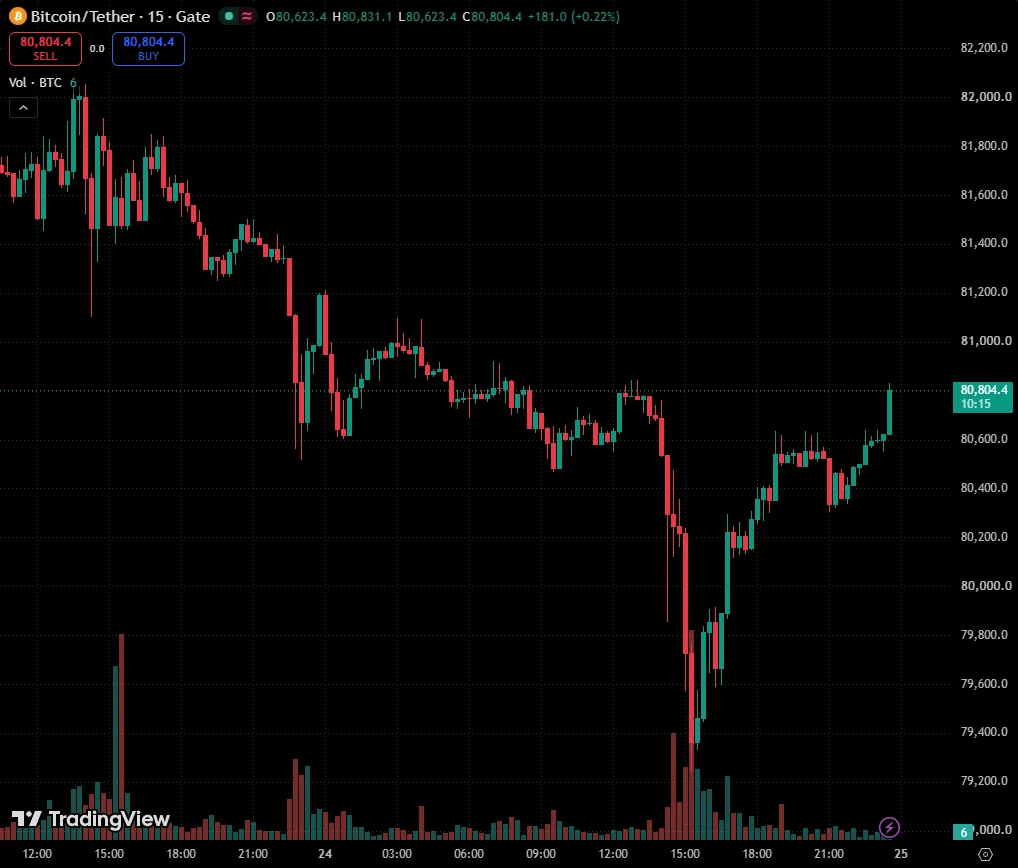
BTC had already wicked above 80,000 on October 9, and continued to wick above 80,000 afterward. The only time it was above 79,000 was also a wick into the gap near 80,000. This means the 79,500–80,200 area has already been tested and completely filled. The wick on the 15th completed the sweep of stop-loss orders and liquidity below, after which price rebounded. We can therefore consider this logic fairly reliable. However, the 82,000–83,300 daily-chart support-resistance flip zone remains a major resistance area. We can still treat 82,000 as the primary target, then assess how price responds t
post-image
BTC-1.00%
ETH-1.79%
The Media Maze
$NYT ‌
The New York Times (NYT) is currently caught in a tug-of-war between its recent recovery and immediate selling pressure. After a sharp decline in late September, the stock mounted a respectable comeback, but it is now facing a critical pullback. With the price hovering at $67.77, traders are asking a crucial question: Is this a healthy retracement before the next leg up, or is the rebound losing steam?
📊 K-Line (Candlestick) Analysis
1. Daily Chart (Macro Context)
· Trend: The daily chart (Image 1) shows a V-shaped recovery from the late September lows near $58.78**. Th
NYT-1.69%
$ZEC I watched it drop all the way from 1253.76 to 1131.85 without selling a single unit—not bad.
The current price is 1170.45, sitting at 37% of the 24-hour range.
Over two days, it first fell 9.7%, then climbed back 4.6%, and then went sideways.
The 20-hour moving average at 1156.81 is just 1.2% below, so at least that level held.
But the upside is still unfinished business: the 24h high of 1235.85 is 5.6% above the current price.
There’s only 3.3% down to 1131.85.
5.6 versus 3.3—that’s an upside-to-downside ratio of 1.69:1.
I don’t take trades below 2:1 (I call that “not losing is winning”
post-image
ZEC-5.32%
BTC is stuck at 81,700, exactly at the cost basis for ETF institutions. The 20-month moving average at 87,165 is overhead, and every step of the rebound faces selling from investors looking to break even. ETH has fallen below 2,400, with its 4-hour moving averages fully bearishly aligned; weakness remains unchanged. The Altcoin Season Index is at 61, making it look imminent, but 20 of 26 categories are falling, and over 80% of altcoins remain below their 200-day moving averages. Only localized rotation is underway in AI names like NEAR.
Major coins are bottoming while altcoins diverge—structur
AAPL+0.43%
TSLA-2.17%
NVDA-1.42%
MU-5.66%
  • 3
BTC (1H) Bitcoin is consolidating near $81.5K while holding its ascending trendline support.
A bounce could target $81.8K–$82.2K, while losing $81K risks another move toward $80.6K.
post-image
BTC-0.95%
Watching $LTC
struggle around these moving averages is like watching someone in dress shoes try to climb an oiled ladder. It just keeps sliding back down. Maybe stop expecting a miraculous breakout today. Take profit: 56.82 Stop loss: 61.67 Notable: $ZEC : Current price 1,180.76 - 24-hour change: -4.61%$AGT : Current price 0.074511 - 24-hour change: +90.96%
post-image
AGT+90.54%
The most unusual detail in today's market is that the MACD histogram for $FET
has turned positive (+0.0001087), while the price remains below MA20=0.196435, capped by MA5=0.19496, and is down 5.05% over 24h. The divergence between the indicators and price suggests this is a rebound rather than a reversal, leaving very little room for error when going long. The amplitude across 30 candlesticks is about 8.03%, indicating high volatility. Position size should be reduced to less than half the usual amount, and stop-losses on individual trades must be executed mechanically; do not hold on to losin
post-image
ARB-7.04%
Ethereum's rebound also precisely hit the predicted resistance at 2490. After surging to 2493, the price began to pull back.
Our first target of 2400 was reached as expected, with the price dipping as low as 2392 and delivering a 100-point move. Entry and exit levels matched expectations perfectly; the rebound and pullback were all under control…#特斯拉Roadster带火Meme币 $ETH ‌
ETH-1.79%
#AGT
Is there any law left? I got liquidated down to just $16.
post-image
AGT+90.54%
🔥TRX has run out of steam! Everyone who chased the highs is now left holding the bag!
TRX surged to $0.34 today before losing steam, with a 24h change of +0% and steady volume. The bulls have fired their last shot, and everyone getting in now is a potential bagholder. Nine out of ten traders chasing the highs are carrying bags for market makers; the rest are here to pay tuition. Charging in at this level isn’t bravery—it’s having money to burn.
1. Event: TRX failed to break through its 24h high of $0.34 and retreated after the surge, with bullish momentum completely exhausted. Stalling at the
post-image
TRX+0.41%
$CL LONG SETUP — NEXT TARGET 101.28
Entry: 98.40 – 98.90 TP1: 99.50 TP2: 100.30 Next Price: 101.28 Extended Target: 102.30 SL: 97.70
$CL is maintaining a bullish structure on the 1H chart, with higher highs and higher lows. After a strong rally, price is consolidating near 98.83, suggesting buyers are defending recent gains. Holding above 98.40 could support another move toward 100.30 and 101.28. A sustained breakdown below 97.70 would invalidate the bullish setup.
post-image
CL+3.43%
  • 2
  • 2
BTC Update
live-cover
LIVE1,625
[New Sreamer] Whales Moves in Sync!
live-cover
LIVE1,585
#USMemoryStocksExtendLosses
#ShareWeekly
Memory chip stocks are in a sharp drawdown, and the selloff has now stretched across several sessions. Micron (MU), SanDisk (SNDK), Western Digital (WDC) and Seagate (STX) have all been sliding, but the damage is not evenly spread. Micron has fallen roughly 14% over the five sessions through October 14, even though it is still up about 97% over six months and about 191% year to date. That gap between recent weakness and the long-term run is the core of the debate right now. Below I walk through what is driving the move, where the key levels sit, and h
$SIREN
This SIREN rally has me grinning from ear to ear🤭 Longs, don’t rush to sell—0.045 is just the appetizer; bigger gains are still ahead😏 If you’re not holding any, there’s still time to get in now. Don’t wait until it takes off to kick yourself🙃
post-image
SIREN+0.14%
$BTW I fucking go short and you take off, huh? Give me 2u, fuck you
post-image
BTW+30.10%
Today’s core assessment: ETH is currently in a post-decline consolidation and recovery phase, with a cautious-to-bearish short-term bias. The priority is to wait for signals to short a rebound, while keeping a breakout-long plan in reserve. Blindly chasing rallies or selling off at current levels is not recommended.
The latest market reports show ETH at approximately $2,413–$2,460 on October 17, with quote times varying by source; BTC is trading around $81,000. Whether ETH can regain and hold $2,450–$2,480 will be an important indicator of whether the short-term rebound can continue.
The follo
ETH-1.79%
BTC-0.96%
NAS100-2.28%
MSCI-1.02%
Load More

Join 40 M users in our growing community

⚡️ Join 40 M users in the crypto craze discussion

💬 Engage with your favorite top creators

👍 See what interests you

Trending Topics

USSeptemberPPIBeatsExpectations

91.35k Views1.92k Discussing

US September PPI came in at 6.3% YoY, well above the 5.3% market expectation, pointing to renewed producer-side inflation pressure. Weekly jobless claims were 199K, broadly in line with forecasts. Could hotter inflation further reduce room for rate cuts, and what does it mean for $BTC, US stocks, and gold?

GateWCTCS9GlobalTradingCompetition

37.87k Views6.62k Discussing

GateBTCAndETHFuturesVolumeRanksTop3

53.8k Views1.77k Discussing

View More