Square
Following
Hot
News
Notifications
Profile
Share your thoughts
placeholder
Article
#USNonfarmPayrolls #ShareWeekly
US Nonfarm Payrolls: The Economic Data That Could Shape Global Financial Markets
The U.S. Nonfarm Payrolls (NFP) report is one of the most influential economic indicators in the global financial system. Every month, investors, economists, financial institutions, and policymakers closely monitor employment data to understand the strength of the American economy and anticipate potential changes in monetary policy.
The importance of NFP extends far beyond the U.S. labor market. Its results can influence the U.S. dollar, gold, Treasury yields, stock indices, Bitcoin
#USAIStocksHitHard #ShareWeekly
AI Technology Stocks Hit Hard: A Detailed Breakdown of the Selloff and Its Ripple Effects
United States AI-related technology stocks have taken a severe beating in recent sessions. Shares of companies deeply tied to artificial intelligence infrastructure, chips, software, and data analytics have dropped sharply, wiping out hundreds of billions in market value in a single day and pressuring broader indexes. This is not a minor pullback. It reflects growing investor concerns about the pace of AI spending, data-center buildouts, valuations, and potential policy sh
Trenches
ZIG
Z
bade
b
ZIG
0x8c...1145
Market Cap
$.
Change
.
24h Vol
$.
Holders
.
STONK
S
bade
b
STONK
6GmA...UNgx
Market Cap
$.
Change
.
24h Vol
$.
Holders
.
IDOL
I
bade
b
IDOL
0x3b...ab07
Market Cap
$.
Change
.
24h Vol
$.
Holders
.
MAGGIE
M
bade
b
MAGGIE
8rHo...PmZV
Market Cap
$.
Change
.
24h Vol
$.
Holders
.
CLAUDIA
C
bade
b
CLAUDIA
2j5S...W2ZM
Market Cap
$.
Change
.
24h Vol
$.
Holders
.
I've been shorting ZEC since above 1600, and I'm still at it. Damn ZEC, keep shorting it for me $ZEC
ZEC+1.29%
#BTCETFOutflowsContinue
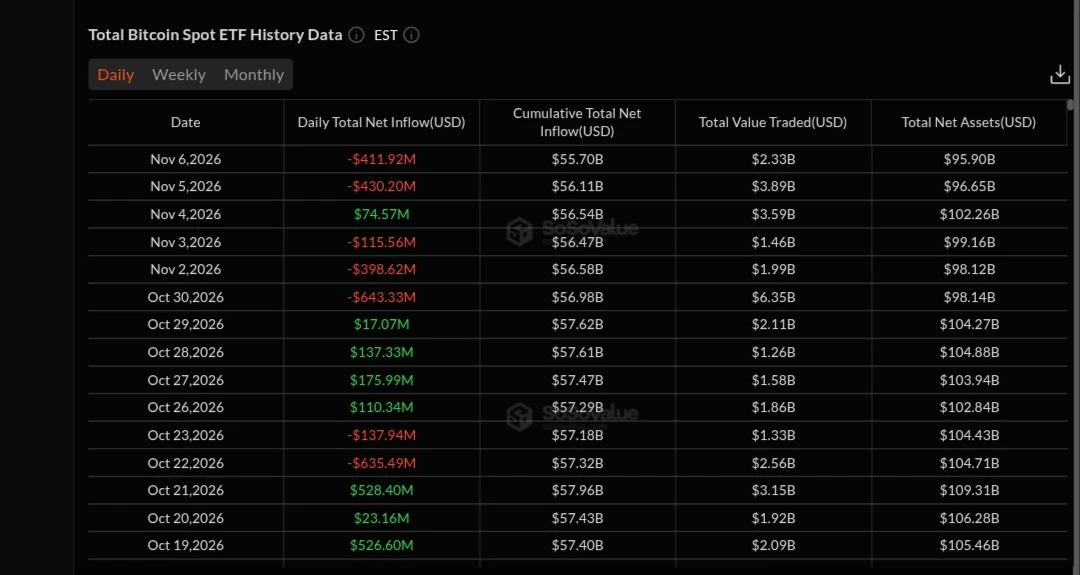
U.S. spot Bitcoin ETFs have experienced a notable shift in momentum, recording significant net outflows over the recent trading sessions. According to data from SoSoValue, daily net outflows exceeded $400 million on consecutive days heading into November 6, 2026, contributing to a substantial reduction in total net assets.
This trend raises key questions regarding institutional behavior. While Bitcoin's price has demonstrated resilience, holding above $75,000, the sustained exit from ETF products suggests a tactical rotation or temporary risk aversion rather than a str
post-image
BTC-0.31%
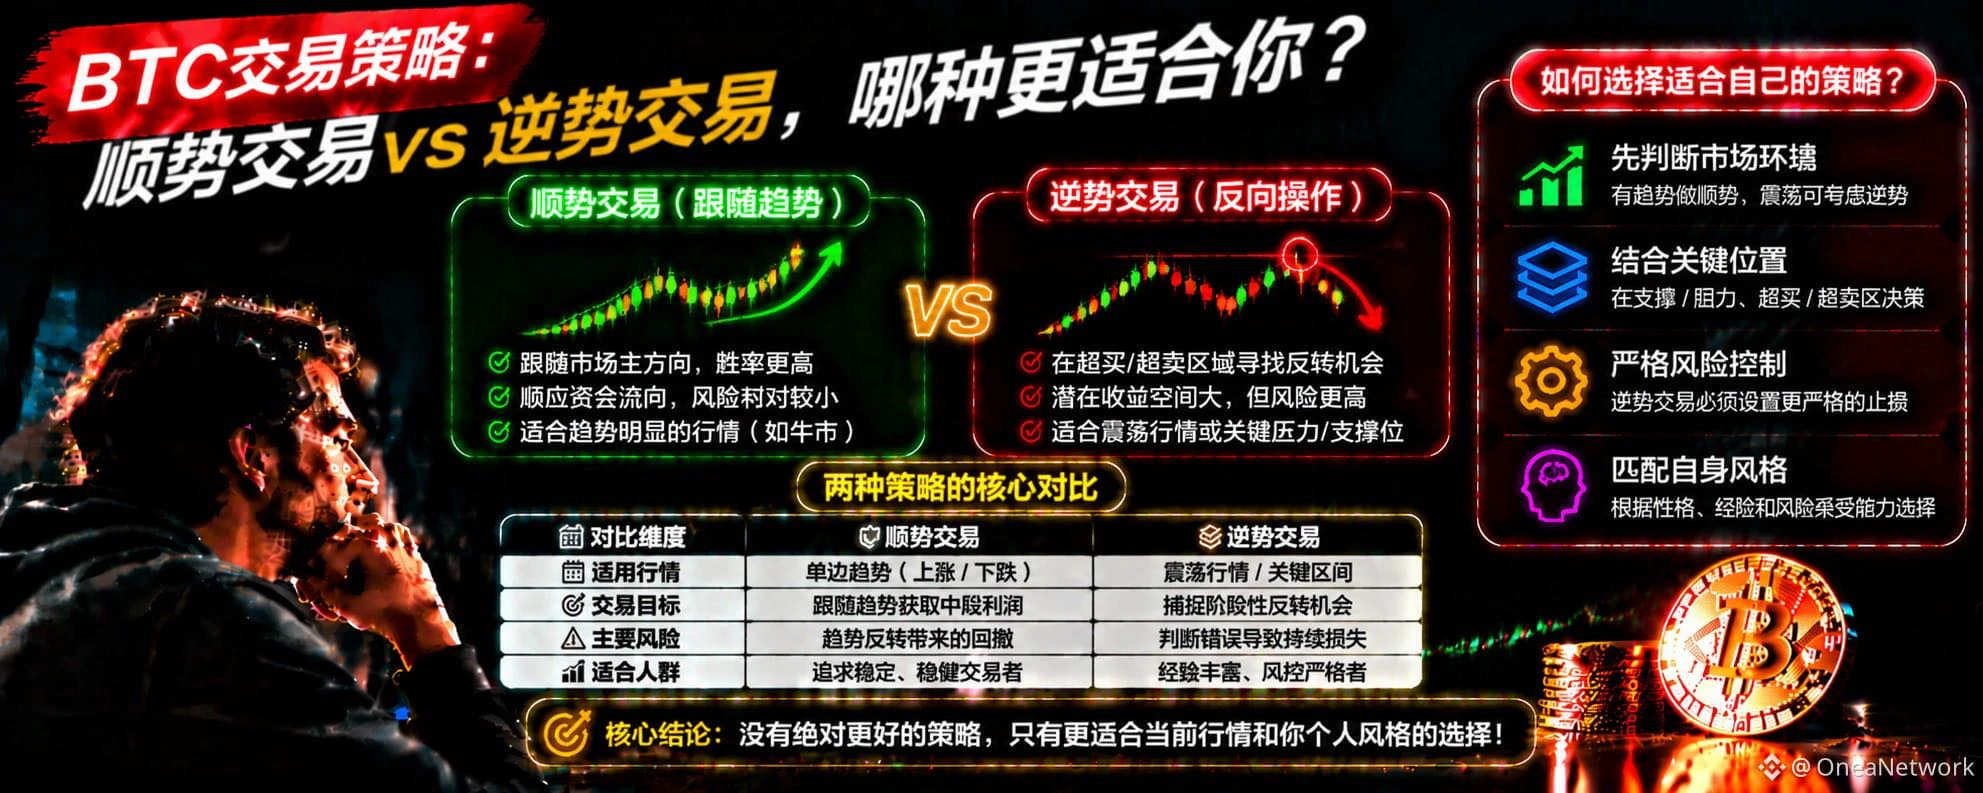
In BTC trading, which suits you better: trend-following or counter-trend trading?
There are two very common trading strategies in BTC trading: trend-following and counter-trend trading. Some people like to follow the market trend, looking for opportunities to go long when prices rise and to go short when they fall; others like to look for market reversals after prices have risen or fallen sharply. So, what exactly is the difference between these two approaches?
First, trend-following: follow the market’s main direction. The core of trend-following is identifying the current trend and looking f
post-image
BTC-0.67%
Who hates poor people the most in this world?
post-image
#Ahr999EntersBottomBuyingZone #Ahr999EntersBottomBuyingZone

The Bitcoin market is getting more attention as the AHR999 indicator enters the bottom buying zone. This indicator is followed by many Bitcoin investors because it can help them understand whether BTC may be trading at a relatively low price compared with its historical growth trend.

AHR999 is a Bitcoin market indicator that compares Bitcoin's current price with its historical price trends and long-term growth expectations.

When this indicator enters the bottom buying zone, some investors see it as a possible opportunity to accumul
BTC-0.67%
  • 2
#AI大跌后高盛仍看好数据中心 #WCTCS9 The AI data center train: every dip is an opportunity to get on board!

Wall Street has been arguing fiercely over the past two days.
Citadel’s Griffin said, “We can be almost certain that we’re in an AI bubble.”
But Giavarone, CIO of Federated Hermes, which manages hundreds of billions of dollars, said, “Fears of a bubble are premature—the current infrastructure buildout still has three or four years to go.”
State Street CEO O’Hanley shot back with a simple point: “These data centers aren’t being built blindly. They’re backed by real orders from real enterprise custome
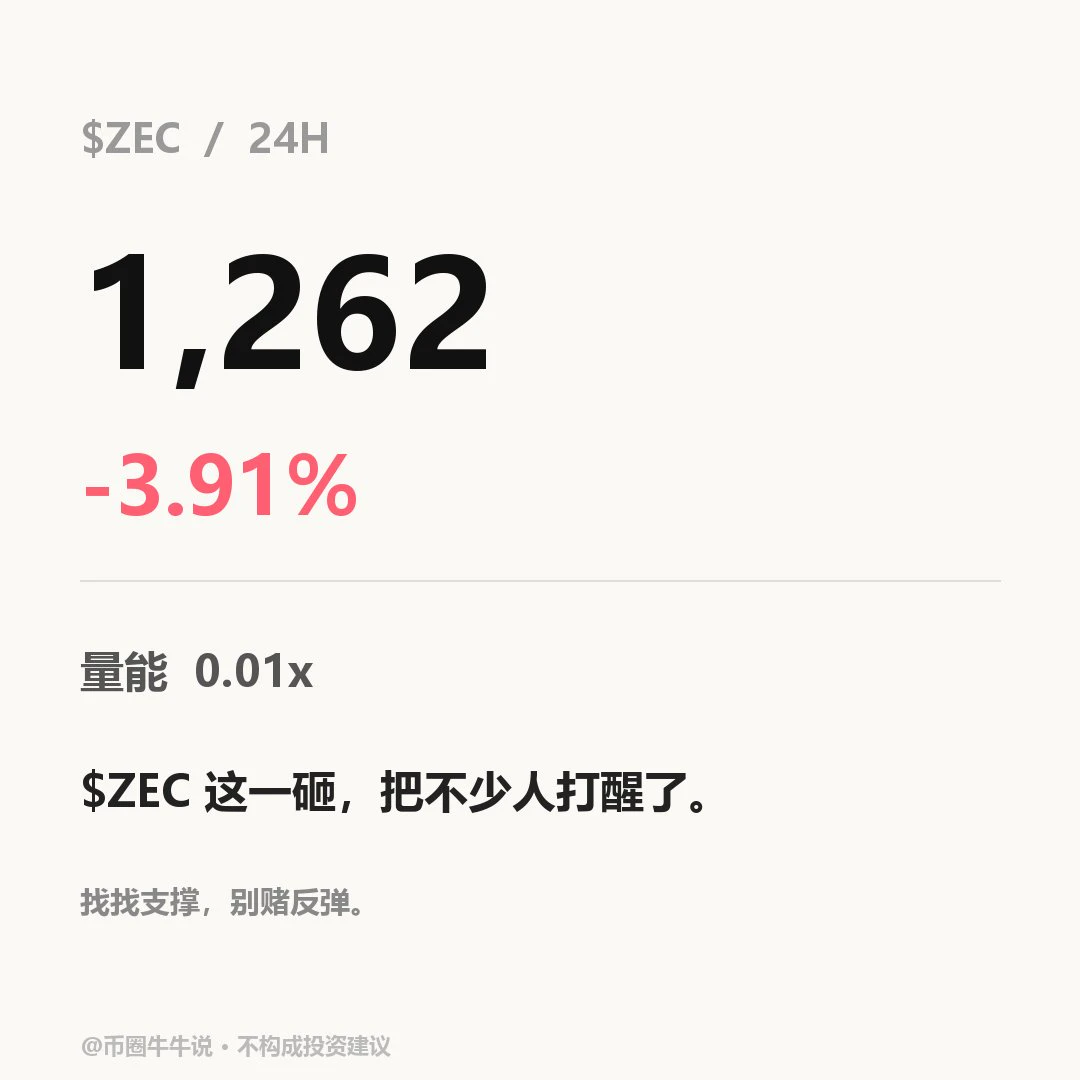
$ZEC Current price: 1262.29, 24H -3.91% (1235.00–1330.10). 1H is weak, with RSI at 50.03 and EMA20 at 1268.34; support at 1235.00/resistance at 1330.10. 4H is weak, with RSI at 45.93 and EMA20 at 1280.61; support at 1213.56/resistance at 1387.89. A move higher is only meaningful if price holds above the 1330.10 resistance level; a break below the 1235.00 support level would signal further weakness. Review whether price held above 1330.10 and reclaimed 1235.00 after losing it; volume is only 0.01x, so the move is invalid without confirmation from market participation. The market is volatile; fo
post-image
ZEC+1.16%
#70%山寨币跌破200日均线 70% is a high proportion, but still far from extreme oversold territory. For now, it looks more like the market is continuing to weaken; there is no clear sign that a reversal is near.
The proportion has rebounded quickly: At the beginning of October, only about 10% of altcoins were below this line, but it has since risen to 70%, showing that the decline came quickly.
Still far from extreme oversold territory: At the end of June, this proportion once reached about 84%. Some analysts believe that only a reading above 90% counts as an extreme oversold signal.
The drivers are macr
BTC-0.67%
ETH-1.26%
SOL-0.77%
USDC+0.01%
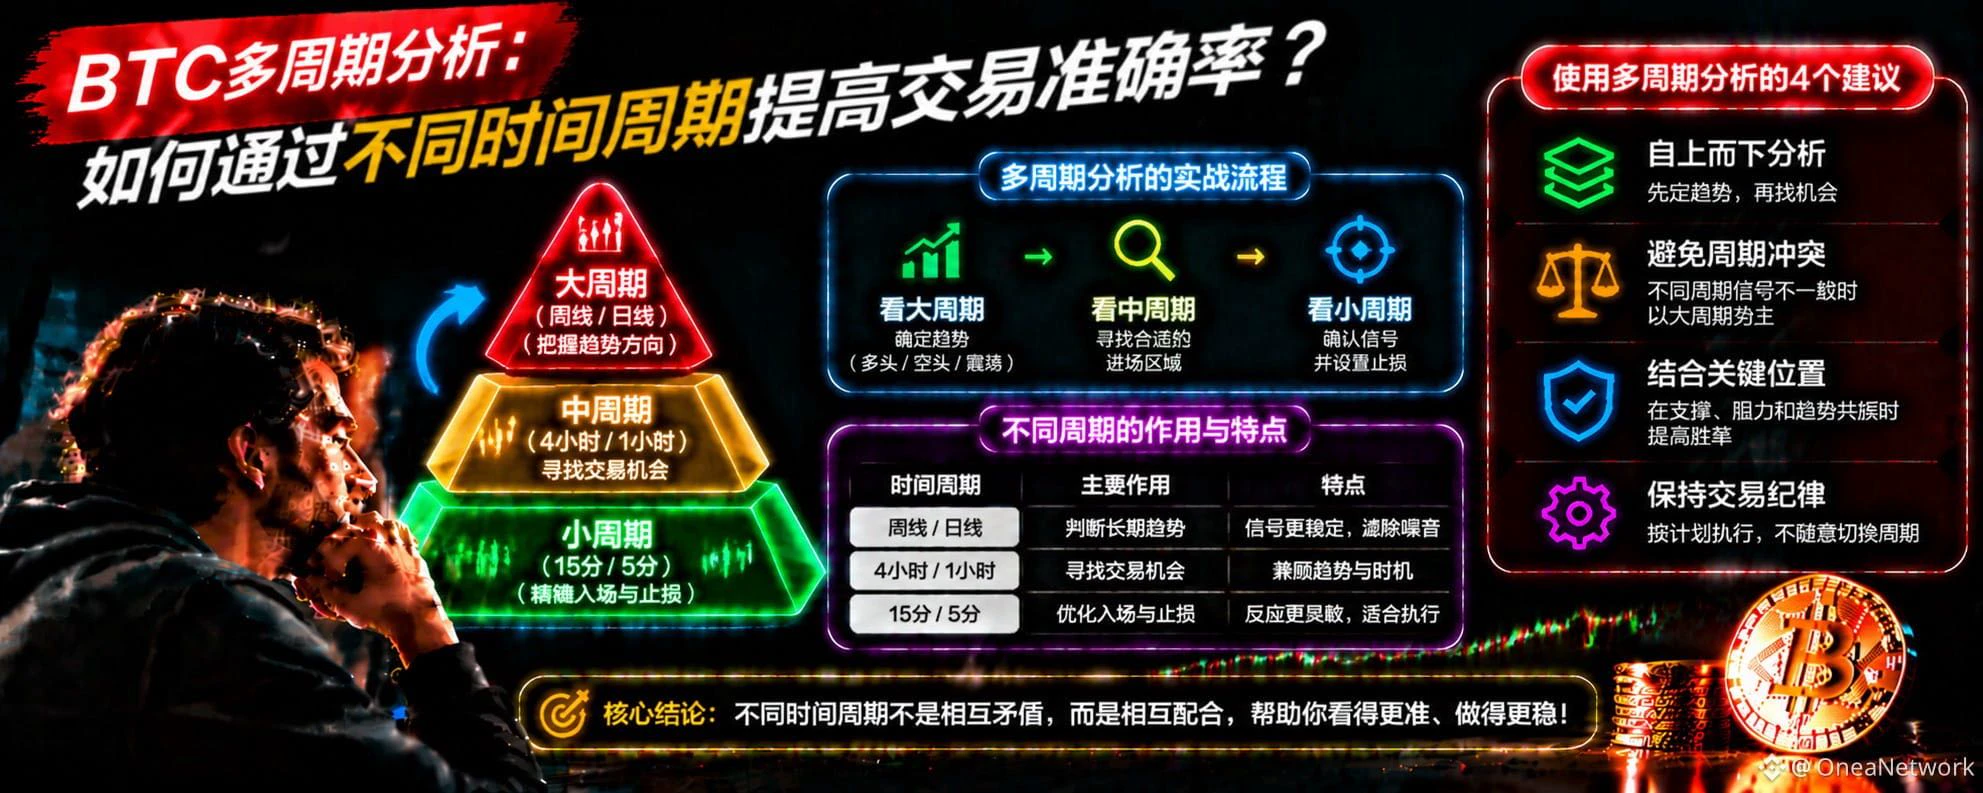
BTC Multi-Timeframe Analysis: How to Improve Trading Accuracy Across Different Timeframes?
In BTC trading, many people habitually watch 15-minute or even 5-minute candlesticks for buying and selling opportunities, but overlook an important point: short-term price fluctuations do not necessarily indicate the market’s true trend direction.
Why do some people correctly read the short-term trend but still end up losing money? One important reason is that they fail to make an overall assessment using different timeframes.
First, use higher timeframes to determine the trend. You can observe BTC’s ov
post-image
BTC-0.67%
#70%山寨币跌破200日均线 70% is a high proportion, but still far from extreme oversold territory. For now, it looks more like the market is continuing to weaken; there is no clear sign that a reversal is near.
The proportion has rebounded quickly: At the beginning of October, only about 10% of altcoins were below this line, but it has since risen to 70%, showing that the decline came quickly.
Still far from extreme oversold territory: At the end of June, this proportion once reached about 84%. Some analysts believe that only a reading above 90% counts as an extreme oversold signal.
The drivers are macr
USDC+0.01%
BTC-0.67%
ETH-1.26%
SOL-0.77%
  • 2
BTC has entered the dip-buying watch zone! Ahr999 drops to 0.43—are you brave enough to buy the dip this time?

Here’s a crypto multiple-choice question for today!
If BTC is hovering around $76k and Ahr999 has already fallen to 0.43, what would you do?
A: Buy right away—the opportunity won’t wait!
B: Dollar-cost average in batches and slowly build up a position.
C: Keep watching and wait for clearer market signals.
D: Sell my milk tea money first and get ready to buy the dip!🤣
This time, Ahr999’s drop below 0.45 has indeed drawn many investors’ attention back to Bitcoin’s valuation opportunit
MU+4.71%
  • 23
How to build a complete trading system for BTC trading? 5 key steps from analysis to execution!
In BTC trading, many people study the market every day, learn various technical indicators, and constantly look for new trading strategies. But why, after learning so much, can they still not keep their accounts stable? One important reason is the lack of a complete, repeatable trading system.
Truly effective trading should not rely on spur-of-the-moment judgment; it should follow clear rules.
First, build a market analysis framework. Before each trade, observe BTC’s higher-timeframe trend and asses
post-image
BTC-0.67%
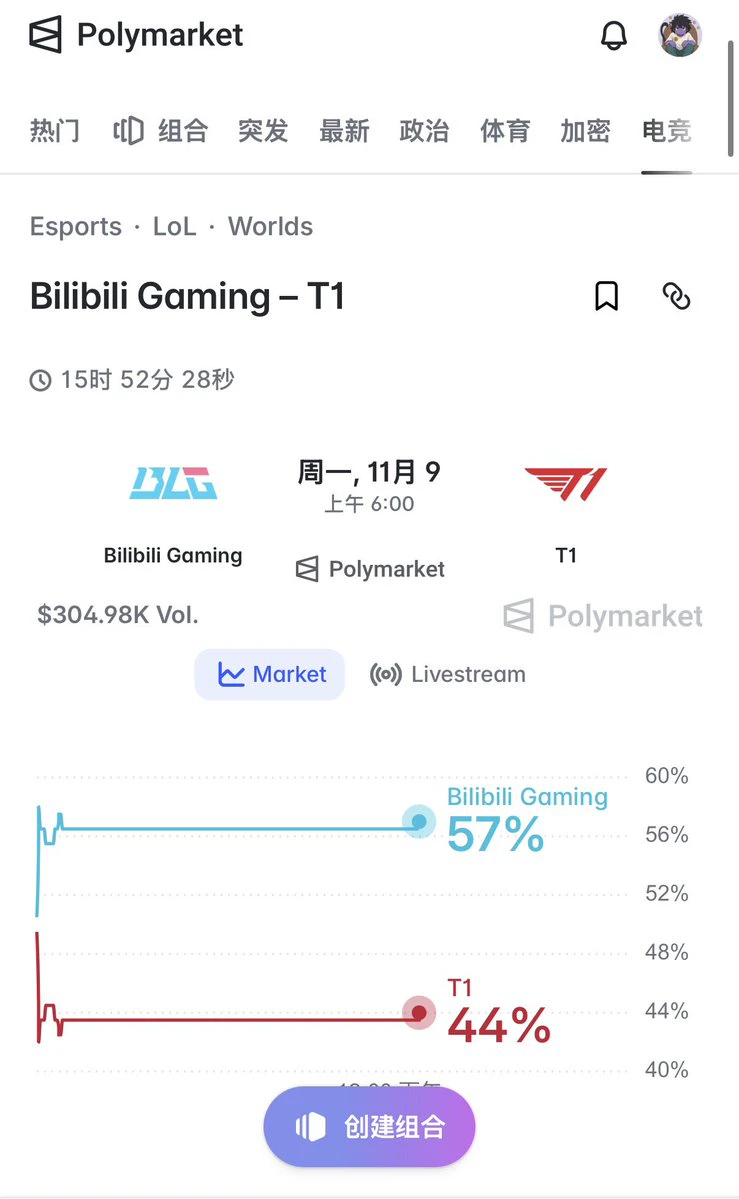
Currently, @polymarket is priced at 64-36
It should be using a CLOB
It definitely also references traditional bookmakers
and odds quoted directly by the bookmakers
or rather, professional market makers and arbitrageurs
use their own models
to reference odds from other betting markets and strip out the vig
while also arbitraging in the large pools
then place orders on poly
Considering T1's fan effect
and the already high expectations
the current true market odds are 73-27
If T1 can still blow BLG out even with Doran
that would truly be the darkest moment for the LPL😂
post-image
[NEW STREAMER]market update💕
live-cover
LIVE1,932
#Gate股票畅聊季 AI Market Collapse + Stagflation Looming: U.S. Stocks Enter a Period of Volatility

The market is seriously misjudging the AI sector’s ability to deliver on earnings and the macroeconomic pressure from stagflation. The risk-reward profile of one-way bets on U.S. stock indexes has deteriorated sharply.

I. Root of the Risk: Global Liquidity Imbalances and an Unsustainable AI Capex Bubble
The source of this market risk lies in the long-term structural imbalance in global cross-border capital flows. Overseas funds have continued pouring into dollar assets, steadily pushing up valuation
CRWV+6.18%
TSLA+4.26%
ORCL+0.84%
VST+10.47%
SPY+0.06%
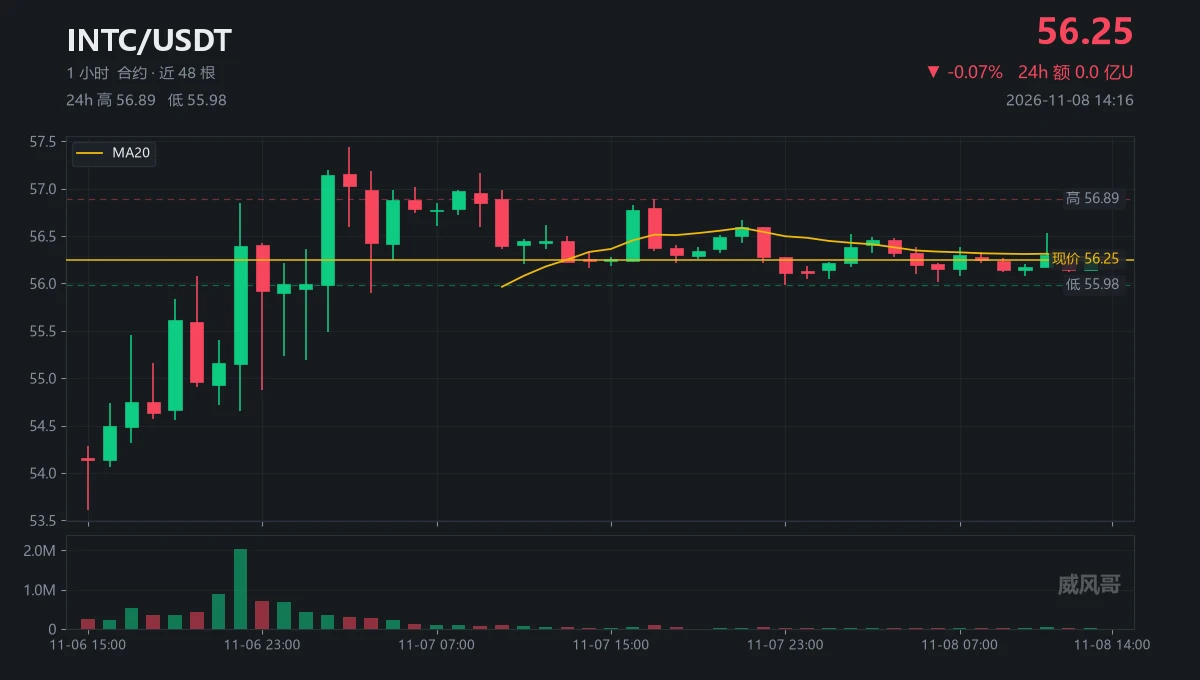
53.61 to 57.44
Twelve hours, 7.15%; this stretch had nothing to do with me.
$INTC That move happened while I had no signal; when I looked back, the price was already above 56.
The money from the second move wasn't mine; chasing in would just mean holding the bag for someone else.
Now it's 56.25, ma20 is 56.274, a difference of 0.024, right on this line.
The high of 57.44 was touched at 11-07 03:00, and it hasn't been touched again in the eleven hours since.
The low of 55.98 was at 11-07 23:00; it didn't manage to hold there either.
Funding rate: -0.0103%; shorts are paying overnight fees, but
post-image
INTC+0.05%
Load More

Join 40 M users in our growing community

⚡️ Join 40 M users in the crypto craze discussion

💬 Engage with your favorite top creators

👍 See what interests you

Trending Topics

USCPIDataIncoming

4.16k Views1.52k Discussing

The U.S. October CPI report will be released on November 10 at 8:30 a.m. ET. September CPI came in at 3.7% year over year, and markets will be watching closely for signs that inflation is cooling, especially in core CPI. A softer-than-expected reading could strengthen rate-cut expectations, while hotter inflation may pressure risk assets through higher Treasury yields and a stronger dollar. How do you think this CPI print will move $BTC, U.S. stocks and gold?

USAIStocksHitHard

24.99k Views3.71k Discussing

USNonfarmPayrolls

44.93k Views4.44k Discussing

View More