Share your thoughts
placeholder
Article
My hand trembled slightly as I set the stop-loss a few days ago, only to discover this morning that the filial piety was unnecessary. This $LINK move was simply meant to be mine. The last thing I saw before bed was it pulling back to the key level and holding firmly, with the signs of buyers stepping in at the bottom impossible to miss. At the time, I thought that even if I was wrong, I would only lose a small stop-loss by sticking to the plan. I never expected to get rich overnight, but then it started putting on a show all by itself.

When I opened the chart this morning, the price had alre
post-image
LINK+9.81%
DOGE+0.97%
XRP+0.60%
No vision, can't hold on—this round's profit is as thin as paper, but I absolutely love it🔥. I had just finished lunch and was checking the chart; $SPCX /SPCX was just moving sideways, while funds seemed to be quietly flowing in. I immediately opened a long to catch it, without waiting for the second candlestick to confirm.

This trade feels great. My entry cost was 138.37, and it's now 151.05, +849.76%. Although the profit isn't huge, I've held it firmly. When going long, only realized gains are real.

Pocket 75% first; for the remaining 20%, move the stop-loss to the breakeven line. Exit i
post-image
SPCX+0.69%
ADA+1.42%
DOGE+0.97%
Everyone’s long ZEC while the 4h chart screams distribution—who’s right?

$ZEC /USDT - SHORT

Trade Plan:
Entry: 1215.39 – 1231.17
SL: 1321.75
TP1: 1149.43
TP2: 1100.20
TP3: 1026.35

Why this setup?
- 1D trend is bullish, but the 4h setup says otherwise: SHORT bias at 84 confidence.
- Price is pinned at 1223.28 with RSI(15m) at 52—no momentum, just chop before the drop.
- ATR(1h) of 31.5 means we’re primed for a 2.5%+ move; targets sit at 1149 (TP1) and 1100 (TP2).
- Why now? The “waiting” status means the trap is set—either we sweep 1231 or dump.

Debate:
Are you fading this bullish
ZEC+20.11%
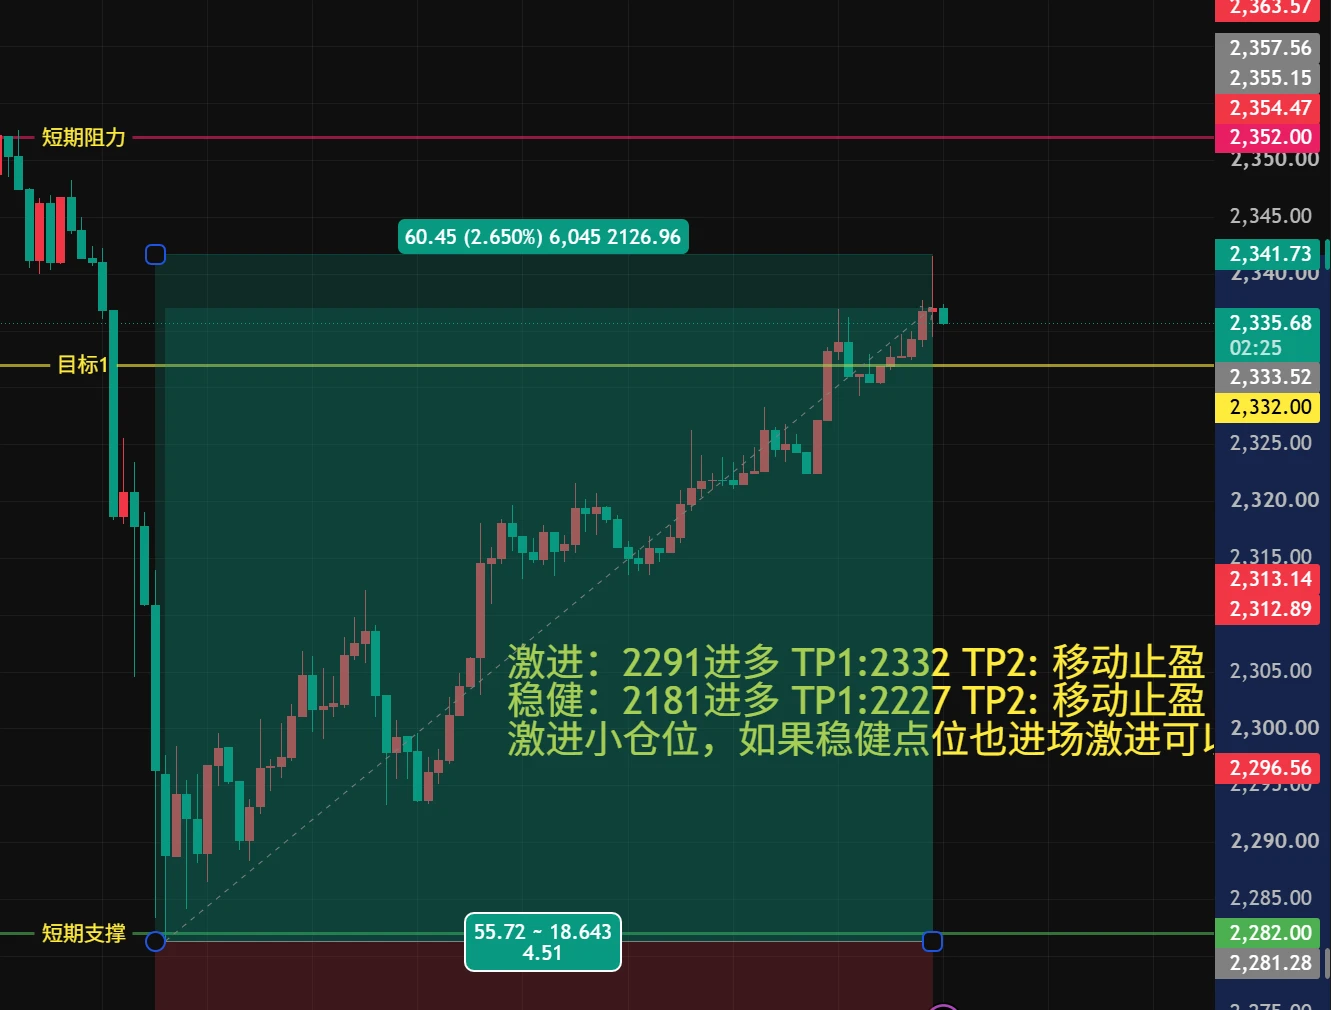
$ETH Signal】long + 4H MACD bullish expansion/1H pullback support
$ETH Depth imbalance -57.52%, sell orders dominate, with price holding above 2489. The 4H MACD bullish bars are expanding, while OI remains stable without contracting. 1H Bollinger Bands are tightening at 2478-2514, with two dips to 2488 followed by a rebound to 2496. RSI is 54 on 1H and 57 on 4H. The funding rate is 0.0051%, indicating little short pressure. Sell orders at 2489 have been tested repeatedly without a break.
🎯 Direction: long
⚡ Entry/order placement: 2489.6409 - 2496.3200
🛑 Stop loss: 2462.9246
🚀 Target 1: 25
post-image
ETH+1.32%
BTC+0.50%
SOL+3.11%
A few days ago, I was still calculating whether I had enough money for instant noodles this month; this morning, I was already wondering whether to add sausage 🍜
A few days ago, when the market had just plunged in the afternoon, I saw $PONS get slammed down and immediately bought back up. The buying support was exceptionally strong. This wasn't weakness—someone was quietly accumulating amid the plunge. I directly made my long signal clear around 0.4156, without the slightest hesitation.
Looking at the market again now, the price has climbed to 0.8206. This kind of move feels amazing—I stayed
post-image
PONS-9.49%
LAB-3.68%
BNB-1.65%
$ETH Signal】1H pullback long + 4H momentum support
$ETH Order-book sell pressure skewed -57.52%, yet the price is pinned at 2496.32. The 1H EMA20 at 2492.43 provides short-term support, while the 4H MACD histogram is expanding at 1.64, with the broader trend intact. The 1H MACD histogram is contracting at -0.32, indicating a short-term pullback.
🎯Direction: Long
⚡Entry/Limit order: 2489.64-2496.32
🛑Stop-loss: 2462.92
🚀Target 1: 2546.41
🚀Target 2: 2571.46
🛡️Trade management:
- Execution strategy: After reaching Target 1, reduce the position by 50% and move the stop-loss up to breakeven. I
post-image
ETH+1.32%
BTC+0.50%
SOL+3.11%
$JASMY held the horizontal support + the 50 daily moving average like a pro.
I can’t wait for tomorrow to explain how bullish this is 😊📈🚀
post-image
JASMY+0.36%
A hand that trembled slightly when setting the stop-loss a few days ago—this morning I realized that was unnecessary filial piety. 😂

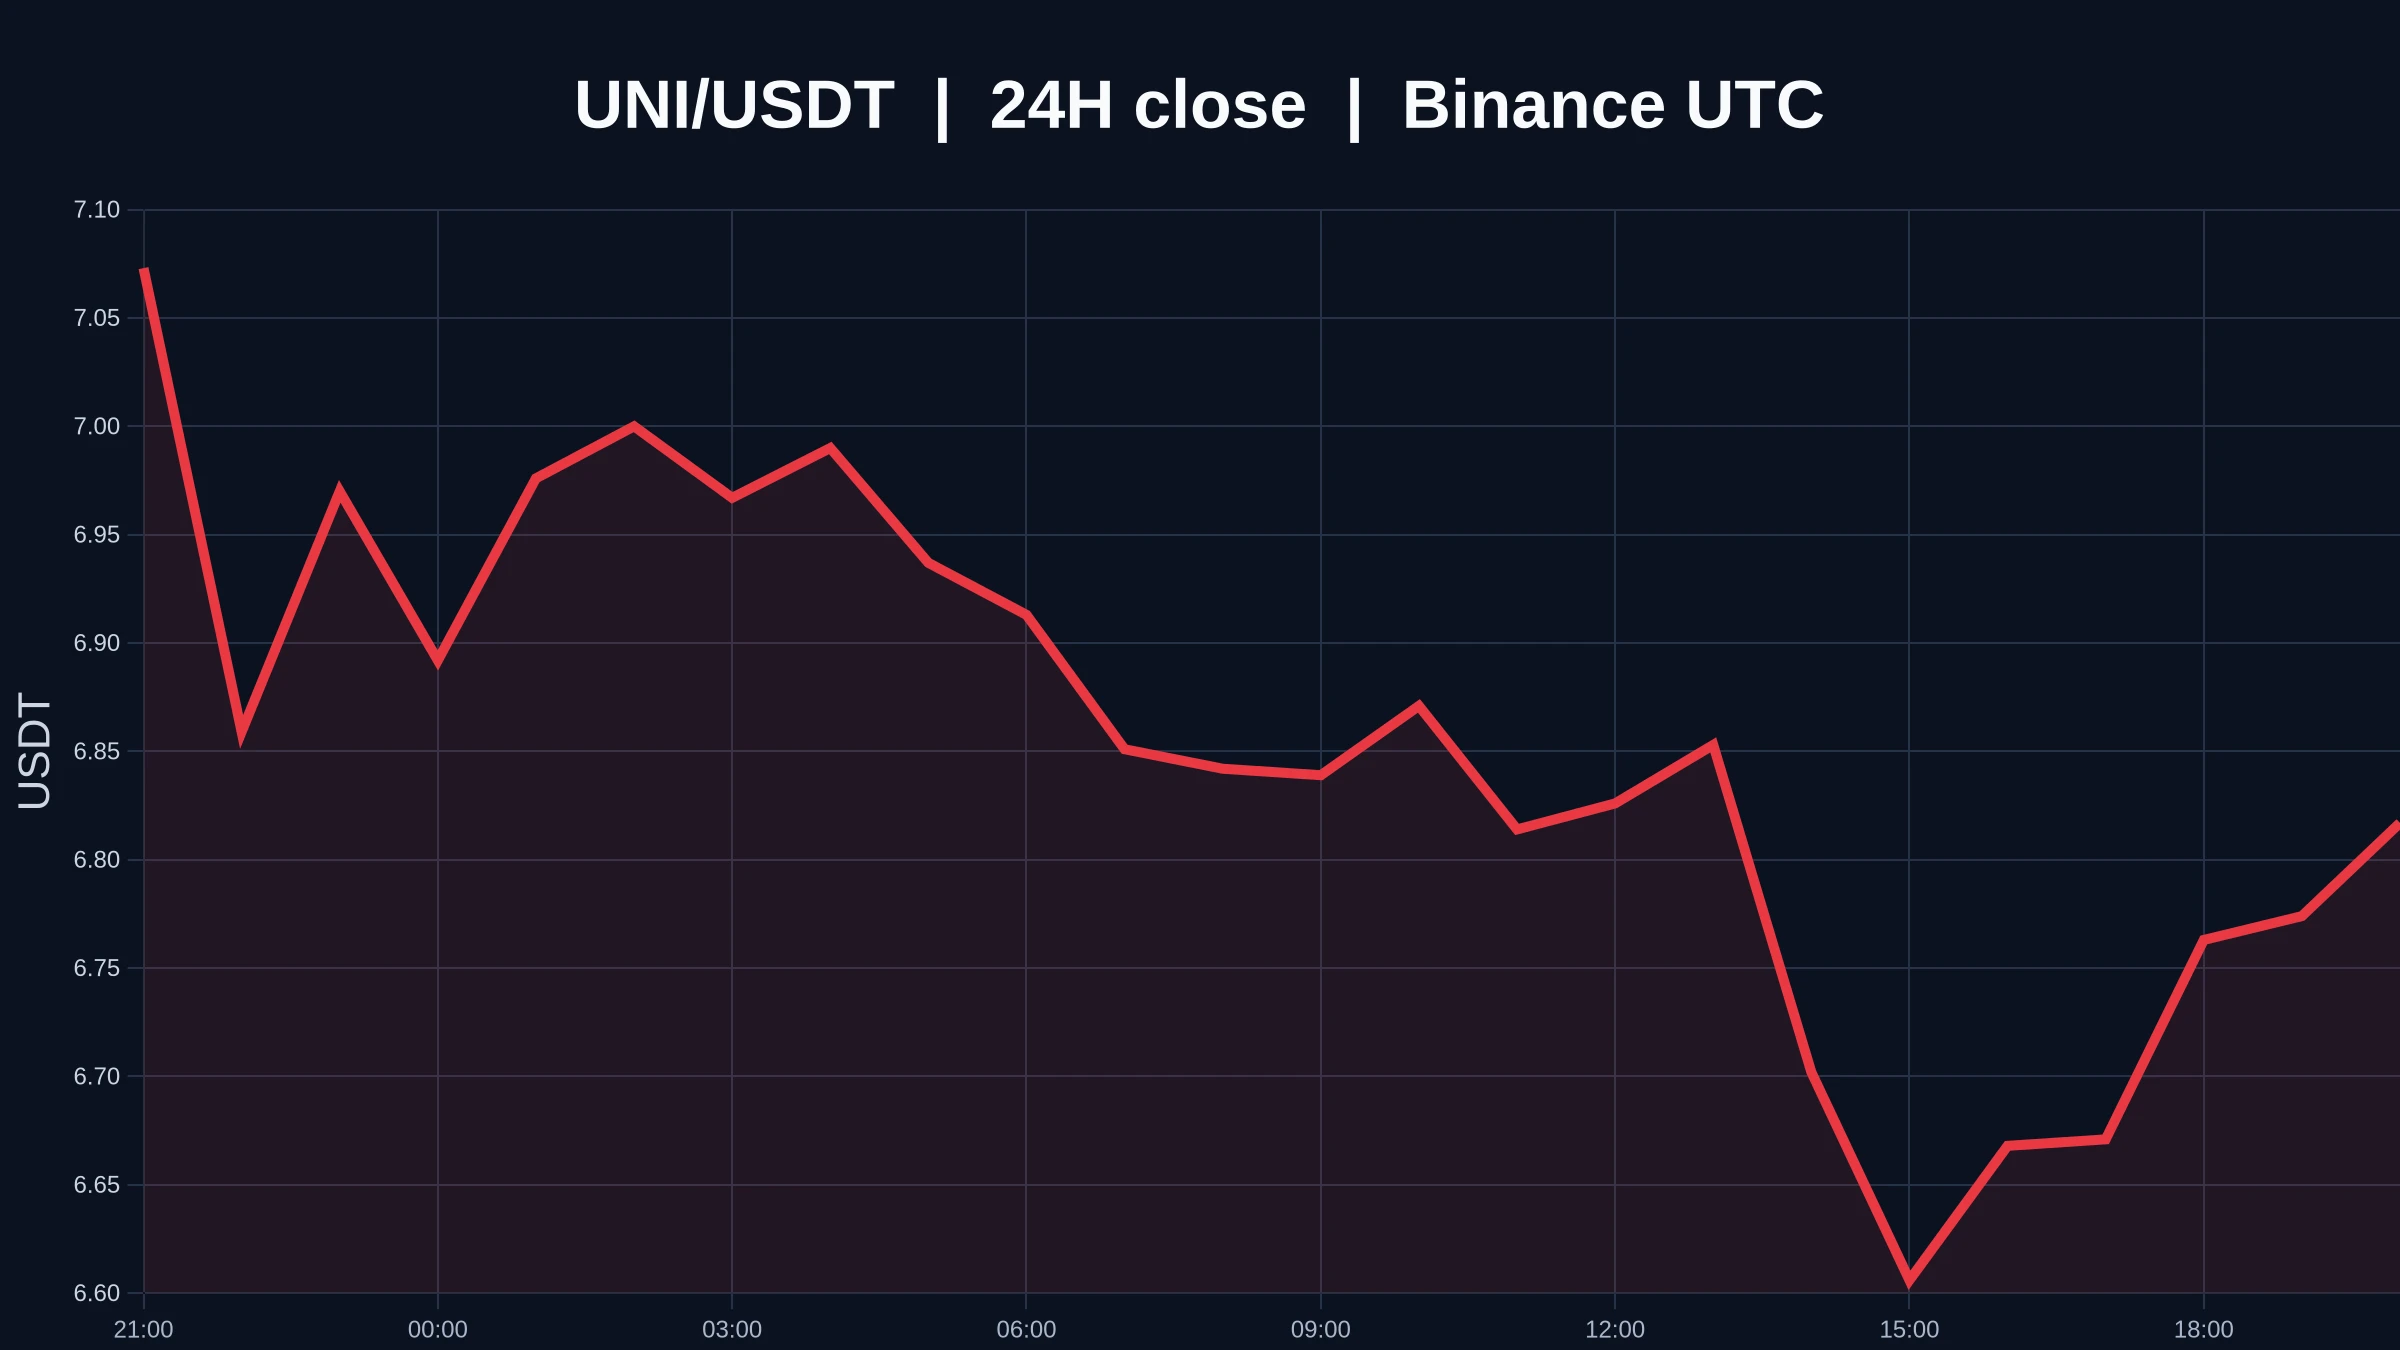
A few days ago before bed, I set my watch level near 4.828. The pullback held, and buying pressure clearly strengthened. If you don’t enter on a signal like this, what are you waiting for? I pressed confirm and closed the app. When I opened the charts this morning, $UNI had already reached 7.141, and my position’s return had rolled straight up to +3400.28%. This move really wasn’t luck; it was positive feedback from the structure. Feeling good, brothers. 🎯

post-image
UNI+1.47%
ADA+1.42%
ZEC+20.11%
I originally just wanted to freeload a breakfast, but the market ended up making me eat dumplings for half a year🥟. A few days ago at dawn, $SNDK /SNDK was still grinding around that level, but buying pressure was quietly strengthening, so I opened a long position and went in directly without hesitation.

Now the bullish thesis has played out crystal clear. The price went from 1586.74 all the way to 1785.04, netting +887.24%. Feeling good, brothers—the harder it grinds beforehand, the more satisfying the breakout.

Take off 75% first, and place the remaining 20% above 1586.74 to protect the
post-image
SNDK+0.79%
LAB-3.68%
ETH+1.32%
Everyone's chasing the breakout—I'm watching $SNDK /USDT bleed toward 1753 instead.

$SNDK /USDT - SHORT

Trade Plan:
Entry: 1778.05 – 1782.59
SL: 1802.12
TP1: 1763.97
TP2: 1753.07
TP3: 1736.73

Why this setup?
- 4H bias is SHORT at 55% confidence, while the 1D trend stays trapped in a range—no momentum to save the bulls.
- Price is hovering at 1780.32, right on the edge; the first target is 1763.97, but the real magnet is TP2 at 1753.07.
- RSI on the 15m is only 52.69—no oversold bounce fuel, just weak hands waiting to dump.
- ATR (1h) of 9.08 means we have room to slide; the stop at
SNDK+0.79%
Everyone’s staring at TAO’s 260.5, but the real trap is the range you’re ignoring.

$TAO /USDT - SHORT

Trade Plan:
Entry: 259.2 – 261.8
SL: 276.3
TP1: 248.7
TP2: 240.8
TP3: 229.0

Why this setup?
Why now?
- 1D trend is *range*, not trend—so the 77% SHORT bias is a mean-reversion play, not a breakout.
- 4h structure pins entry at 260.5 with tight 1h ATR (5.05)—volatility is compressing, which precedes a snap.
- RSI 15m at 54 shows no exhaustion yet, but price is stalling under range highs; TP1 at 248.7 is a 4.5% drop, not a gamble.

Debate:
If range holds, do you fade the first touch
TAO+12.35%
After $FARTCOIN rallied, I didn’t exit my entire position. I took 80% in profits first and moved the protective stop on the remaining position above breakeven. Just now, a quick pullback took out the remaining position, locking in the profits smoothly.

The entry reason was simple: on the hourly timeframe, price pulled back to the previous high without continuing lower, and instead reclaimed the area above the moving average on rising volume. This was a textbook pullback confirmation. After going long, I kept my stop loss below the lower boundary of the small range.

After the pullback took
post-image
FARTCOIN+4.74%
SNDK+0.79%
ZEC+20.11%
The week just started
Now, 6 more days to survive with just 14% Fable limit remaining.
The markets are keeping me and Fable locked in
post-image
Everyone’s watching ENA for a breakout—but the 4h chart is screaming the opposite.

$ENA /USDT - SHORT

Trade Plan:
Entry: 0.17564 – 0.17726
SL: 0.18423
TP1: 0.17062
TP2: 0.16673
TP3: 0.16089

Why this setup?
- 1D trend is *range*, not momentum—meaning the 0.17645 level is a magnet, not a launchpad.
- RSI (15m) at 62 is fading—buyers exhausted before they even reach the 1h resistance.
- ATR (1h) at 0.00324 is tight—when volatility squeezes, shorts win the first pop down to TP1 (0.17062) and TP2 (0.16673).
- Why now? The “waiting” status means the trap is set: 0.17645 is the bait, 0.18
ENA+1.79%
#Gate用户突破6000万,来 用户突破6000万,来 Gate Reaches 60 Million Users Worldwide!
60 million users is not just a number — it represents millions of trading journeys, unforgettable moments, lessons, profits, losses, and memories created along the way.
Do you remember when you first joined Gate?
Do you still remember your first trade?
Maybe it was a perfect entry… or maybe the market taught you an unforgettable lesson!
For me, every trade tells a story. Some bring excitement, some bring valuable lessons, and some become memories that we can laugh about years later.
Now Gate is inviting its community to
post-image
GT-1.61%
Everyone’s eyeing BNB at 750—but the 4h chart is silently screaming “trap” while the daily range holds its breath.

$BNB /USDT - SHORT

Trade Plan:
Entry: 749.30 – 751.40
SL: 760.45
TP1: 742.77
TP2: 737.72
TP3: 730.14

Why this setup?
- Price is pinned at 750.35 with a 1D range, yet the SHORT bias (conf 55) targets a clean drop to 742.77 first.
- RSI on the 15m is only 56.1—no overheated bounce fuel, while ATR (4.2) shows volatility is compressed, priming a snap.
- Why now? The “waiting” status means the entry zone (749.30–751.40) is the exact battlefield; a rejection here flips momentu
BNB-1.65%
I was just glancing through $EURUSD and found this unfolding, looks nice so I have to see how it plays out.
#eurusd
post-image
EURUSD+0.01%
$DOOD Signal】Bullish breakout + overbought continuation
$DOOD RSI 14 surged to 91.21, while 1H/4H MACD showed dual bullish expansion, and the price advanced along the upper Bollinger Band. Depth imbalance stood at 16.31%, with clear bid support. 1H surged from 0.001673 to 0.001951 at a steep slope, while 4H volume increased simultaneously. The funding rate of 0.0351% remains moderate, and OI is stable. The price continues to be aggressively pushed higher in the overbought zone, with a risk-reward ratio of 1.5; strict stop-loss placement is required.
🎯Direction: Long
⚡Entry/limit order: 0.001
post-image
DOOD+29.89%
BTC+0.50%
ETH+1.33%
SOL+3.11%
Financial News, Crypto Updates, Real-World Strategies
live-cover
LIVE1,454
Load More

Join 40 M users in our growing community

⚡️ Join 40 M users in the crypto craze discussion

💬 Engage with your favorite top creators

👍 See what interests you

View More