





Share your thoughts
placeholder
Article
$CHILLGUY Signal】Long setup / 4H breakout above the Bollinger upper band
$CHILLGUY Current price 0.015797, breaking above the 4H Bollinger upper band at 0.0152. Order book imbalance is 7.64%, with a bid ratio of 1.17. The 4H MACD histogram is expanding, while the 1H histogram is contracting, indicating a slowdown in the rally. RSI14 is 82.63 and 1H RSI is 77.43, approaching extreme levels without turning down. 4H volume rose from 9.23 million coins to 240 million coins before narrowing, while the price held at elevated levels. Funding rate is 0.0163%, and OI is flat.
🎯Direction: Long
⚡Entry/
post-image
CHILLGUY+14.88%
BTC+0.01%
ETH+0.67%
SOL+2.14%
I just switched the software to the background, and it shot straight down—are you playing hide-and-seek with me? ⚡
During the repeated intraday swings, the signal I saw was crystal clear: every push upward fell just short, while sell-side pressure was incredibly heavy. The resistance above was obvious; this kind of fake breakout can't fool anyone watching the volume.
The 97.209 short is now at 80.161, with +840.15% secured. Nailed the timing—feeling great, brothers. 📉
The market is something you wait for, and profits are something you hold onto. Panic comes from having no plan; losses come fr
post-image
SNDK+1.18%
BTC+0.05%
With this price action, I don’t even need to think—the account is dancing on its own. 🤣

A few days ago, the last thing I saw before bed, $XRP was still moving sideways around 1.3845, unable to fall or rally. It was forming a base without breaking down—clearly the prelude to a launch. I placed a long order and went to sleep without a hint of anxiety.

When I woke up this morning, it had jumped straight to 1.4216, with +249.27% safely in the bag. Staying up late wasn’t for nothing; I got the rhythm right, and felt at ease. 😏

I first put the +249.27% profit in the bag, and set cost protec
post-image
XRP+0.36%
DOGE+0.09%
SNDK+1.18%
I didn’t chase the first bullish candle after the breakout; my first instinct was to worry about a false breakout. Only after the pullback held and the second volume-backed move began did I confirm the direction and add to my long position.

After the price surged near the target and momentum stalled, I followed the plan and first cut 70% of the position, keeping the remaining 30%. Later, the protective level was hit during a pullback, so I simply exited the remaining position completely.

This long trade made one thing clearer to me: entering a little later is nothing to be ashamed of. The
post-image
BNB-2.57%
ADA+0.50%
This $PONS long position has been quite a grind. There was one downward spike in the middle that swept out quite a few short chasers, coming just a few points away from my protective level. I did not manually cut the position at the time because the four-hour structure had not broken down.
I entered based on a double bottom on the hourly chart. After the right-side breakout, the price pulled back to the prior high neckline and stabilized. Once confirmed, I went long with the trend. The entry was not particularly cheap, but the stop-loss was very close, making it a case of using limited risk to
post-image
PONS-7.88%
BTC+0.05%
SOL+2.14%
Everyone’s chasing TAO’s green candles, but the 4h tape is screaming something they refuse to hear.

$TAO /USDT - SHORT

Trade Plan:
Entry: 267.0 – 269.4
SL: 283.5
TP1: 256.7
TP2: 249.1
TP3: 237.6

Why this setup?
- RSI on the 15m is overheated at 69.6—buyers are exhausted right as price tags the 268.2 reference.
- ATR (1h: 4.89) shows volatility is compressing; a snap back toward 256.7 (TP1) is the path of least resistance.
- 1D trend is range-bound, so fading the top of the range (269.4) with a 77.4 confidence short isn’t a gamble—it’s statistical edge.

Debate:
If TAO rejects 269 an
TAO+13.72%
$AVAX With A Strong Bounce Off The Bullish Restest Of The Blue Falling Wedge 🚀
post-image
AVAX+2.40%
MARKET prediction
live-cover
LIVE40
Everyone’s staring at the 4H chart, but the 15m RSI just whispered a secret about HYPE that most will ignore.

$HYPE /USDT - LONG

Trade Plan:
Entry: 87.013 – 87.451
SL: 85.127
TP1: 88.810
TP2: 89.863
TP3: 91.441

Why this setup?
- Why now? The 1D trend is bullish, yet the 15m RSI (36.85) shows a local washout—this is the classic "shakeout before markup" pattern.
- Entry zone is tight: 87.013–87.451. ATR (0.877) suggests low volatility compression, which typically precedes an expansion move.
- With TP1 at 88.810 and TP3 at 91.441, the risk/reward from 87.232 is over 4:1 if the long trig
HYPE+2.66%
Everyone’s watching $SPCX /USDT pump—but the 4h chart just whispered a secret that most retail will ignore.

$SPCX /USDT - SHORT

Trade Plan:
Entry: 151.06 – 151.26
SL: 152.44
TP1: 150.20
TP2: 149.56
TP3: 148.60

Why this setup?
- Price is pinned at 151.16 with a **SHORT bias (77% confidence)** while the daily trend says “range”—that’s a compression zone.
- RSI on 15m is only 57.97—not overheated, not cold. It’s a **lull before a snap**, not a breakout signal.
- ATR on 1h (0.41) is tight—meaning the next 4h candle could stretch 3x that move.
- The “Waiting” status + invalidation at 14
SPCX+0.89%
The future of finance
$TITTIES
post-image
The market humbles everyone eventually, but this time it has been pretty gentle with me.
When it plunged intraday, 1.117 looked like it was about to collapse, but it ultimately couldn’t push any lower. Volume dried up completely—those who were going to run had already done so, leaving only the ones who didn’t want to move.
When I checked the chart after lunch, the price had already started quietly climbing back. I had just one thought at the time: at this level, set a stop-loss and take a shot at a rebound.
Now at 4.532, with a +14729.64% return, the guys on board should be waking up laughing,
post-image
SNDK+1.18%
XRP+0.36%
#ZEC How should we view ZEC after it broke above $1,200?
First, the most compelling point in the bullish narrative: ZEC's all-time high was actually $5,941 in 2016—the current $1,193 is still about 80% below its ATH. Against the backdrop of continued ETF inflows, the market can fully tell the story that a ten-year high is only the beginning and that ZEC is returning to its ATH. ZEC's ETF assets under management have surpassed $400 million, while the SMA-200 near $440 provides strong trend support, and the daily structure remains healthy.
But in terms of momentum, the risk is accumulating rathe
post-image
ZEC+22.58%
I originally wanted to cut my losses as a sacrifice to the heavens, but the sacrifice never happened—the meat roasted itself. 😏
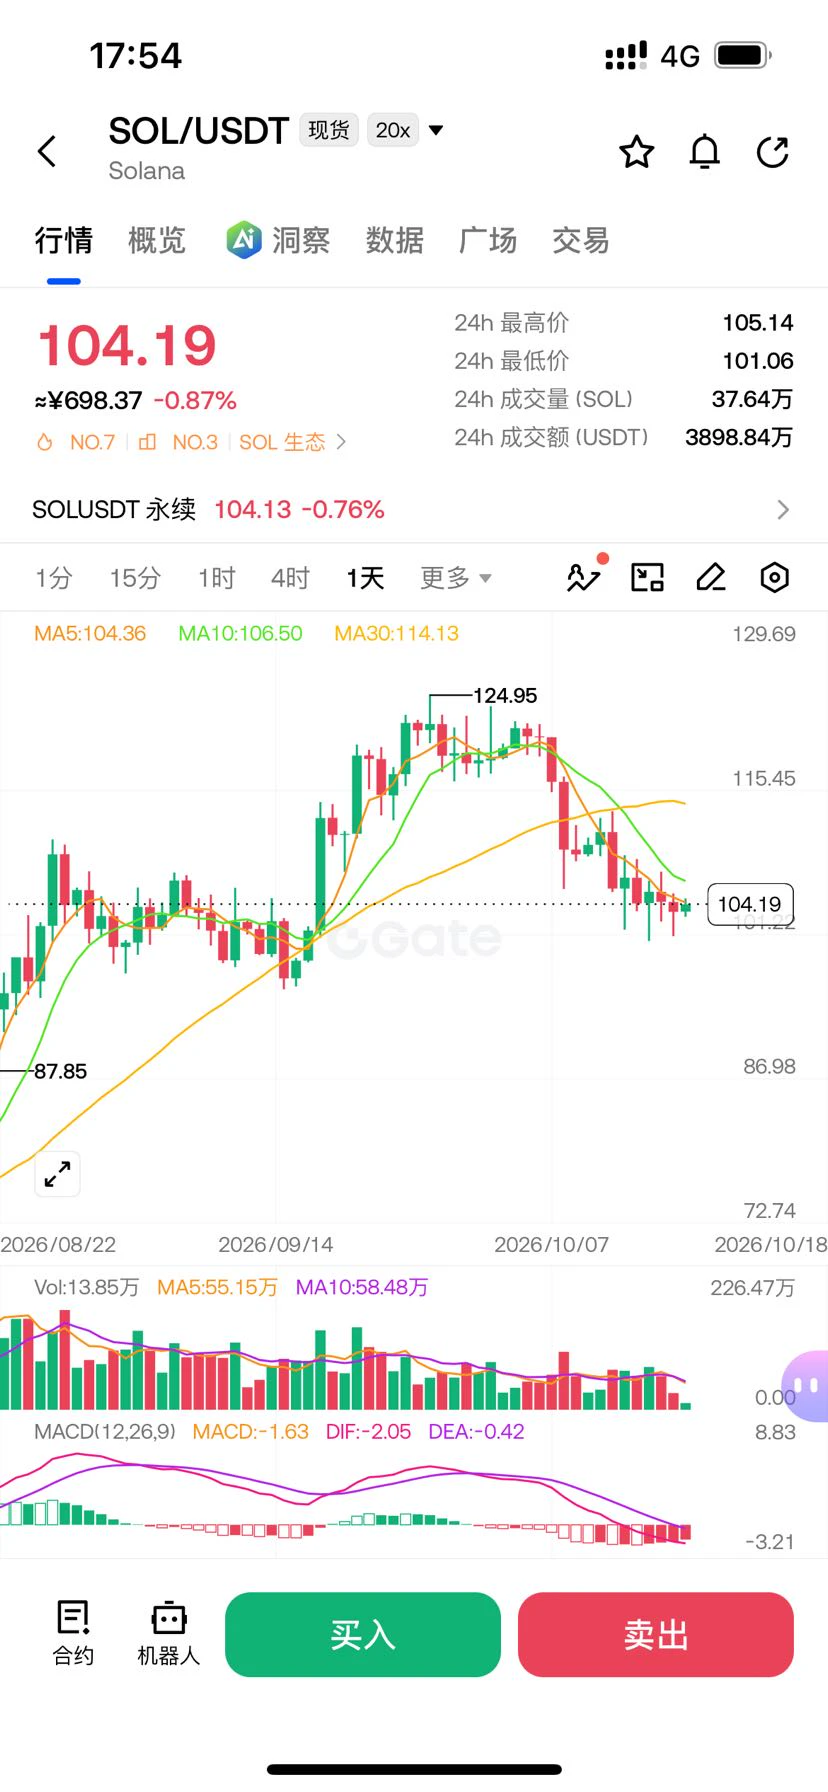
While the market was repeatedly fluctuating, I kept an eye on the movement of $SOL /SOL around 104.52. It was moving sideways at the bottom, holding above the retest level, with clear buying support below. The longer it dragged on, the more promising it looked. I immediately set up a long position without hesitation.
I just checked the market, and it has already pushed up to 105.67, with +100.57% secured. This trade feels great—the action was truly sluggish at first,
post-image
SOL+2.14%
XRP+0.36%
BTC+0.05%
Honglu Di team
Sincerely bow three times
Make a great fortune this year
$ETH /USDT Perp – "Recovery Bounce – Long"**
**Trading Plan Long $ETH
Entry: 2489
SL: 2480
TP1: 2498
TP2: 2522
Explanation: Strong bounce off the 2462 low with MACD turning positive, targeting the 2498.70 yellow resistance and the 2522 high
#HYPEBreaks88HitsNewAllTimeHigh
post-image
ETH+0.73%
  • 3
#RedBullTradingTourSeason6
🏎️ 2026 Red Bull Trading Tour · The sixth edition is now heating up!
The maximum 60,000 GT dynamic prize pool has been upgraded again, with F1 viewing grand prizes, official Red Bull car models, and more waiting for you to unlock!
Sign up now: https://www.gate.com/competition/f1rb/s11
🎁 Livestream perks continue tonight at 20:00 (UTC+8)
Golden Bull sculptures × 2|100 USDT position experience vouchers × 3|Red packet rain keeps falling
🔥 Tonight's key topics:
🔹 60,000 GT dynamic prize pool: A comprehensive breakdown of this edition's reward mechanism—how can you e
post-image
GT-1.72%
Everyone’s still long ARB, but the 4H just printed a trap door to 0.146.

$ARB /USDT - SHORT

Trade Plan:
Entry: 0.18134 – 0.18522
SL: 0.20186
TP1: 0.16934
TP2: 0.16005
TP3: 0.14612

Why this setup?
Why now?
- RSI 15m at 37 shows momentum is already bleeding, not bouncing.
- Price is stalling at 0.18328 while 1D trend stays “range”—no bullish fuel.
- ATR 1h (0.0077) says volatility is compressing; shorts squeeze harder when the pop fails.
- TP1 at 0.16934 is a 7.6% drop, but TP3 at 0.14612 is the real magnet if 4H support cracks.

Debate:
Are you fading this breakdown to 0.169, or
ARB+10.24%
solana:HHig4peAgZqdAV17XuuAdojYSYLhsctjTEvT2kq9FkNA Hesitant, but I'll gamble.
post-image
SOL+2.14%
Load More

Join 40 M users in our growing community

⚡️ Join 40 M users in the crypto craze discussion

💬 Engage with your favorite top creators

👍 See what interests you

View More