Square
Following
Hot
News
Notifications
Profile
Share your thoughts
placeholder
Article
[NEW streamer BTC]
live-cover
LIVE986
Why Does the Exchange Show a Profit, Yet the Amount You Actually Earn After All Costs Is Much Smaller?

When reviewing their trades, many traders focus only on the difference between the buy and sell prices, while overlooking an important issue:

Paper profit does not necessarily equal actual net profit.

Especially in the cryptocurrency market, trading frequency, order types, holding periods, and market liquidity can all affect the final result.

To find out whether a strategy can actually make money, you need to understand at least the following five types of costs.

1. Trading fees: Every b
post-image
Trenches
ZIG
Z
bade
b
ZIG
0x8c...1145
Market Cap
$.
Change
.
24h Vol
$.
Holders
.
CLAUDIA
C
bade
b
CLAUDIA
2j5S...W2ZM
Market Cap
$.
Change
.
24h Vol
$.
Holders
.
STONK
S
bade
b
STONK
6GmA...UNgx
Market Cap
$.
Change
.
24h Vol
$.
Holders
.
IDOL
I
bade
b
IDOL
0x3b...ab07
Market Cap
$.
Change
.
24h Vol
$.
Holders
.
FLOAT
F
bade
b
FLOAT
Bv1a...BMmr
Market Cap
$.
Change
.
24h Vol
$.
Holders
.
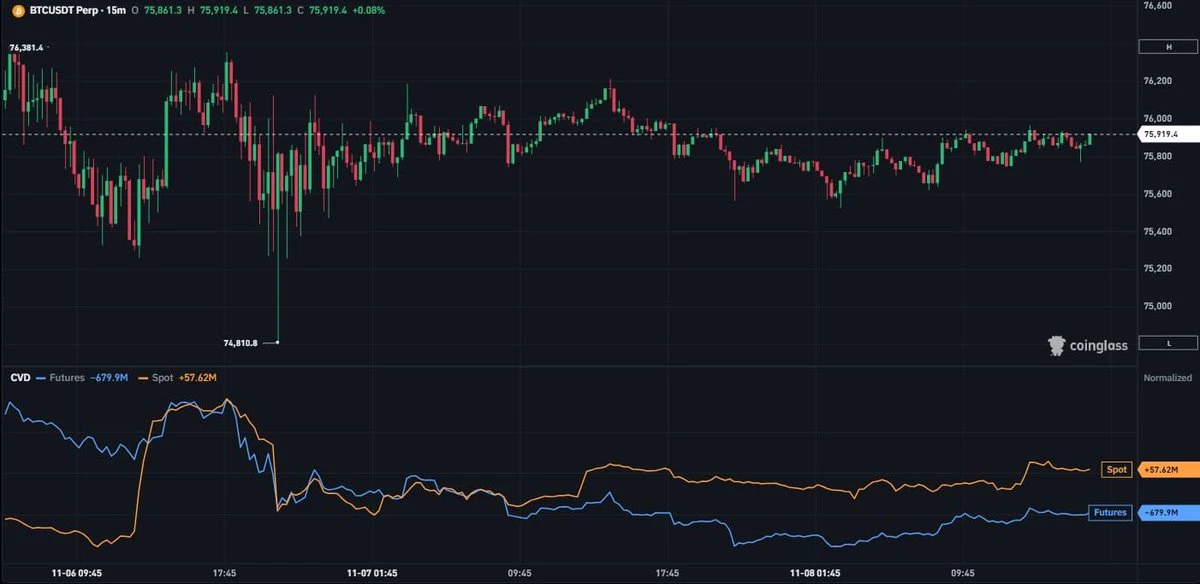
Spot has been bidding $BTC over the weekend.
But, perps are still shorting heavily here.
Until spot bidding accelerates, perps will continue to push Bitcoin down.
post-image
BTC-0.67%
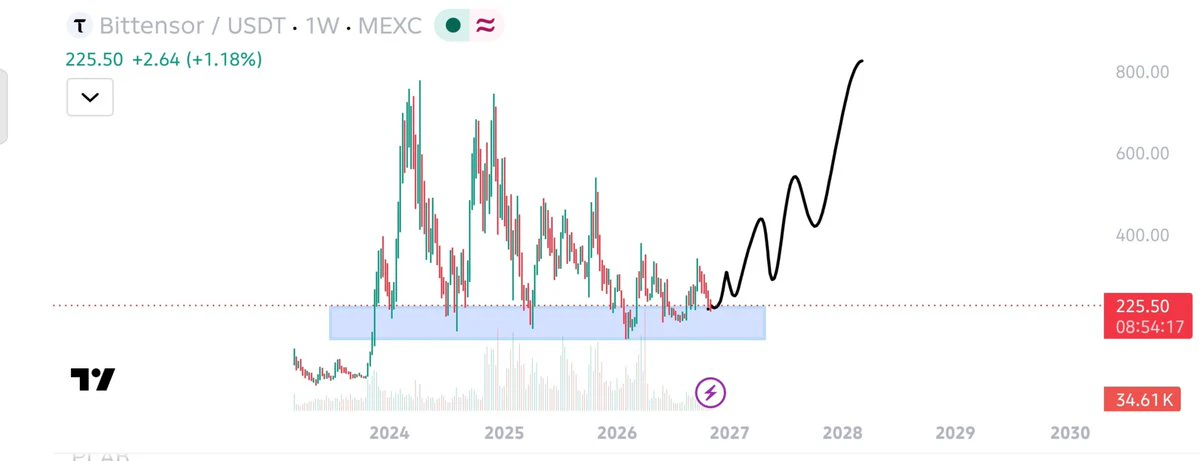
$TAO clean chart, Buy area 210-225$ area.
Selling area 250-280$.
Easy money on TAO waiting for you.
post-image
TAO+0.41%
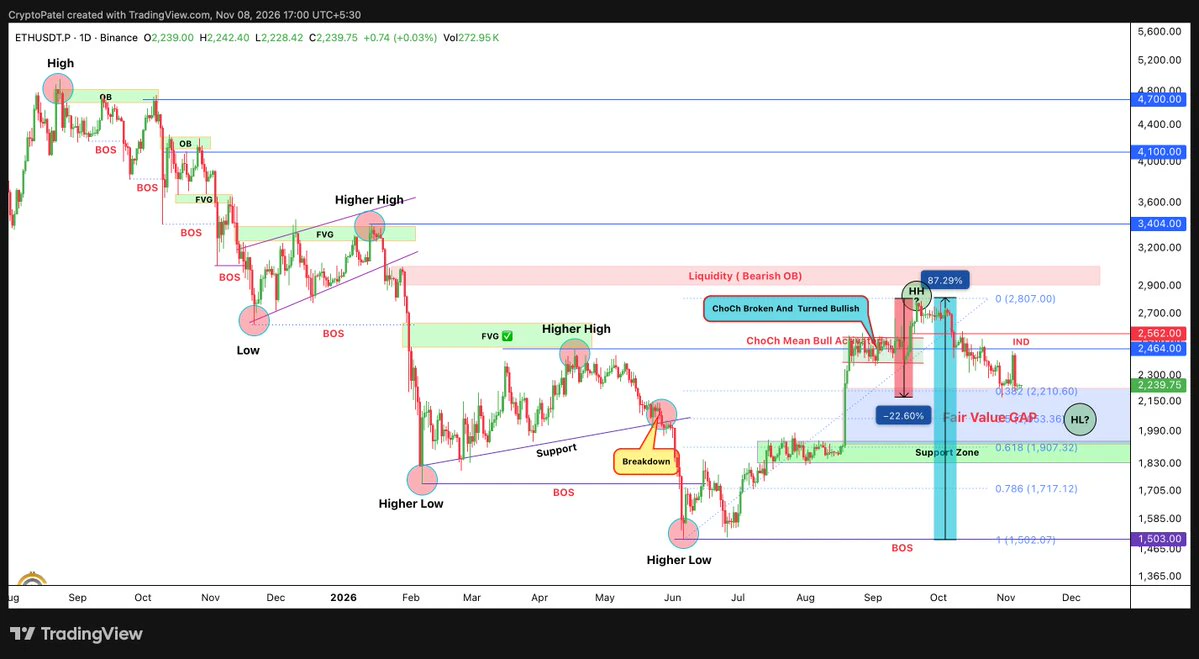
A WICK ABOVE RESISTANCE DOESN'T ALWAYS MEAN A BULLISH BOS
This is one detail traders often overlook.
🔹 Wick breaks the level but closes below → Possible liquidity sweep.
🔹 Candle closes above the swing → Confirmed break under a close-based rule.
The same logic applies to bearish breaks.
I prefer candle-close confirmation for my structure analysis.
A temporary breakout and a confirmed structural break are not the same thing.
#Ethereum #SMC $ETH
post-image
ETH-1.26%
  • 1
BlackRock’s IBIT Redemptions Raise Fresh Concerns About Bitcoin Fund Demand
live-cover
LIVE969
Long strategy $TA When a clear uptrend is evident, chase the rally and go long. Take profit: 0.124 Stop loss: 0.1 Why go long? Follow the uptrend and chase the rally. Keep rising, rise even more
post-image
TA+10.20%
$JCT The market maker's no good—why can't you push it any higher? Come liquidate me at 0.015
post-image
JCT-3.26%
Based on the provided data, the market is currently in a state of fragile equilibrium: short-term indicators signal a potential bounce, but the mid-term picture remains under pressure. The key event for the upcoming week is the US macroeconomic inflation data, which could dictate the direction of the market for the entire month of November.

📅 Macro Context: CPI and PPI

The market is holding its breath ahead of the inflation data set to be released next week. According to forecasts, both headline and core CPI are expected to rise by 0.3% MoM, which could support expectations for a Fed rate h
BTC-0.67%
Will tomorrow bring another bloodbath? Last week’s sell-off is still fresh in everyone’s memory, and traders are already holding their breath ahead of Monday’s open.
Several signals warrant caution:
- AI stocks came under more pressure after Democrats won the election; - debate over an artificial intelligence bubble is heating up worldwide; - reports suggest the U.S. may launch a relatively limited military operation against Iran; - the VIX posted one of its three biggest single-day gains in history last week; - large funds are accelerating their retreat from AI-linked debt assets; - bets on a
post-image
XAU+0.38%
ZEC+1.16%
BTC-0.67%
  • 1
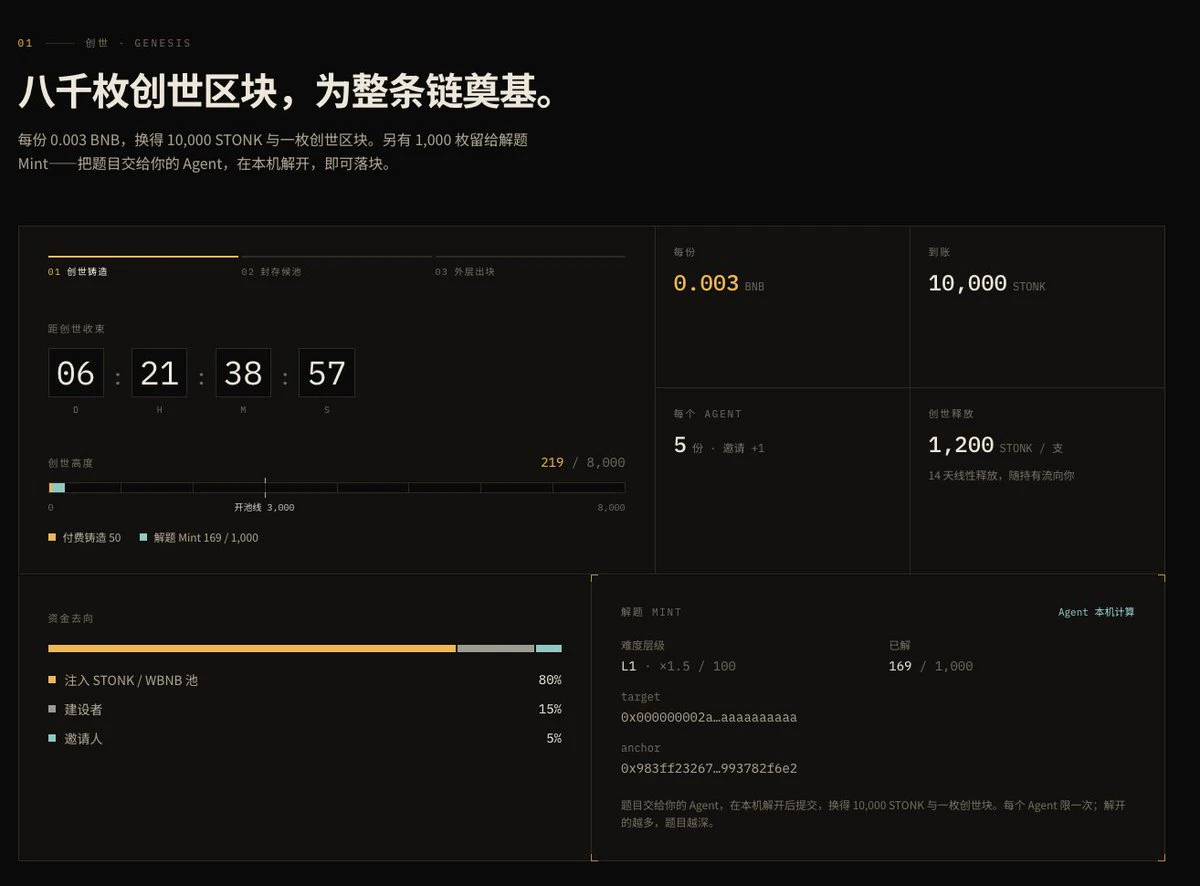
There’s a free 1k quota. Solve the proof of work and submit it to get 10,000 STONK + 1 Genesis block
If you’re bored, give it a try; you’ll need to run compute to solve the puzzle
CPU is a bit slow, so have your AI try the GPU
Anyway, take the free one; don’t touch the paid one ⚠️
Link:
post-image
STONK+11.55%
📣 Daily standout post call|Don’t keep great posts to yourself—see you in the comments

Which post have you written recently that you’d most like everyone to take a closer look at? 🔎

Well-grounded market analysis, trading recaps that spell out the wins and losses, clearly explained knowledge sharing… all are welcome.

💬 Leave this in the comments: a link to the original Square post + one thing that makes it worth a look
Feel free to recommend your own post, or share a great post by another author. If you come across an opinion that interests you, open the original post and chat with the aut
post-image
What exactly is it?
I really can't think of anything...
post-image
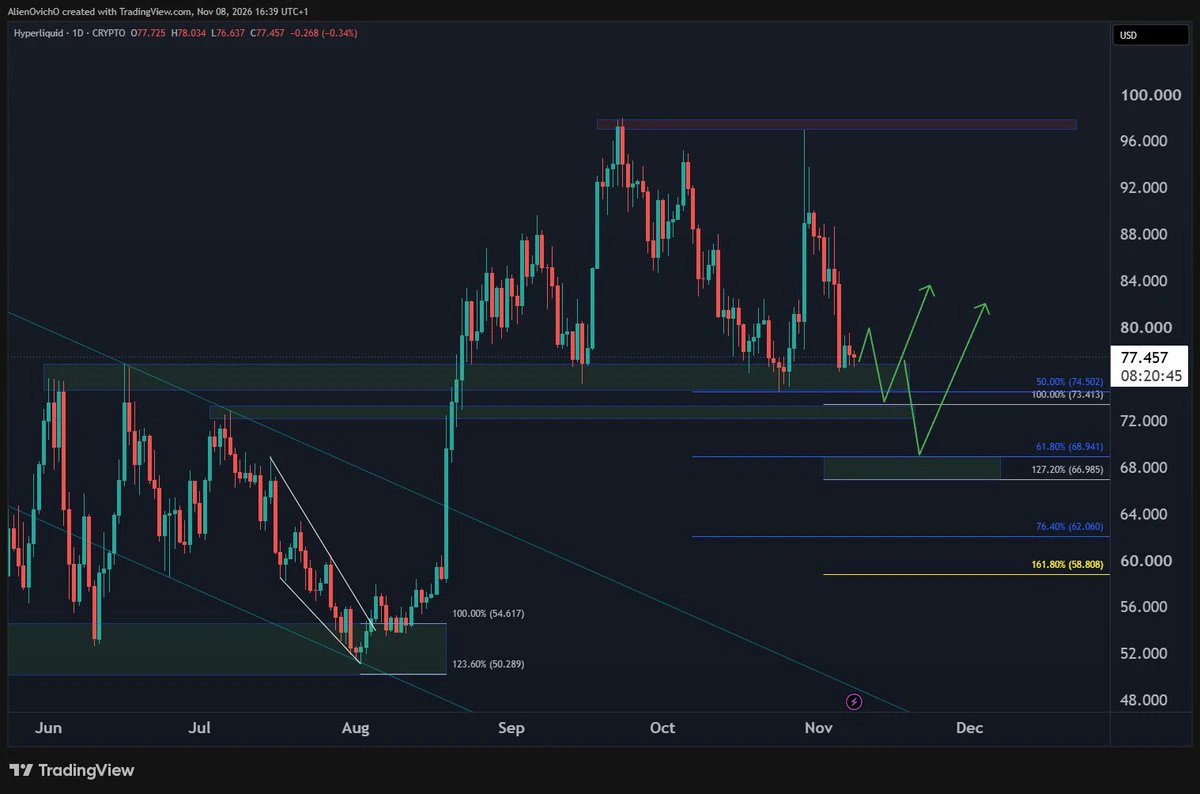
$HYPE is testing the $76 support for the 3rd time 👀
🔹After failing to break into a new ATH near 97, price is back at the 76 support area. The more often support gets tested, the weaker it gets.
🔹A break lower opens the next buying zone at $75–$66: the 100% extension at 73.4, the 61.8% at 68.9 and the 127.2% extension at 66.9 all sit there 🧲.
🔹If price gets there, that's where I'd look for the next turn higher.
Would you buy at 74 or wait for 66–68? 👇
post-image
HYPE+0.24%
Holy shit, that's exactly what I just did in the shower! 🤪
post-image
Why might a trading strategy that performs well in historical backtests gradually fail in live markets?

A beautiful return curve does not necessarily represent a reliable trading strategy.

In the cryptocurrency market, many traders test entry signals, take-profit and stop-loss settings, and position parameters using historical data. But after a strategy is deployed in the market, its win rate may decline, drawdowns may grow, or it may even lose money over the long term.

What exactly is going wrong?

I. Historical data is not the same as future markets

Backtesting can only show how a strate
post-image
4 little-known facts that will make your heart ache once you do the math
① Annualized funding rates are scarier than you think
0.01% / 8 hours × 3 times/day × 365 days = 10.95% / year
It may look like just one ten-thousandth each time, but over a year that's 11% of your principal.
In a high-funding-rate market (0.1%/8h), the annualized rate is 109%.
So even if you're right about the direction, funding fees can eat up all your profits if you hold long term.
Before placing a trend trade, check the current funding rate.
② There are two types of stop-loss orders, and they work very differently
Mar
post-image
BTC-0.65%
  • 1
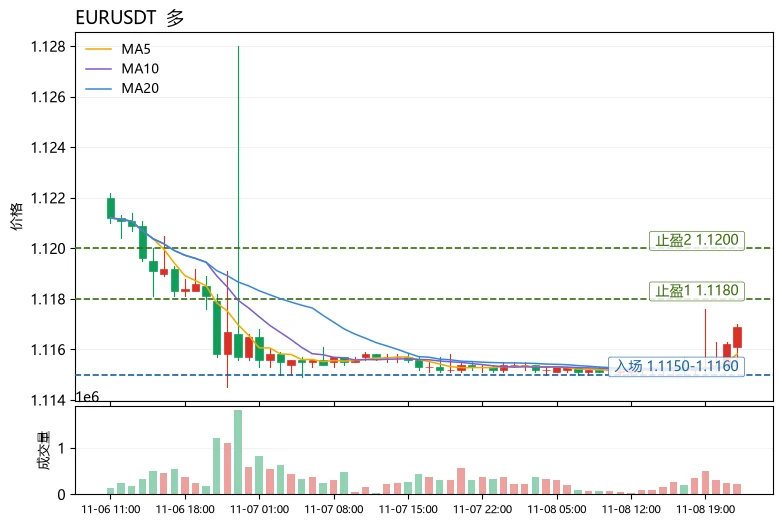
Many people see RSI surge above 70 and rush to call it overbought and short. This is a classic misuse of indicators—in a strong trend, RSI can stay elevated for a long time, and relying on a single indicator can mean getting caught on the wrong side of the trend. Taking
$EUR as an example, here’s a reusable chart-reading approach: use moving average alignment to judge whether the trend is healthy, then use RSI and Bollinger Bands to assess positioning.
First, look at the structure: MA5=1.11582 has crossed above and held above MA20=1.11536, with the short-term moving average above the long-ter
post-image
eur
eureur
Gate.Fun
MC:$5.55KHolders:3
0.06%
BMT+5.93%
UNI+3.05%
Top Crypto Rewards: Invite Friends to Trade Futures and Win a Share of $50,000 in BTC and ETH https://www.gate.com/campaigns/6917?ch=9497&ref=VLARBF1YAG&ref_type=132&utm_cmp=0UCtzoY1
post-image
BTC-0.65%
ETH-1.23%
Load More

Join 40 M users in our growing community

⚡️ Join 40 M users in the crypto craze discussion

💬 Engage with your favorite top creators

👍 See what interests you

Trending Topics

USCPIDataIncoming

9.57k Views1.62k Discussing

The U.S. October CPI report will be released on November 10 at 8:30 a.m. ET. September CPI came in at 3.7% year over year, and markets will be watching closely for signs that inflation is cooling, especially in core CPI. A softer-than-expected reading could strengthen rate-cut expectations, while hotter inflation may pressure risk assets through higher Treasury yields and a stronger dollar. How do you think this CPI print will move $BTC, U.S. stocks and gold?

USAIStocksHitHard

27.53k Views3.74k Discussing

USNonfarmPayrolls

52.04k Views4.47k Discussing

View More