Square
Following
Hot
News
Notifications
Profile
Share your thoughts
placeholder
Article
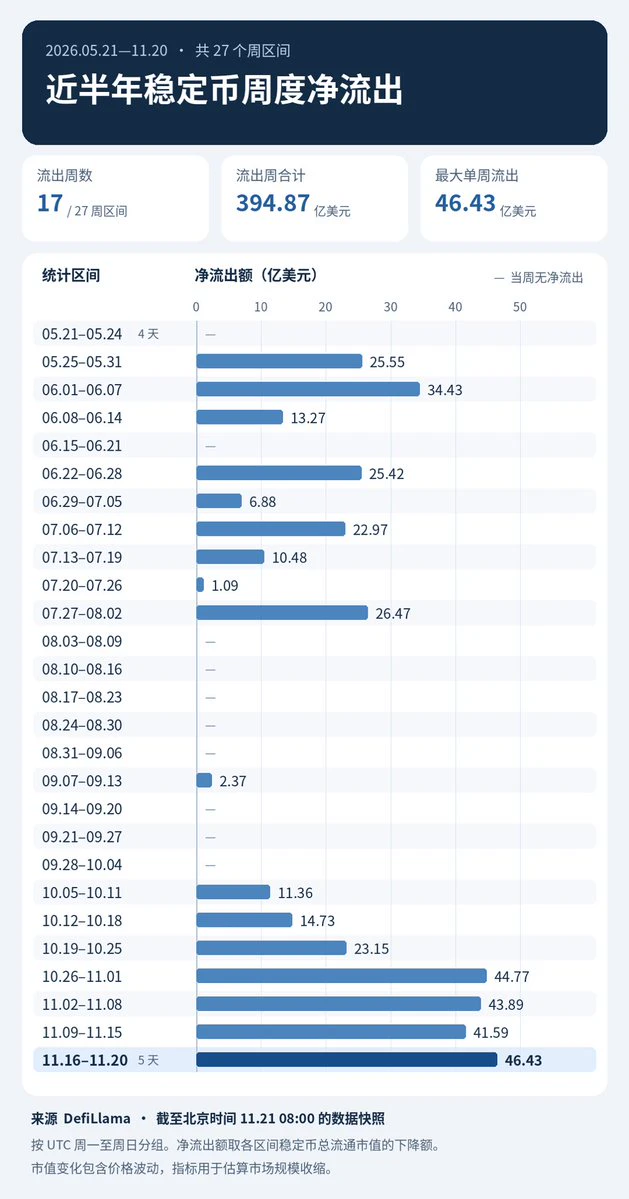
I had GPT take a look at stablecoin outflows over the past six months. Clearly, over the past month, everyone’s been cashing out and running for the exits like crazy...
post-image
🚨 $BTC Bull trap confirmed?
My take: The 60K–61K range is likely still hiding one final “sweep,” designed to shake out all at once those who can’t hold on and have weak conviction.
Once this round of clearing is over, the ride will get noticeably lighter, and the target will be set squarely on $100K.
Risk warning: The above is only my personal market view and does not constitute investment advice. The crypto market is highly volatile, so please be sure to manage your position size and control risk.
post-image
BTC-0.67%
Trenches
FIONA
F
bade
b
FIONA
B34n...pump
Market Cap
$.
Change
.
24h Vol
$.
Holders
.
PIEVERSE
P
bade
b
PIEVERSE
0x0e...25a9
Market Cap
$.
Change
.
24h Vol
$.
Holders
.
mihao
m
bade
b
mihao
4Cxj...pump
Market Cap
$.
Change
.
24h Vol
$.
Holders
.
PROS
P
bade
b
PROS
0x8b...9832
Market Cap
$.
Change
.
24h Vol
$.
Holders
.
CLAUDIA
C
bade
b
CLAUDIA
2j5S...W2ZM
Market Cap
$.
Change
.
24h Vol
$.
Holders
.
$EVAA Key decision point... breakout or pullback? EVAA is extending its strong bullish run, up 19.24% over the past 24 hours and reaching a high of 6.4516. However, the price is now approaching a major resistance zone, which could determine its next move. Current price: 6.3724 | Key resistance: 6.45–6.50 | Bullish targets: 6.80 / 7.00 | Immediate support: 6.00 | Pullback targets: 5.50 / 5.20. If EVAA breaks above 6.50 and holds there, it could rally again to 6.80–7.00. But if sellers cap the price near 6.45–6.50, it could start pulling back and retest 6.00 or even 5.50. The overall trend rema
post-image
EVAA-0.49%
  • 1
Pigs have something to look forward to now
When selling the meat, specify that they were raised on French fries😎
$BTC If you got trapped going long at 65000, bro, how do you get out? The whales are about to drain your account!

Holding a losing position isn't faith—it's handing money to the market makers.

BTC is currently at 58600, and you went long at 65000. How are you feeling now? Look at the data: $711 million liquidated in 24 hours, including $650 million in long positions. More than 90% of traders are holding on just like you.

Why has it fallen so hard? The AI crash in U.S. stocks dragged down crypto, and ETFs saw $580 million in outflows in a single day. What stings even more: 448 whale accounts
BTC-0.65%
  • 2
  • 2
$BTC
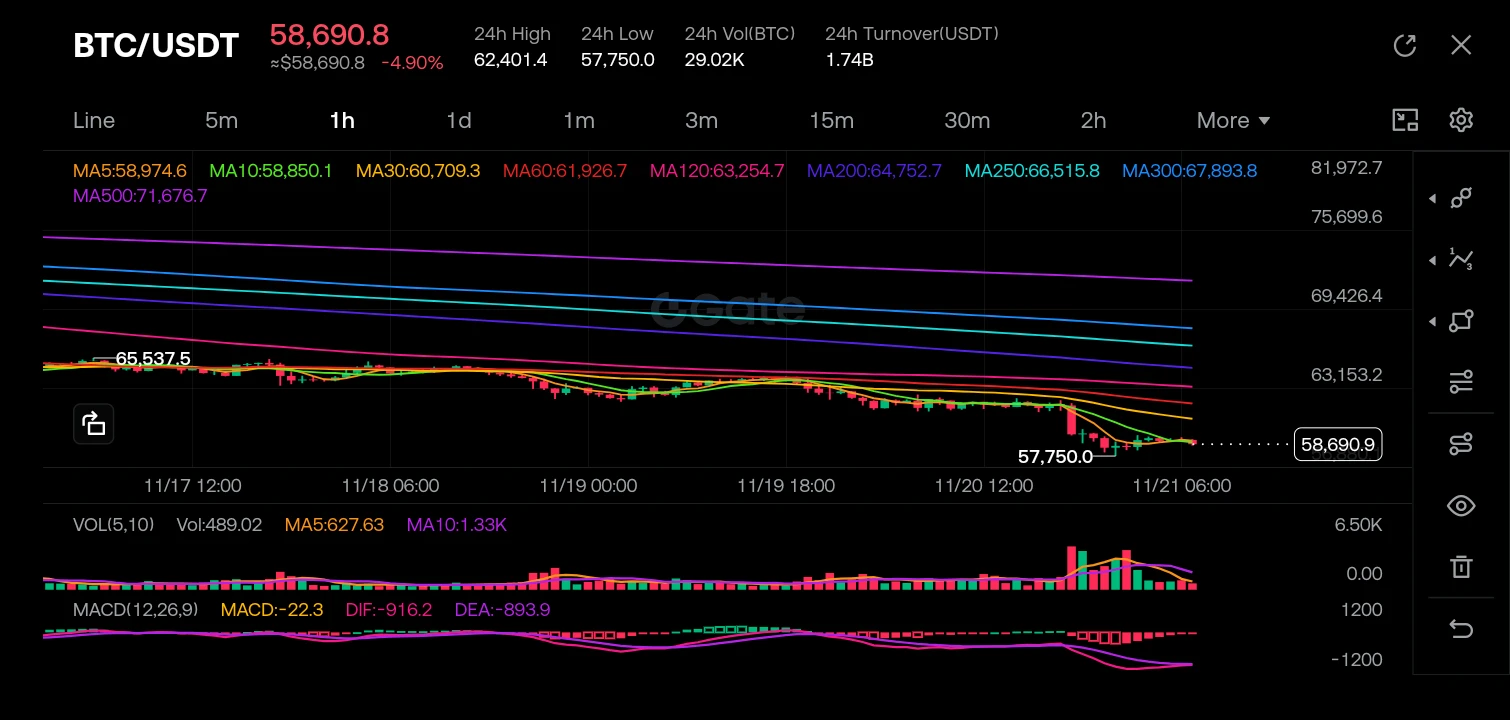
Bitcoin is currently trading at $58,690.8, down nearly 4.90%. The market is in a strong corrective phase, having broken down from a consolidation range. The price is currently resting on a critical support level after a sharp sell-off.

· Resistance: $60,000 - $61,900 (MA60 and breakdown zone)
· Critical Support: $57,750 (24h Low)
· Major Support: $57,400 (Lower Bollinger Band/Structure)

Kline Deep Analysis

· Trend: Strongly Bearish. The price is trading below all major Moving Averages (MA5 through MA200), which are fanning out downwards.
· Indicators: The MACD is in deep negative terr
post-image
BTC-0.67%
  • 2
MARKET UPDATE
live-cover
LIVE1,531
BTC-0.67%
Yesterday, I was still watching ETH head lower
Today, Ember spotted another move
F2Pool co-founder Wang Chun bought again
A few days ago, when ETH fell below $2,000
He first bought 10,992 ETH
Worth about $21.87 million
At an average price of about $1,989
Today, as it fell to around $1,600
He bought another 7,185 ETH
Worth about $11.74 million
The two purchases total 18,177 ETH
Worth about $33.61 million in total
At an average price of $1,849
The current price is still just above $1,620
The current price has yet to catch up with his average
For now, just note down the whale's buying figures
post-image
ETH-1.26%
🔹 Could ANT’s debut lift other AI stocks? What new trading opportunities could emerge for Nvidia an
live-cover
LIVE1,747
NVDA-13.84%
TSLA-7.56%
SPCX-7.38%
MU-13.88%
SNDK-15.99%
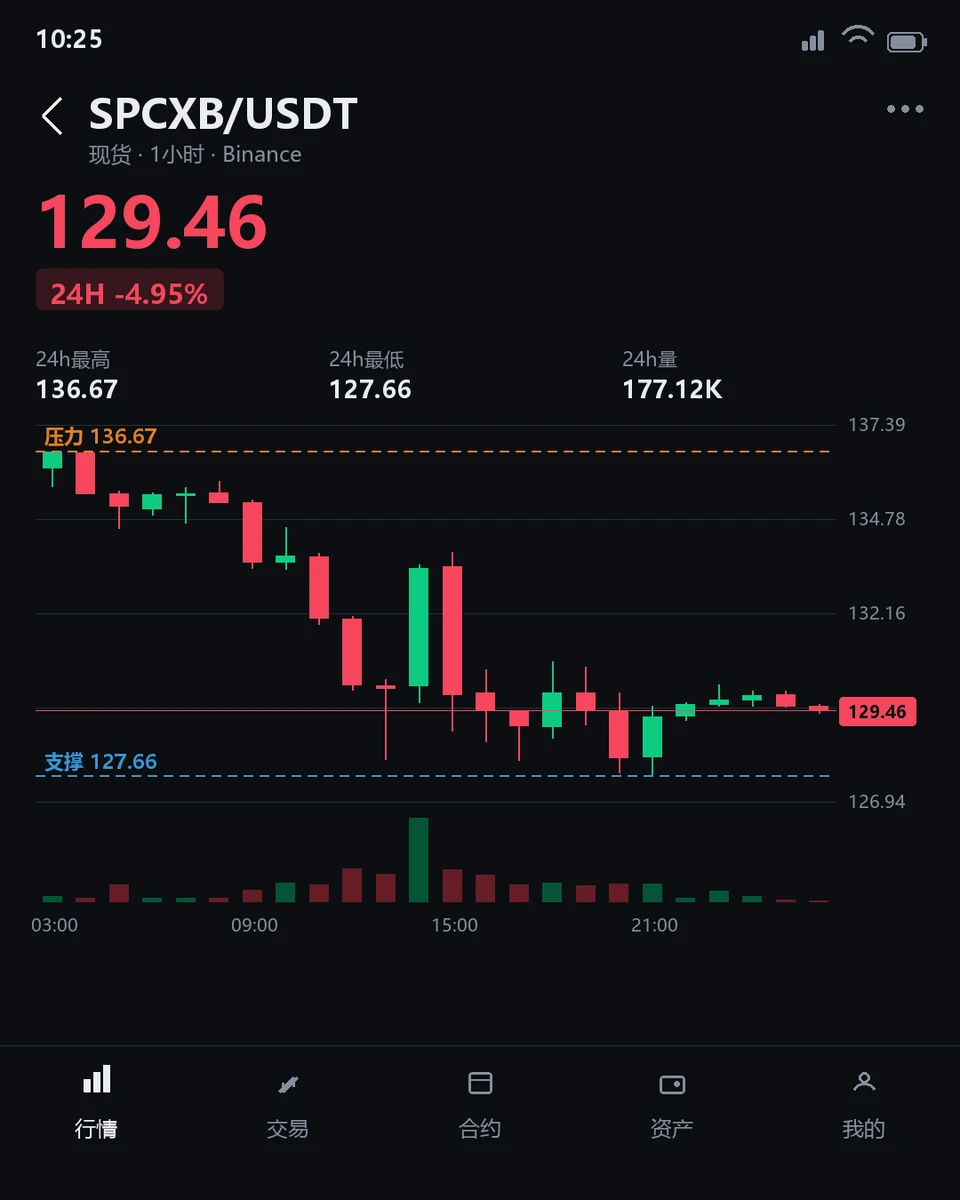
$SPCXB Is Oversold but Hasn’t Bottomed: A Battle Between Rebound Demand and Structural Weakness

$SPCXB is currently trading at $129.44, down 5.02% over the past 24 hours. The 1-hour RSI14 is 47.11 (neutral to weak), while the 4-hour RSI14 is 15.69 (significantly oversold), creating a divergence between indicators across time frames. This structural contradiction highlights the core tension in the current market: fading short-term momentum versus a medium-term trend that has yet to stop falling.

A key observation is that support on both the 1-hour and 4-hour time frames is at 127.66, but the
post-image
🏆 My Journey to the Top 20 | Gate 2026 Annual Gala

Being part of the Gate 2026 Annual Gala is a special moment for me. I'm grateful to see my name among the leading streamers, and currently I'm holding the TOP position in the live rankings.

But this journey is not just about rankings. It's about dedication, consistency, and the amazing community that makes every step worthwhile.

Now, I need your support to keep this position strong!

❤️ Let's make it happen together!

Here is how you can support me:

🔥 Join the Gate Annual Gala and support your favorite streamer.

🎁 Every 100 Support Poi
post-image
  • 4
Only this company would dare to make such an aggressive bet with its balance sheet. Recently, I saw claims that “Strategy’s net reserves have reached $35 billion.” My first reaction wasn’t to echo how big the number was, but to break down exactly what this “net reserves” figure measures. In the crypto and U.S. stock markets, Strategy has long been a leading example of a company that treats Bitcoin $BTC as its core reserve asset. But whenever people talk about “net reserves” or “reserve size,” the figures most easily conflated are the book value of assets, net value after debt, and the fluctua
post-image
BTC-0.67%
The best way to grow in crypto isn't just buying coins and waiting for profits. It's also about learning, sharing ideas, and being part of the community. 🚀

Every post is an opportunity to share knowledge, start a conversation, and create value.

I believe consistency matters more than perfection. Keep learning, keep sharing, and keep building with Gate. 💚

Let's talk:
Do you prefer earning through trading or creating crypto content?

#Gate #CryptoCommunity #WriteToEarn #CryptoTrading #Shareweekly
post-image
  • 1
BTC hit a new low
SPCX shares have also fallen below 130 again
Continue DCA buying BTC and ETH
DCA plan unchanged
Continue daily DCA buying of 20U of SPCX below 130

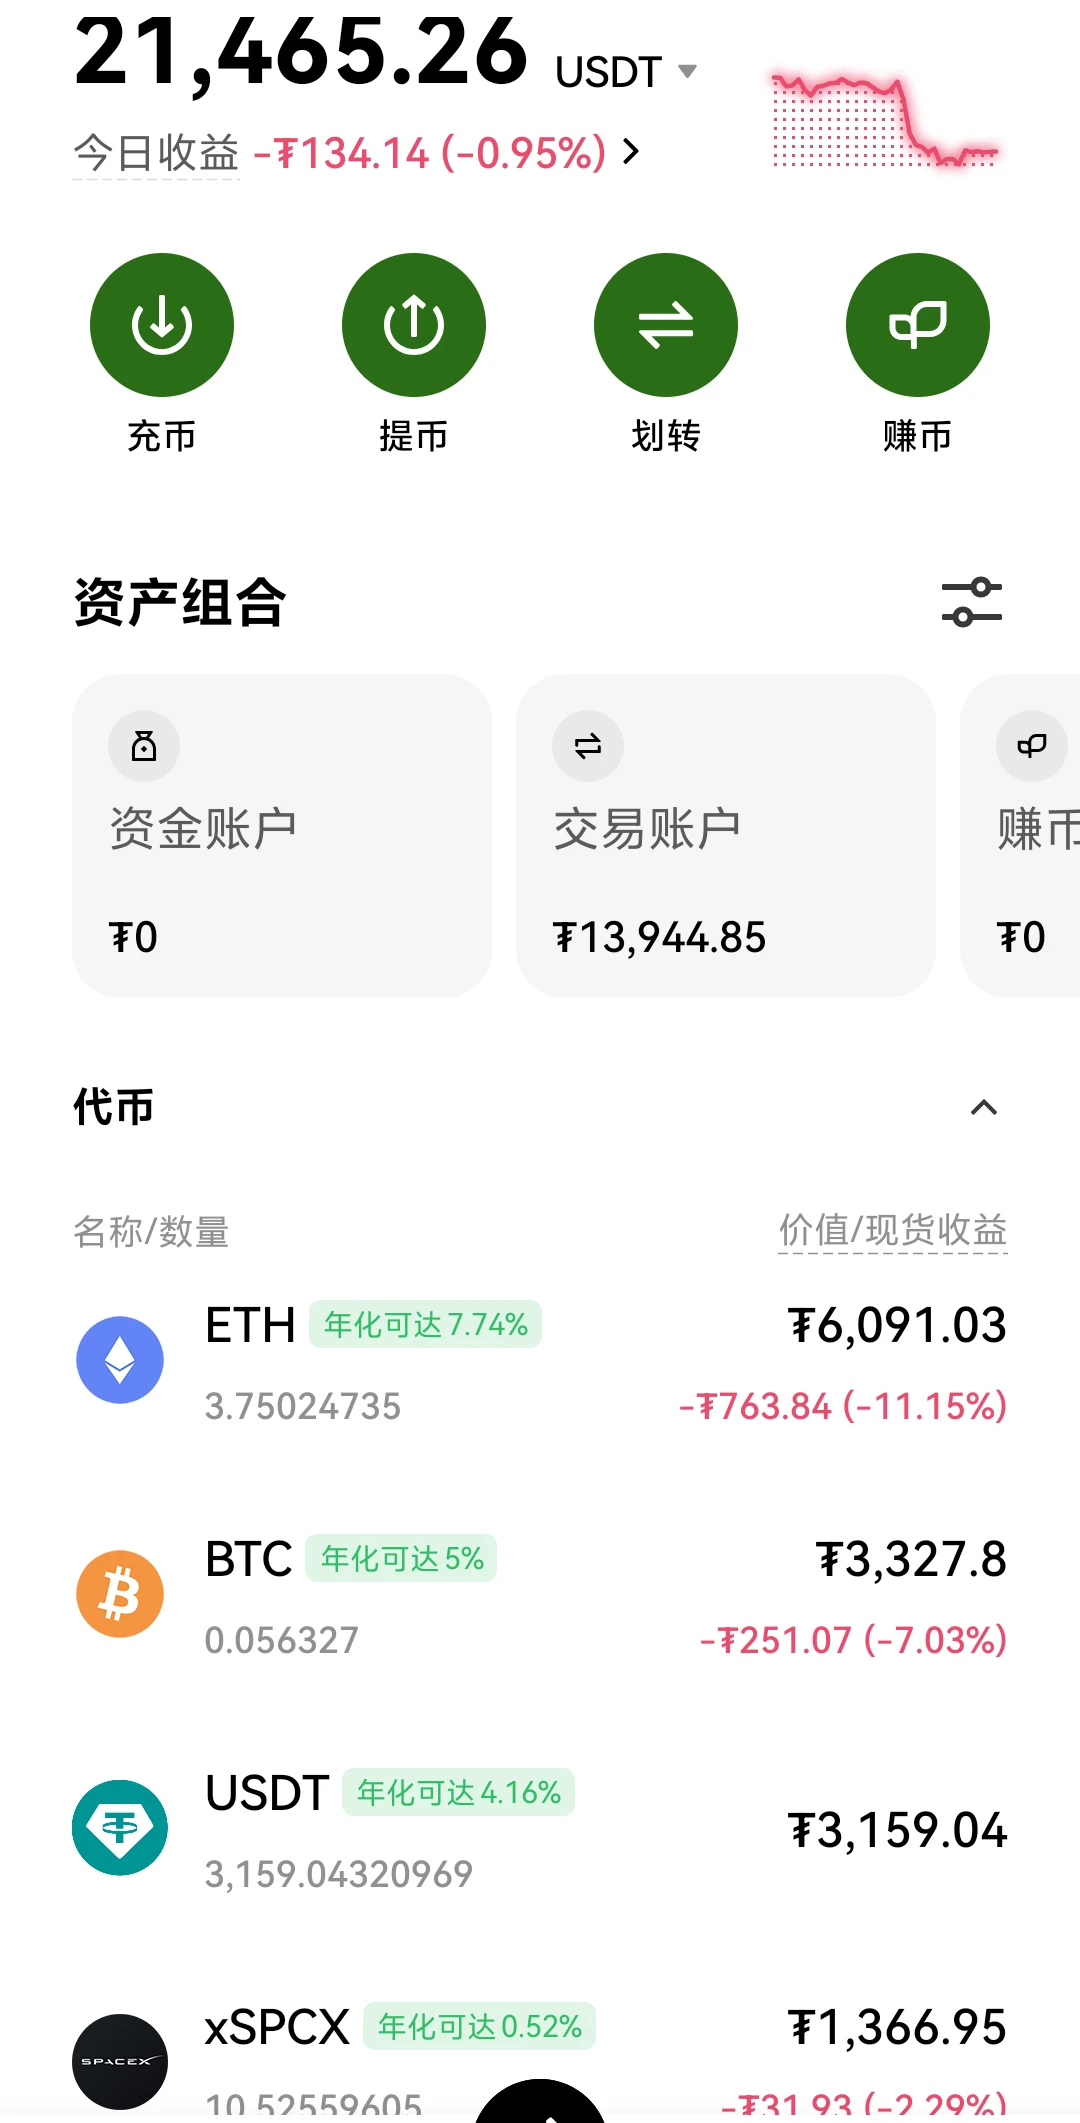
Day 310 of 20000U (2026.11.21)
Today's funds: 21465U
Start date: January 16, 2026
post-image
BTC-0.67%
ETH-1.26%
SPCX-7.38%
  • 3
$ZEC It has to fall, it has to fall, it has to fall, it has to fall, God bless, God bless, God bless
ZEC+1.16%
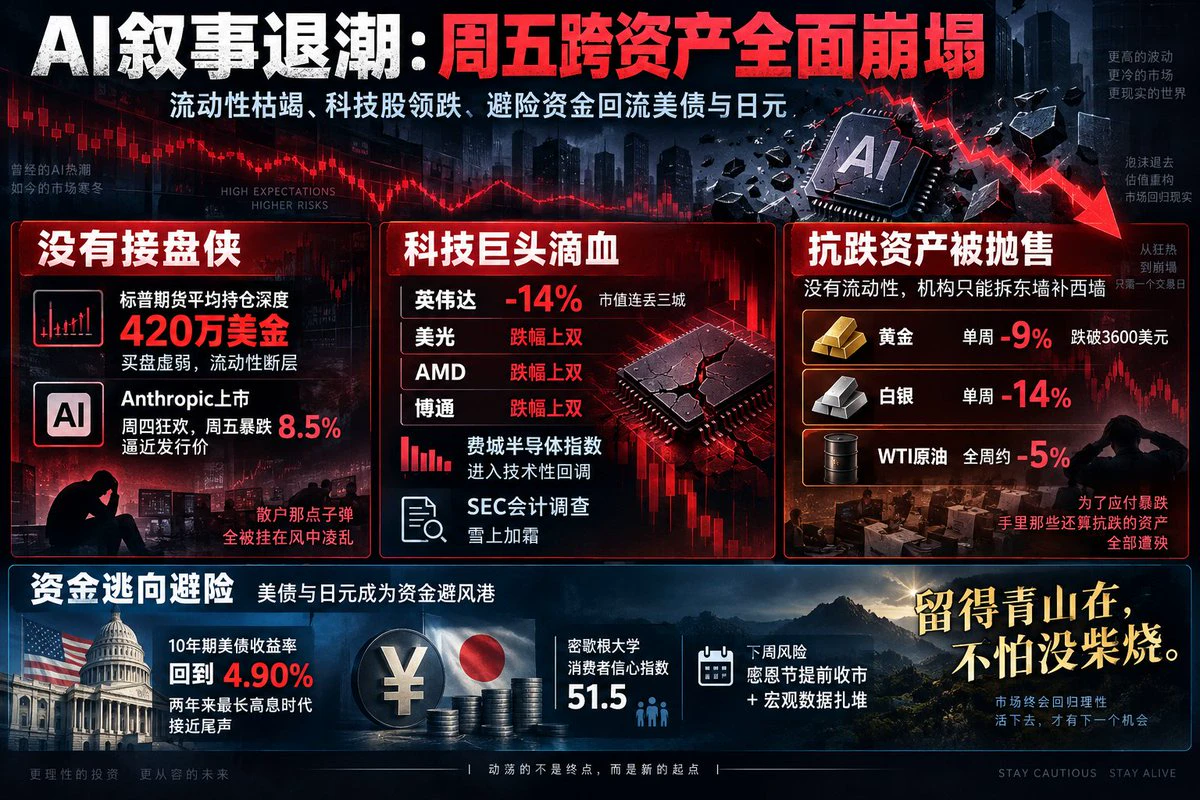
Let’s talk about Friday’s broad cross-asset collapse: it was really a chain reaction after the AI narrative faded.
There are simply no buyers stepping in. Goldman Sachs said average market depth in S&P futures on Wednesday was a mere $4.2 million, with bids nowhere to be found. Add Anthropic’s mega-sized liquidity vacuum, and after a day of celebration on Thursday, it plunged 8.5% on Friday, nearing its offering price. Retail investors’ meager firepower was left stranded.
Tech giants are all bleeding. Nvidia fell 14%, losing three market-cap thresholds. The SEC also piled on with an accounting
post-image
GS-6.73%
SPX+0.33%
ANT-8.68%
NVDA-13.84%
AMD-13.27%
The market is really bad
I’m looking for a rich older woman
post-image
#BTC跌至9月以来新低 BTC Under Global Liquidity Withdrawal: After Falling Below the 200-Week Moving Average, Is $57.8k the Bottom or Just a Waystation?

The most painful thing about this decline is not how far prices have fallen, but that it offers no chance to catch your breath. U.S. stocks, gold, silver, copper, and crypto assets have almost all fallen. From November 19 to 20, spot gold briefly dropped to around $3,525 per ounce, its lowest level since September 2025, bringing its cumulative decline this quarter to about 15%; silver fell to $41.25, platinum to $1,299, and LME copper lost nearly 9% f
BTC-0.67%
  • 16
  • 1
The day with the biggest drop wasn’t the most dangerous. The most dangerous was the next morning, in the minute you decided to add to your position.

Bitcoin BTC’s daily candle yesterday saw a huge surge in trading volume—the biggest day in nearly two months. The price plunged from $62,000 to $57,000, closing near the floor. With volume this high and the close near the low, it’s not retail investors getting scared off; it’s people holding the bags actually getting out.

The daily RSI has already hit extreme oversold territory. But oversold isn’t a buy signal—it only means selling now is cheap,
post-image
BTC-0.67%
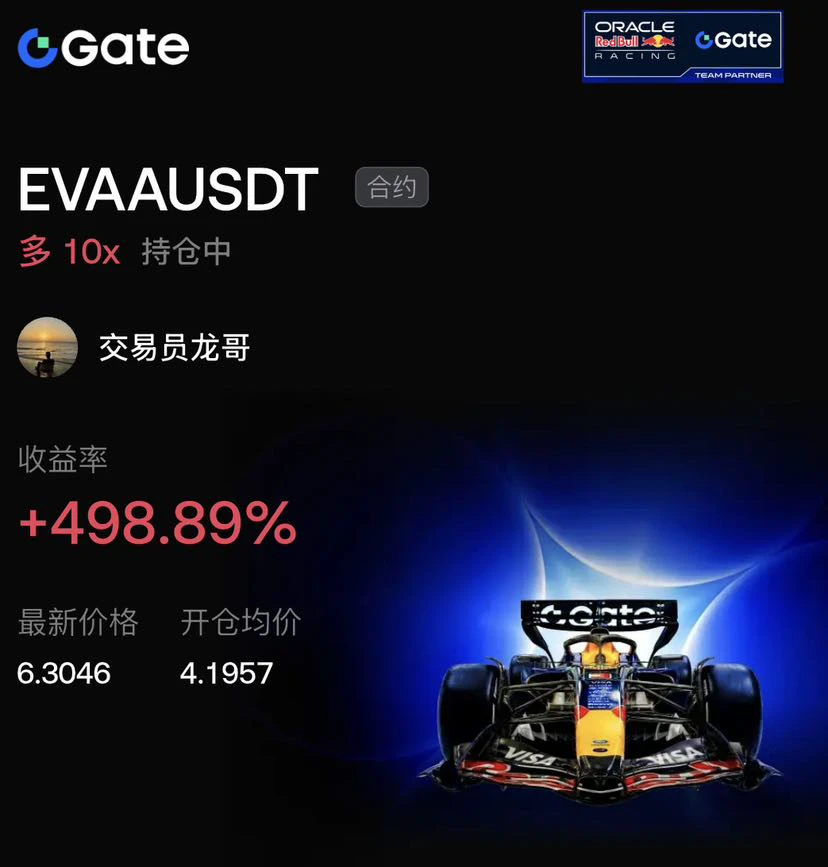
$EVAA I was going to exit this trade at +200%, but held back and stayed put. Now I’m up 498% in unrealized gains.

I opened a 10x long position at 4.1957. The market had just started moving up from the bottom on strong volume, and I expected a decent rebound. The price quickly surged to around 5.5, with gains exceeding 200%. I would have exited much earlier out of habit, but funds kept flowing in and the order book showed strong buying support, so I chose to keep a core position.

The price then continued climbing to 6.3046, with the return standing at +498.89%. Though there were a few deep pu
post-image
EVAA-0.42%
BTC-0.65%
ETH-1.23%
Load More

Join 40 M users in our growing community

⚡️ Join 40 M users in the crypto craze discussion

💬 Engage with your favorite top creators

👍 See what interests you

Trending Topics

BTCBreaksBelow60K

2.1M Views28.8K Discussing

BTC fell below $60,000 on November 20 for the first time since July, alongside a tech stock selloff and broader pressure on risk assets. Will $60K become resistance, or can BTC quickly reclaim it? What price or volume signals would convince you that selling pressure is easing?

GateDirectIPOPhase3ANTAllocates92100Shares

718.7K Views4.7K Discussing

NvidiaDropsNearly14Percent

301.8K Views7.5K Discussing

View More