Share your thoughts
placeholder
Article
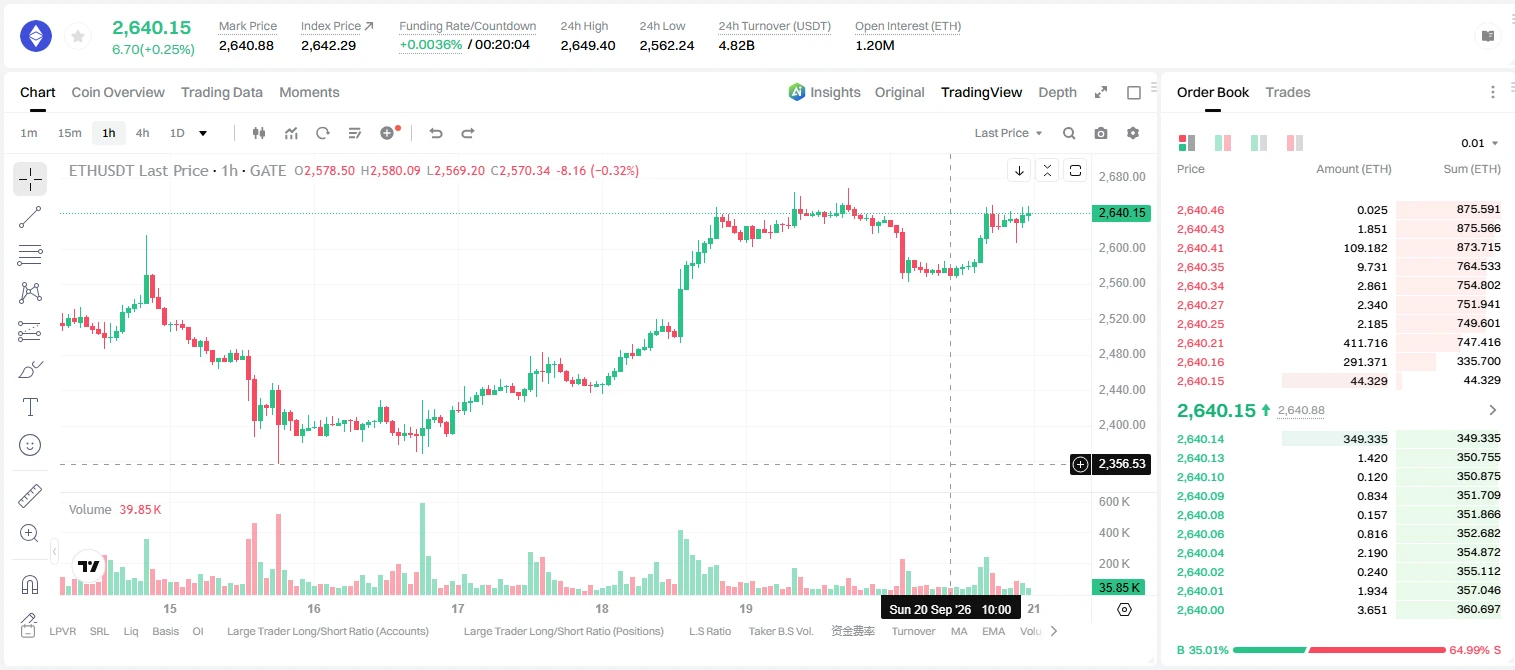
Insiders are whispering that ETH is about to break out above 2641.95.

$ETH /USDT - LONG

Trade Plan:
Entry: 2637.11 – 2646.79
SL: 2595.50
TP1: 2676.79
TP2: 2700.02
TP3: 2734.86

Why this setup?
Why now? The daily trend is firmly bullish, setting the stage for a continuation move. The 1h ATR of 19.36 tells us this market is active enough to push through the entry zone between 2637.11 and 2646.79 with real momentum. A 15m RSI at 56.62 confirms there is room to run before hitting overbought territory, targeting TP1 at 2676.79 and a deeper sweep at TP2 of 2700.02. This setup is invalidated if
post-image
ETH+2.75%
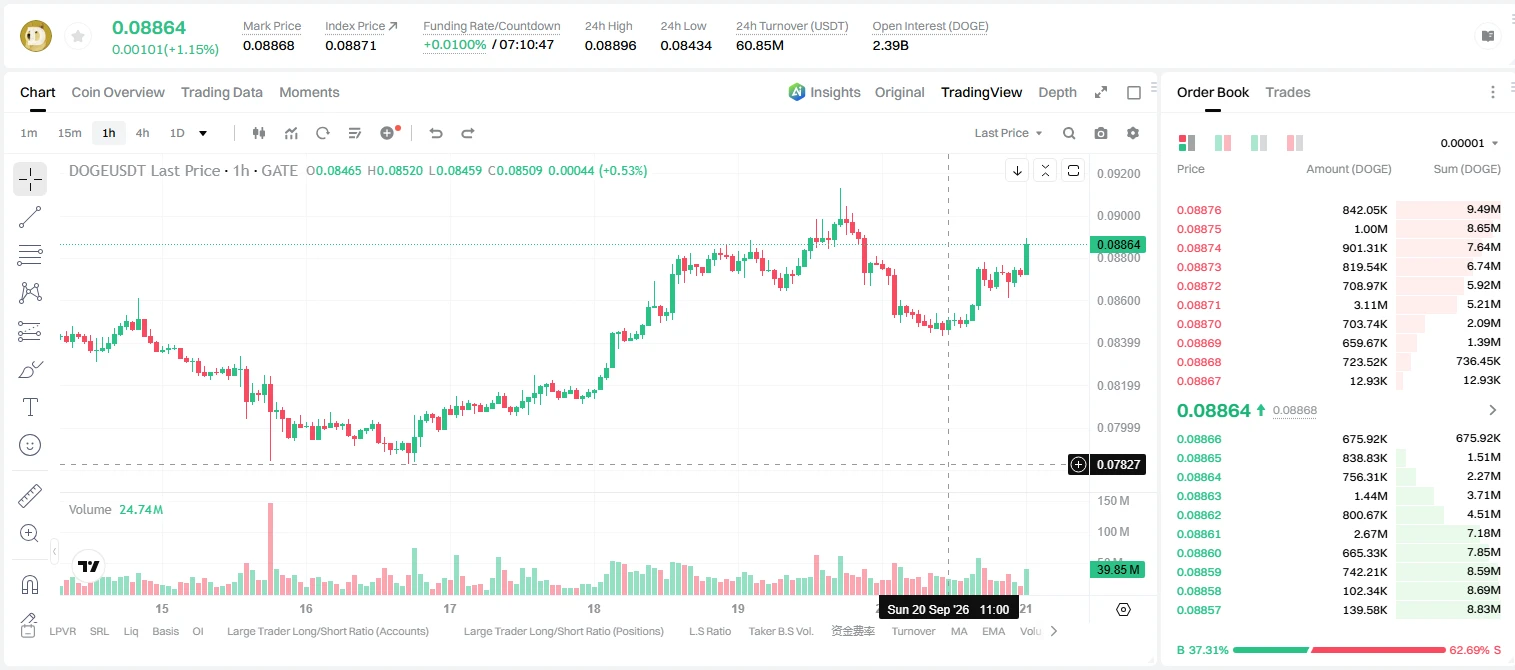
Nobody is talking about this quiet $DOGE /USDT setup hiding below the 1h price.

$DOGE /USDT - SHORT

Trade Plan:
Entry: 0.08860 – 0.08904
SL: 0.09093
TP1: 0.08724
TP2: 0.08618
TP3: 0.08460

Why this setup?
Why now? The daily trend is range, which means the market is coiling for a directional move, and the 1h ATR of 0.00088 shows volatility is tight enough to squeeze. The 15m RSI at 68.54 still has room to roll, keeping entry near 0.08882 valid for a short. The first target at 0.08724 captures the initial leg, while TP2 at 0.08618 doubles the reward before invalidation at 0.08588. If price
post-image
DOGE+2.88%
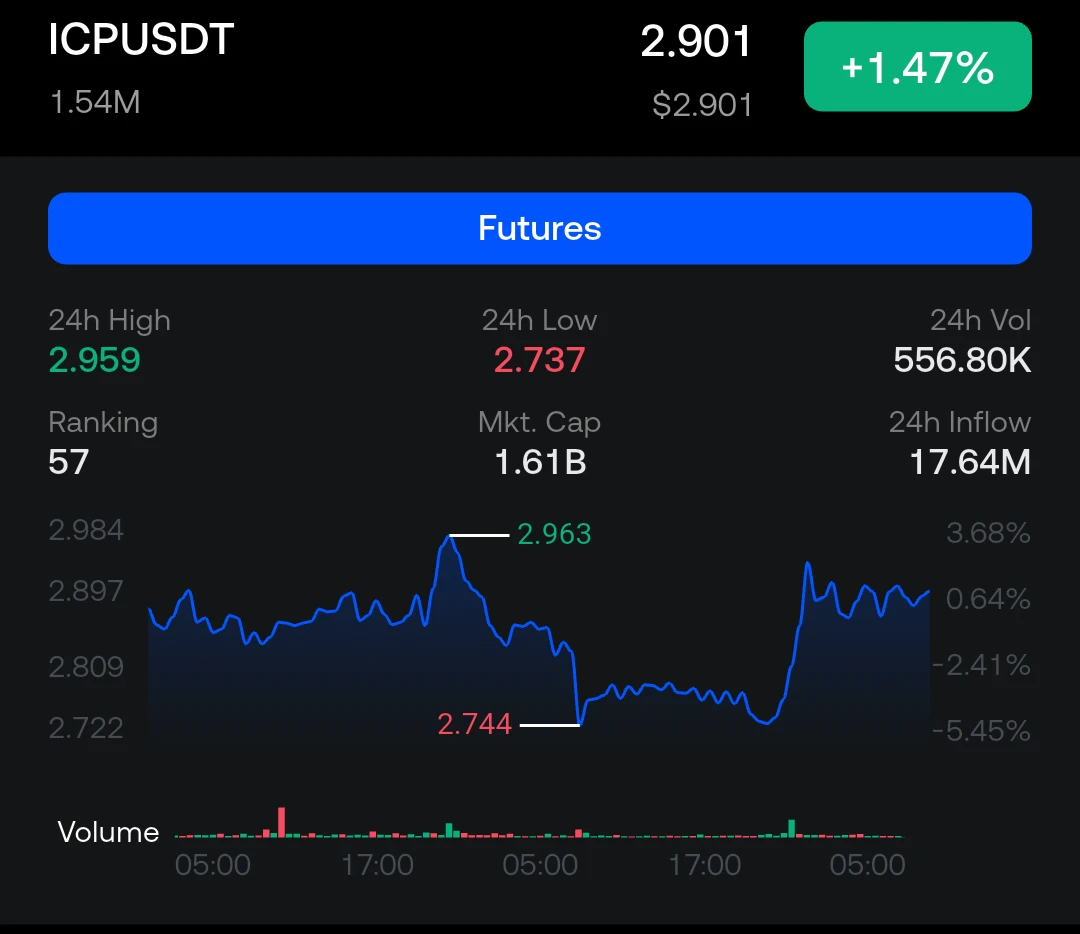
$ICP ‌ICP/USDT
Why did ICP get rejected? Because it couldn't handle the cloud storage of its feelings.
---
📉 Short
Entry: 2.940 – 2.960
TP1: 2.880
TP2: 2.820
TP3: 2.760
SL: 2.980
📈 Long
Entry: 2.760 – 2.780
TP1: 2.840
TP2: 2.890
TP3: 2.940
SL: 2.730
🔑 Key Levels
Resistance: 2.959 / 2.963
Support: 2.809 / 2.744 / 2.737
⚠️ Not financial advice. DYOR & manage risk.
post-image
ICP+3.39%
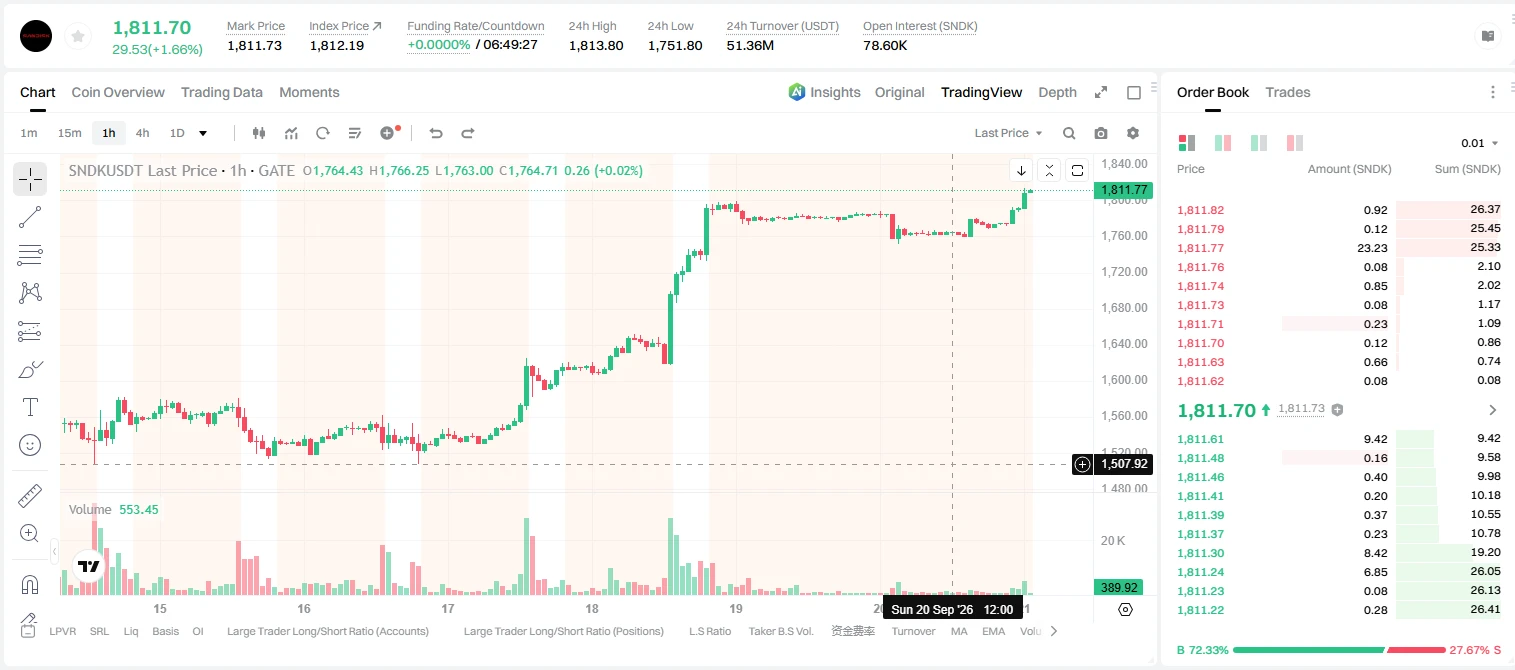
Why is everyone suddenly shorting SNDK right before a potential collapse?

$SNDK /USDT - SHORT

Trade Plan:
Entry: 1809.65 – 1813.67
SL: 1830.96
TP1: 1797.18
TP2: 1787.53
TP3: 1773.06

Why this setup?
Why now? The daily trend is range-bound, but the 1h ATR of 8.041869 signals a volatile expansion that can drive a sharp move. The 15m RSI at 84.74 shows extreme overbought conditions, suggesting exhaustion among recent buyers. With the 1h price at 1811.57, the entry zone sits between 1809.65 and 1813.67, offering a precise short opportunity. The first target at 1797.18 and the second at 1787.5
post-image
SNDK+1.40%
This is positive news for both the Chinese and US stock markets!
The tweet about the White House state banquet posted by Trump's wife refers to this week's China-US state banquet. At the 7-second mark of the video, there is a shot that, when enlarged, shows a welcome card for the Chinese side with the word CHINA on it.
What is fairly certain at present is that, in addition to representatives from China and the US, the guests will also include Tesla's Elon Musk, Amazon's Jeff Bezos, NVIDIA's Jensen Huang, OpenAI's Sam, Apple's Tim Cook, and others.
The tweet about the White House state banquet
post-image
SNDK+1.40%
XIAOMI+0.44%
CXMT+2.74%
  • 2
26.4% in a month, 19.2% in a day: KMNO front-runs on surging volume
$KMNO It completed 19.2% of a month's 26.4% move in one day, with volume 4.175 times the 30-day average—who would have expected that? The current price is 0.03304. I'm bullish, but will only buy dips and won't chase a big green candle.
First, the daily MACD formed a golden cross above zero (1 day ago), with the red histogram bars expanding; RSI at 63.8 is strong but not yet overbought. Second, the phase script signals an offensive phase: breadth is 53/28, and BTC 81230 is holding steadily above ma7 78545.
Resistance above: 0.0
KMNO+20.86%
Insiders are calling SYMBOL a trap after the 1h spike.

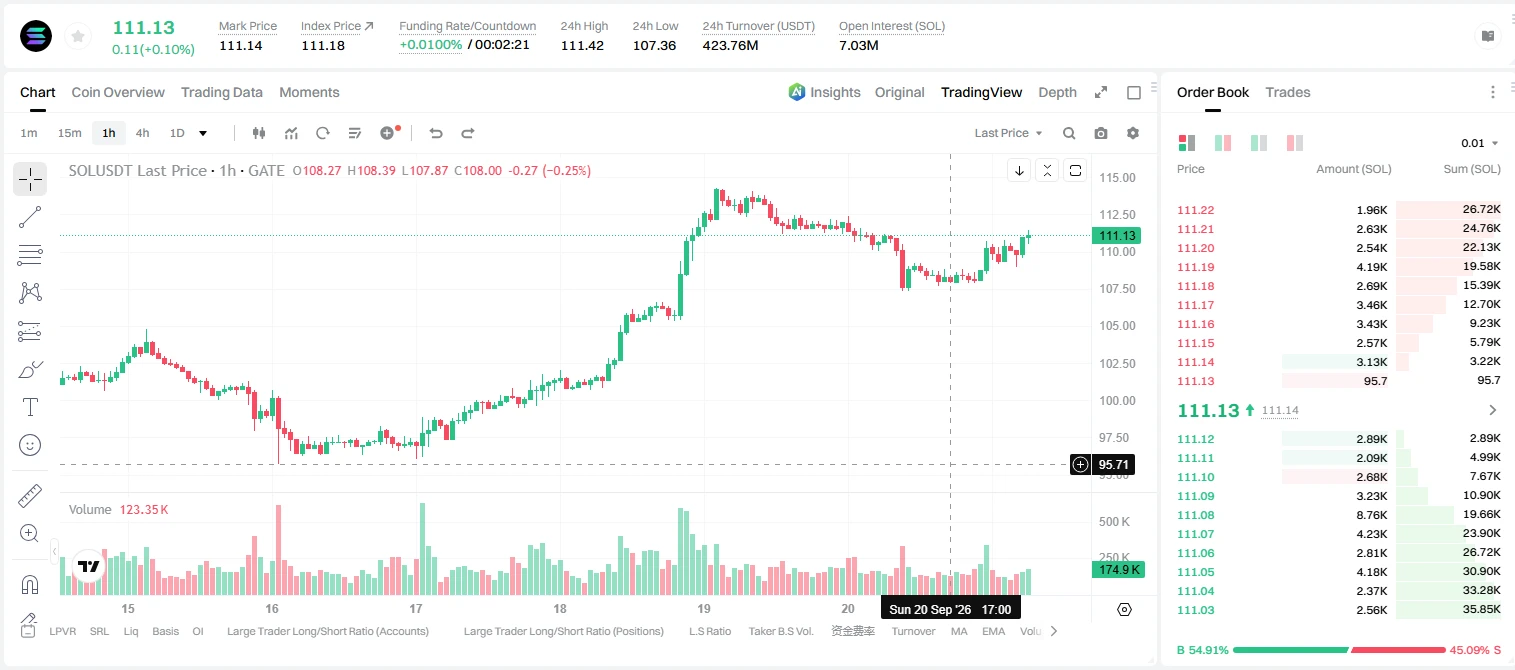
$SOL /USDT - LONG

Trade Plan:
Entry: 110.92 – 111.44
SL: 108.72
TP1: 113.02
TP2: 114.25
TP3: 116.09

Why this setup?
Why now? The daily trend is bullish, but the 15m RSI sits at 62.16, suggesting momentum is still fresh without being overextended. The 1h ATR of 1.023247 confirms enough volatility to fuel a move toward the entry zone at 111.18. From there, TP1 at 113.02 and TP2 at 114.25 represent realistic extensions if buyers hold control. The invalidation level at 104.24 is the hard line that separates a healthy pullback from a full
post-image
SOL+2.58%
Financial News, Crypto Market Updates, Real-World Strategies
live-cover
LIVE1,964
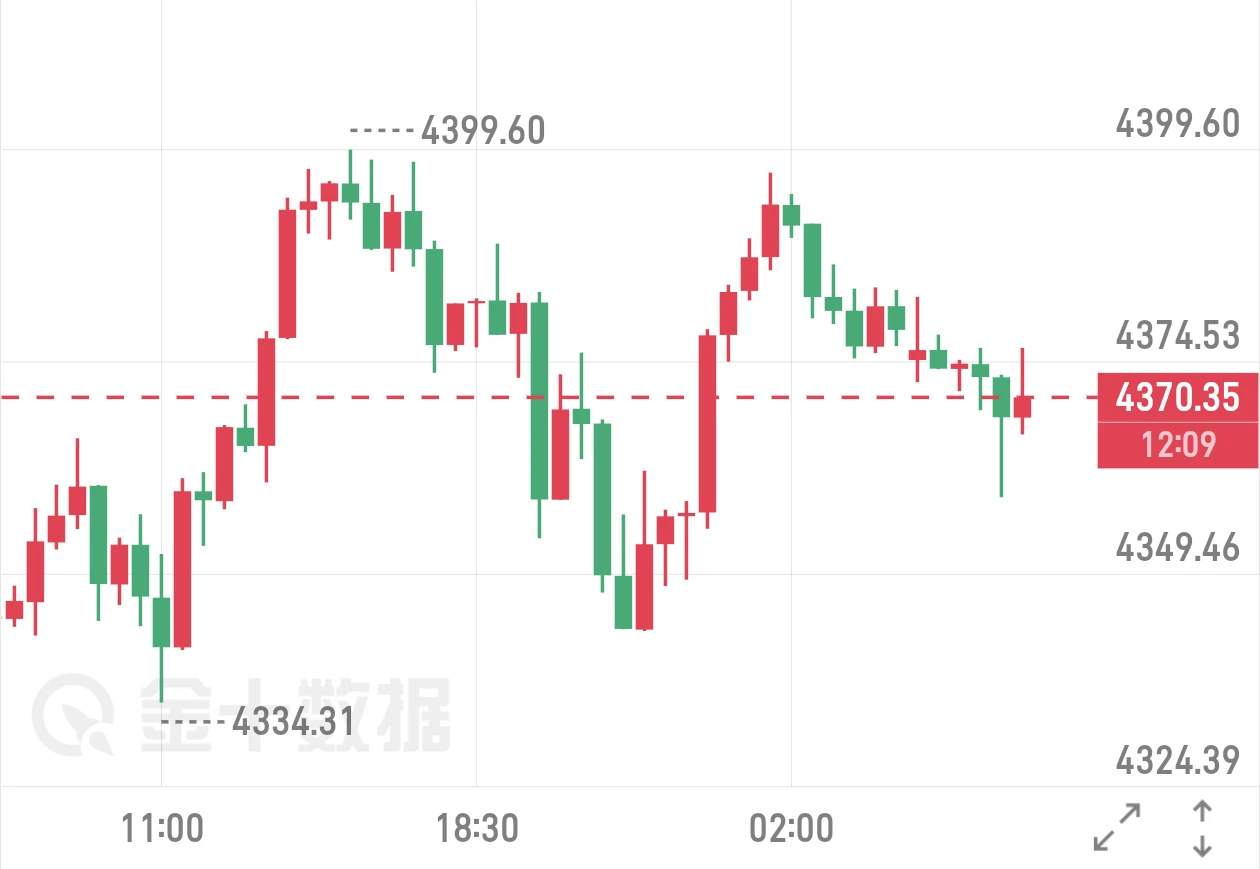
$XAUT 9.21 Morning Gold Outlook
Gold’s broader trend is relatively steady. In the short term, it is currently consolidating, moving averages are gradually stabilizing, and the market’s lows continue to rise, with clear support and resistance boundaries within the range.
In the short term, the market will most likely remain range-bound with a bullish bias; the strategy is to focus on buying on dips.
Trade reference: Build long positions in batches within the 4330–4350 range, targeting 4400–4450 ​​​
post-image
XAUT+0.13%
#GateSquareMidAutumnReunion #MU #mu
Micron Technology at $1,016: Memory Supercycle Meets a Critical Test
Micron Technology (MU) is trading around $1,016, keeping the stock near a major psychological milestone after an extraordinary AI-driven rally. At this price, the market is no longer asking only whether memory demand is strong. The bigger question is whether earnings growth, HBM demand and tight DRAM/NAND supply can continue supporting the valuation.
The $1,000 Line Matters
The $1,000 level is now an important psychological and technical reference. Holding above it would keep short-term mo
MU+3.80%
  • 17
  • 2
Watching the market nonstop got annoying; once I turned it off, I could see things more clearly, and with my eyes off the screen, my heart stopped panicking.

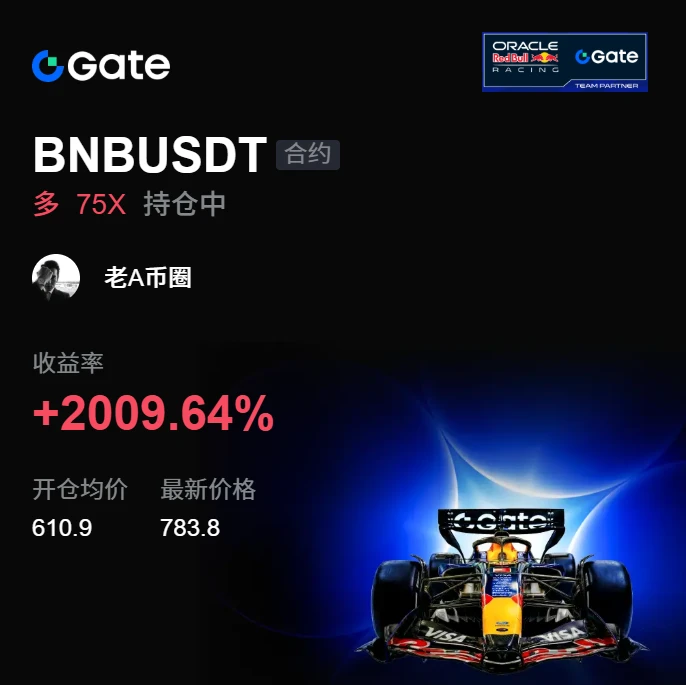
A few days ago, I glanced at $BNB before bed. Buying pressure was strengthening and capital was quietly flowing in. I said then not to panic-sell at this level; if buyers stepped in on a pullback, just ride it. As a result, it went from 610.90 to 783.9, delivering +2009.06%—straight to the moon.

It was truly sluggish before, but the breakout feels truly great.

Hold as long as the trend remains intact; run if it breaks down. Don’t fa
post-image
BNB+2.83%
DOGE+2.88%
LAB-3.85%
Regarding Bitcoin’s market trend, many people believe there will be a deep correction, while the veteran hunter’s view is that after consolidation, it will break upward and surge straight to 90k without a major correction. These are all good entry opportunities, so don’t wait for 76,000 or even hope for 60k—don’t imagine you can buy at the absolute bottom. You haven’t experienced the pain of missing a major move while pursuing an extreme low and then regretting it deeply. If you’ve experienced that even once, you won’t remain deeply regretful about pursuing an extreme low. This is only my pers
BTC+0.93%
MSTR+16.35%
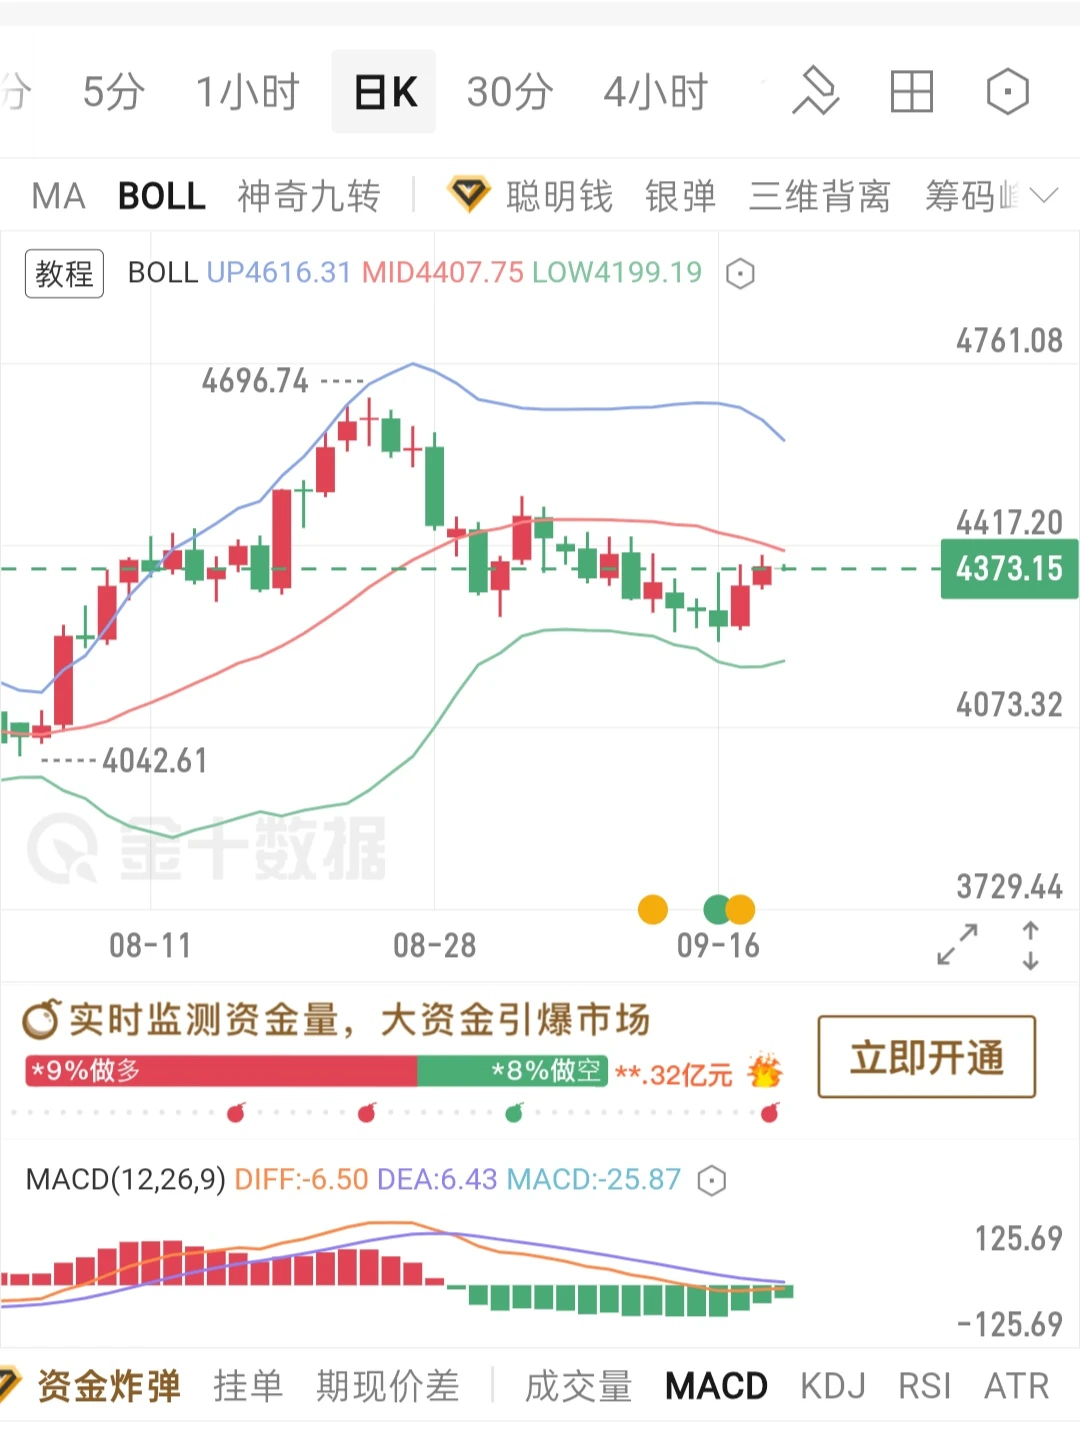
9/21 Gold:
After retreating from the high near 4696, gold prices are currently fluctuating near and below the middle Bollinger Band, with the middle band around 4407 becoming an important resistance level above. The Bollinger Bands are narrowing overall, the major move is temporarily on hold, and the market has entered a range-bound consolidation phase.
DIFF remains below DEA, the death cross persists, and the green bars remain, indicating that the daily correction trend has not yet ended. However, the green bars have not expanded significantly, so short-term downside momentum is limited, with
post-image
GLDX+0.20%
PAXG+0.13%
Layout for Bitcoin, Ethereum, and Dogecoin
live-cover
LIVE1,807
Overall market: All four coins have risen in a synchronized rebound. They are currently in a short-term high-level consolidation phase—a period of consolidation following the rally—with potential long shakeouts and short traps. Do not blindly chase highs.
General risk-control discipline
“Market diagnosis card,” covering only the overall market condition: post-rally consolidation, high-level volatility, long shakeouts, short traps, and trading discipline.
Strategy sharing
1. BTC|Market diagnosis: High-level consolidation after the rally; do not take sides prematurely
2. ETH|Market diagnos
BTC+0.93%
ETH+2.71%
SOL+2.58%
BNB+2.79%
I heard that October 12 was both the launch of this bull market and the bottom of this bear market. I wonder if that’s really true? From August to September, one huge bullish candle directly stunned most rigid traders and old-school bagholders. Everyone was waiting to buy the dip at 48,000, but the market makers gave them no chance; after one V-shaped rally, 90% of retail traders missed the move. Now we’re near the previous high around 83,000 again. If it breaks through on heavy volume, then I really can’t see BTC below 60,000 anymore. So miserable—I missed the move too. The current pattern sh
post-image
BTC+0.93%
ETH+2.71%
CL-2.63%
MSTR+16.35%
PAXG+0.13%
Many people rush to short when they see RSI overbought, which is one of the most common trading misconceptions. Overbought only indicates strong momentum; it does not mean the trend will reverse immediately. Especially in a structure with bullish moving-average alignment and a persistently positive MACD histogram, shorting against the trend is betting your account on sentiment.
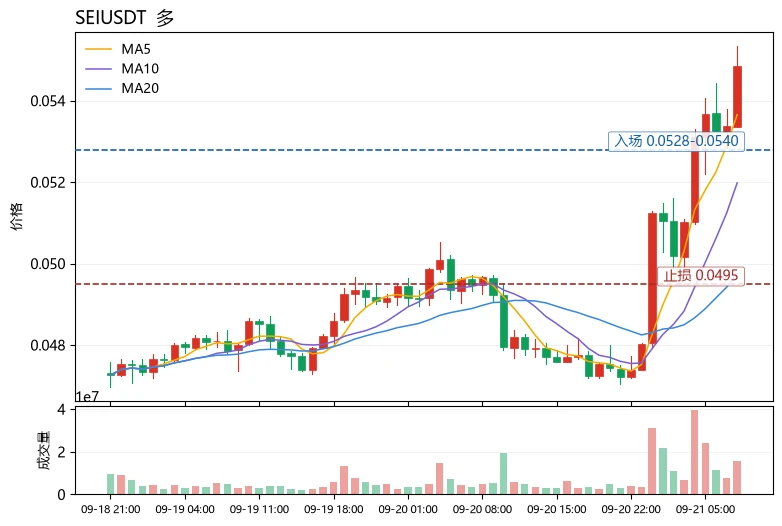
$SE Current price is 0.05486, up 11.26% over 24h. Technical breakdown: MA5=0.053654 is clearly above MA20=0.0497625, with short- and medium-term moving averages aligned bullishly, so the trend direction leans bullish;
post-image
ENA+5.03%
SUI+10.55%
I’ve been watching NEAR all morning, and this price action is seriously impressive—it directly broke through the previous resistance level. Funds are really going for it in this AI narrative wave. As the sector’s veteran leader, NEAR has started seeing volume first, while TAO and WLD will probably be unable to hold back from following higher. That’s how sector rotation works: the leader moves first, followed by catch-up gains from the rest of the sector. The data shows that this breakout came with genuine volume, not the kind of price surge driven by a lack of volume. Search interest in AI-rel
TAO+1.39%
WLD+2.45%
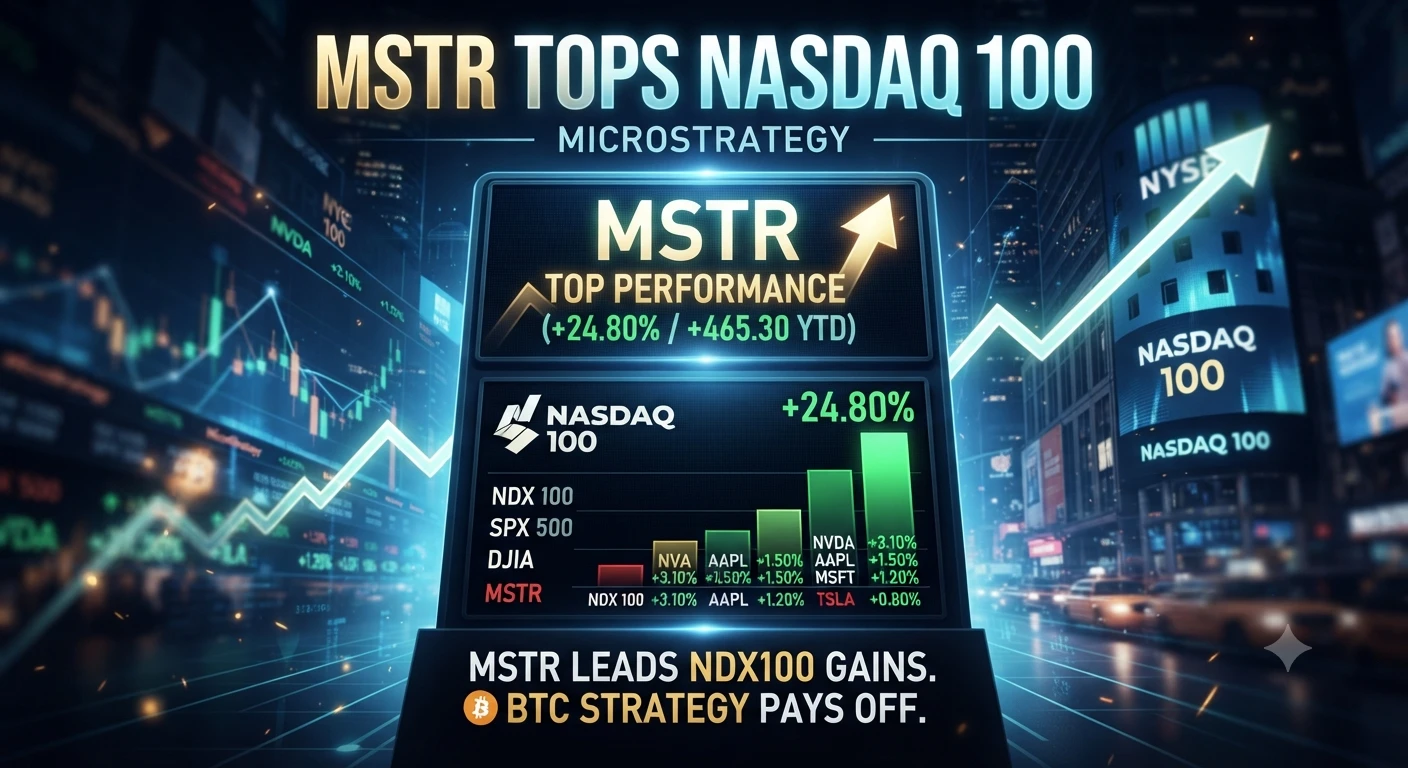
#MSTRTopsNasdaq100 MicroStrategy’s arrival in the Nasdaq-100 is more than a headline. It is a structural event for both the crypto market and traditional finance. When a company like MicroStrategy, now often branded as Strategy, earns a place in one of the world’s most followed equity indexes, it signals that Bitcoin exposure has moved from the fringe to the mainstream. The Nasdaq-100 is not just a list of technology companies. It is the benchmark behind some of the largest passive investment products in the world. Inclusion means index funds and ETFs that track the Nasdaq-100 are now forced
post-image
9. 22nd Intraday Strategy: Geopolitical Easing, Supply Returning to the Border, Air Refueling, Buy Low in the Range
The market is trading on the “expectation of geopolitical easing brought about by Qatar’s mediation,” not on a peace agreement that has already been finalized. This is a market phase driven by growing expectations, characterized by shallow pullbacks and rapid recoveries, making deep retracements unlikely.
As long as negotiations continue, the market will not return to the previous pessimistic pricing of an all-out war. Therefore, whenever a pullback occurs intraday, funds will bu
ETH+2.75%
  • 1
Load More

Join 40 M users in our growing community

⚡️ Join 40 M users in the crypto craze discussion

💬 Engage with your favorite top creators

👍 See what interests you

Trending Topics

MSTRTopsNasdaq100

74.45k Views3.13k Discussing

Strategy (MSTR) has gained about 48% over the past month, making it the best-performing stock in the Nasdaq 100, while Bitcoin rose roughly 12% over the same period. The company holds 845,050 BTC with a cumulative cost basis of about $63.73B. MSTR is not a pure Bitcoin proxy — its price swings can be more extreme. Can this rally last?

Gate Tops 24H Net Inflows Among Exchanges

26.66k Views3.7k Discussing

BTCRetakes80K

57.59k Views60.83k Discussing

View More