Square
Following
Hot
News
Profile
Share your thoughts
placeholder
Article
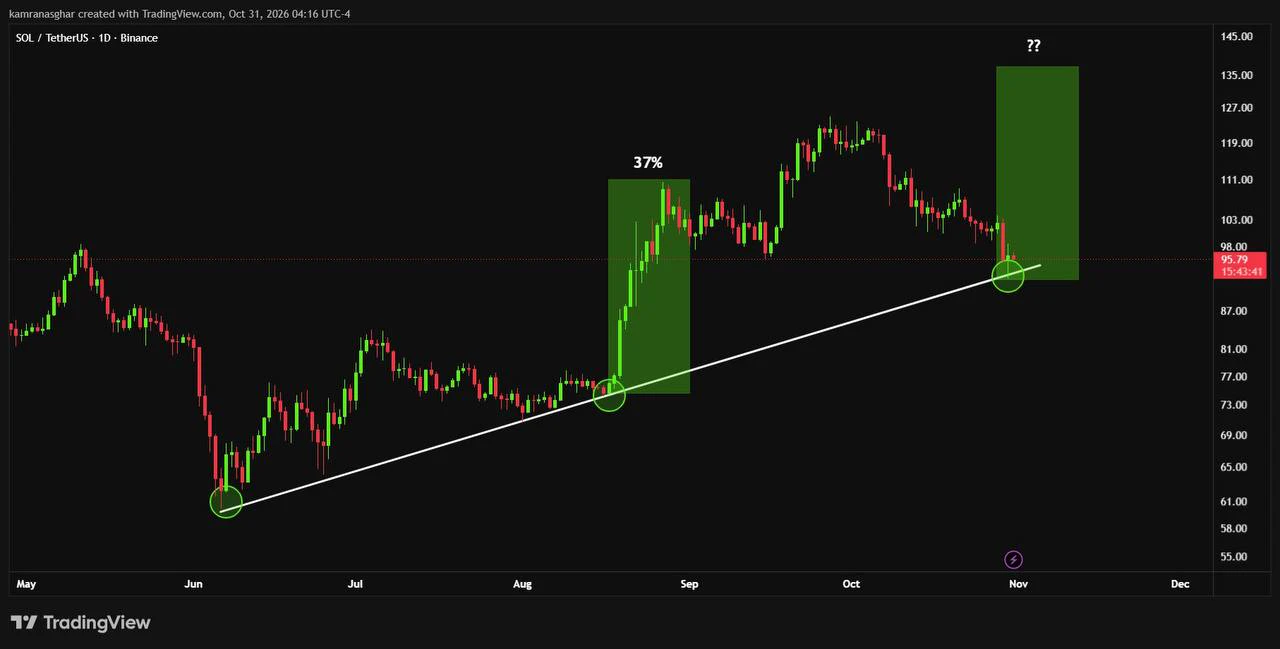
$SOL is testing rising support near $92 to $95 on this chart.
Holding here and reclaiming $103 could open room toward $111 and $120. A break below the trendline would weaken the setup.
Will buyers step in again?
#SOL #Solana #BTC大跌 #IntelBeatsEarningsButStockPlunges #StrategySTRCNears100ParValue
post-image
SOL-0.77%
  • 4
  • 1
$BTC The 4-hour bullish divergence structure received a response on the 2-hour candlestick chart.
But it’s also important to note that the 2-hour MACD fell too deeply, so for it to rally, it needs a “second dip” structure—in other words, there needs to be a downward move before it can rise.
Why is that? Because people who bought the dip here will want to sell as soon as the price rises, triggering some selling.
That’s why there’s a “second dip”: technical analysis reflects the trading psychology behind it.
People who bought the dip at 76325 will want to sell as soon as the price rises a littl
post-image
BTC-0.65%
Trenches
IDOL
I
bade
b
IDOL
0x3b...ab07
Market Cap
$.
Change
.
24h Vol
$.
Holders
.
SAFU
S
bade
b
SAFU
0x7c...7777
Market Cap
$.
Change
.
24h Vol
$.
Holders
.
Q
Q
bade
b
Q
0xc0...0589
Market Cap
$.
Change
.
24h Vol
$.
Holders
.
ZIG
Z
bade
b
ZIG
0x8c...1145
Market Cap
$.
Change
.
24h Vol
$.
Holders
.
STONK
S
bade
b
STONK
6GmA...UNgx
Market Cap
$.
Change
.
24h Vol
$.
Holders
.
This gold sell-off is full of opportunities. The brutal crash with no rebound means a massive buying opportunity is coming. Next, will it be a violent rebound or a sickly decline? Worth looking forward to $INTC ‌$XAUT
post-image
INTC-28.49%
XAUT+0.34%
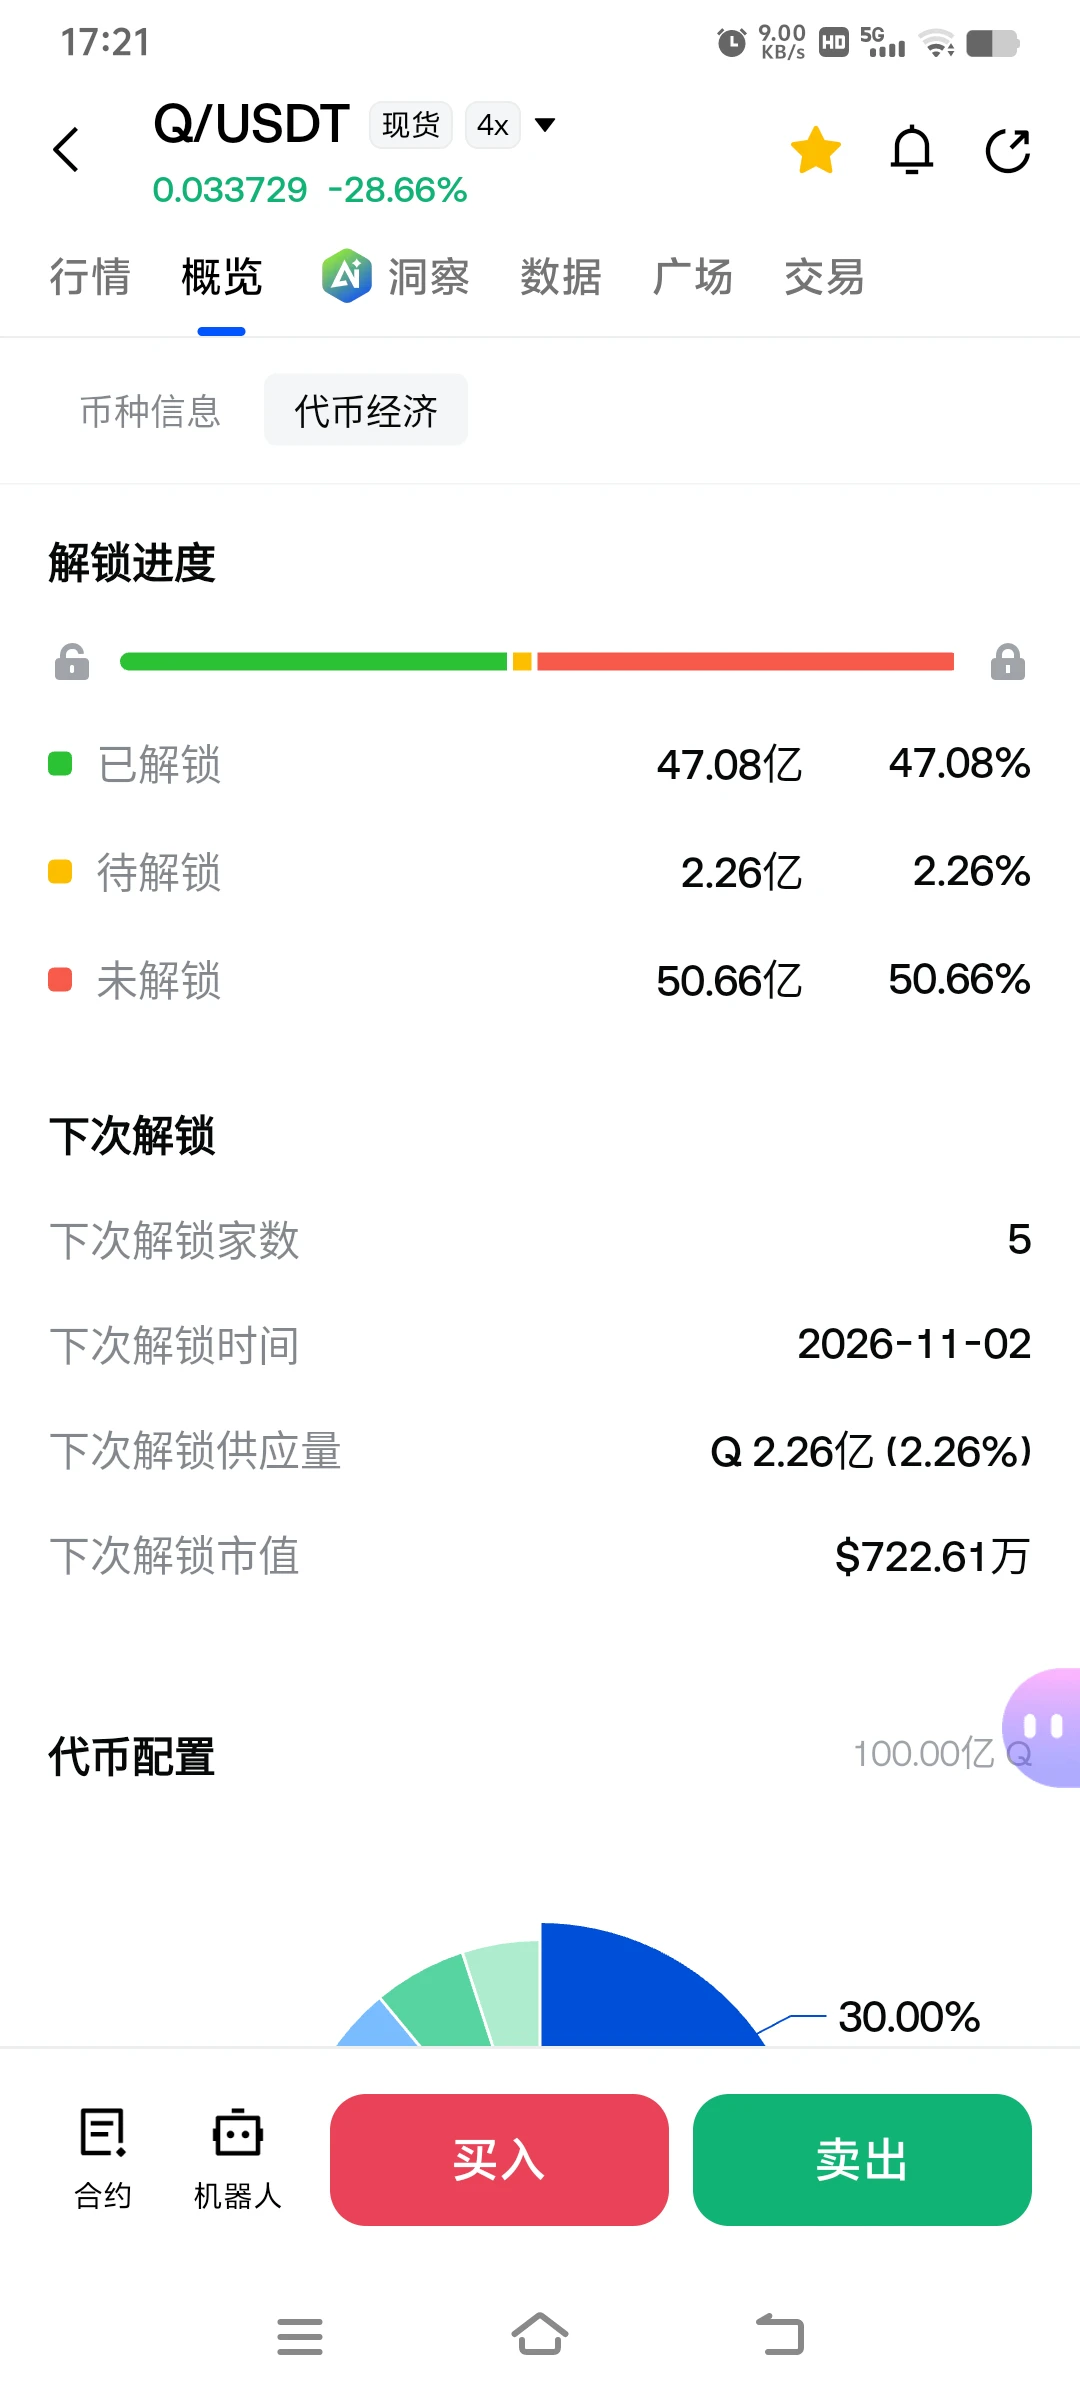
$Q It looks like it's pulling back, but theoretically it's trying to lure buyers in at higher prices again. Let's see—over 200 million more unlocks the day after tomorrow. Do you think it'll rise next or keep falling?
post-image
Q-28.72%
$IDOL The first and second targets of the short trade have almost been reached, and the outlook still looks bearish for now
post-image
IDOL-6.71%
Let’s see what people living in different environments like.
Total crypto market cap exceeds $2.60 trillion, with Bitcoin dominance at 59.9
live-cover
LIVE1,912
Been playing with this token launcher — deployed a test token in about a minute, no code, keys stay in your own wallet. zapmint.x y z
TSTBSC-1.03%
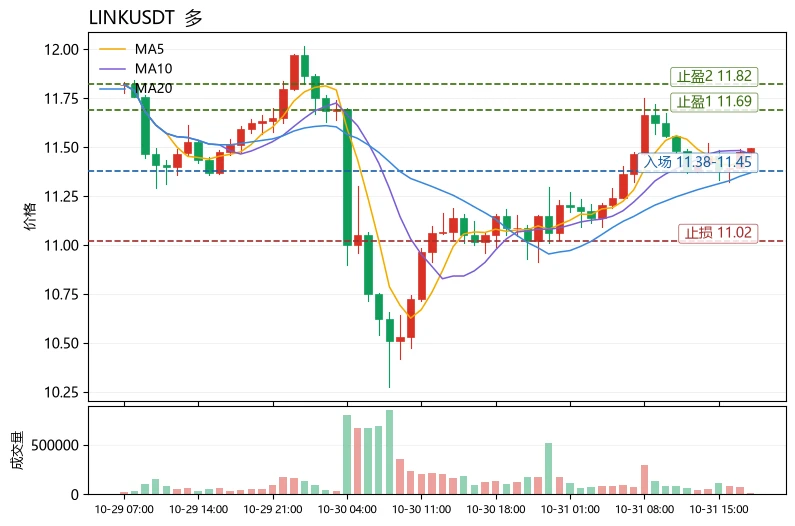
The Fear & Greed Index is only 30, yet $LINK is pushing against market sentiment with a +4.47% gain—this is the most unusual detail in today's market. It is rising instead of falling amid panic, suggesting that some funds are building positions against the sentiment.
Comparing three assets in the same group: $LINK is currently at 11.494, above MA20=11.3682 with MA5=11.4416; RSI=57.8 is neutral to moderately strong, and the MACD histogram at +0.00416 remains bullish, making its structure the most complete. Also in focus: $ZEC$ZEC, $XLM $XLM. $ZEC is also in a bullish alignment (MA5>MA20, MACD h
post-image
LINK-0.18%
XLM-0.64%
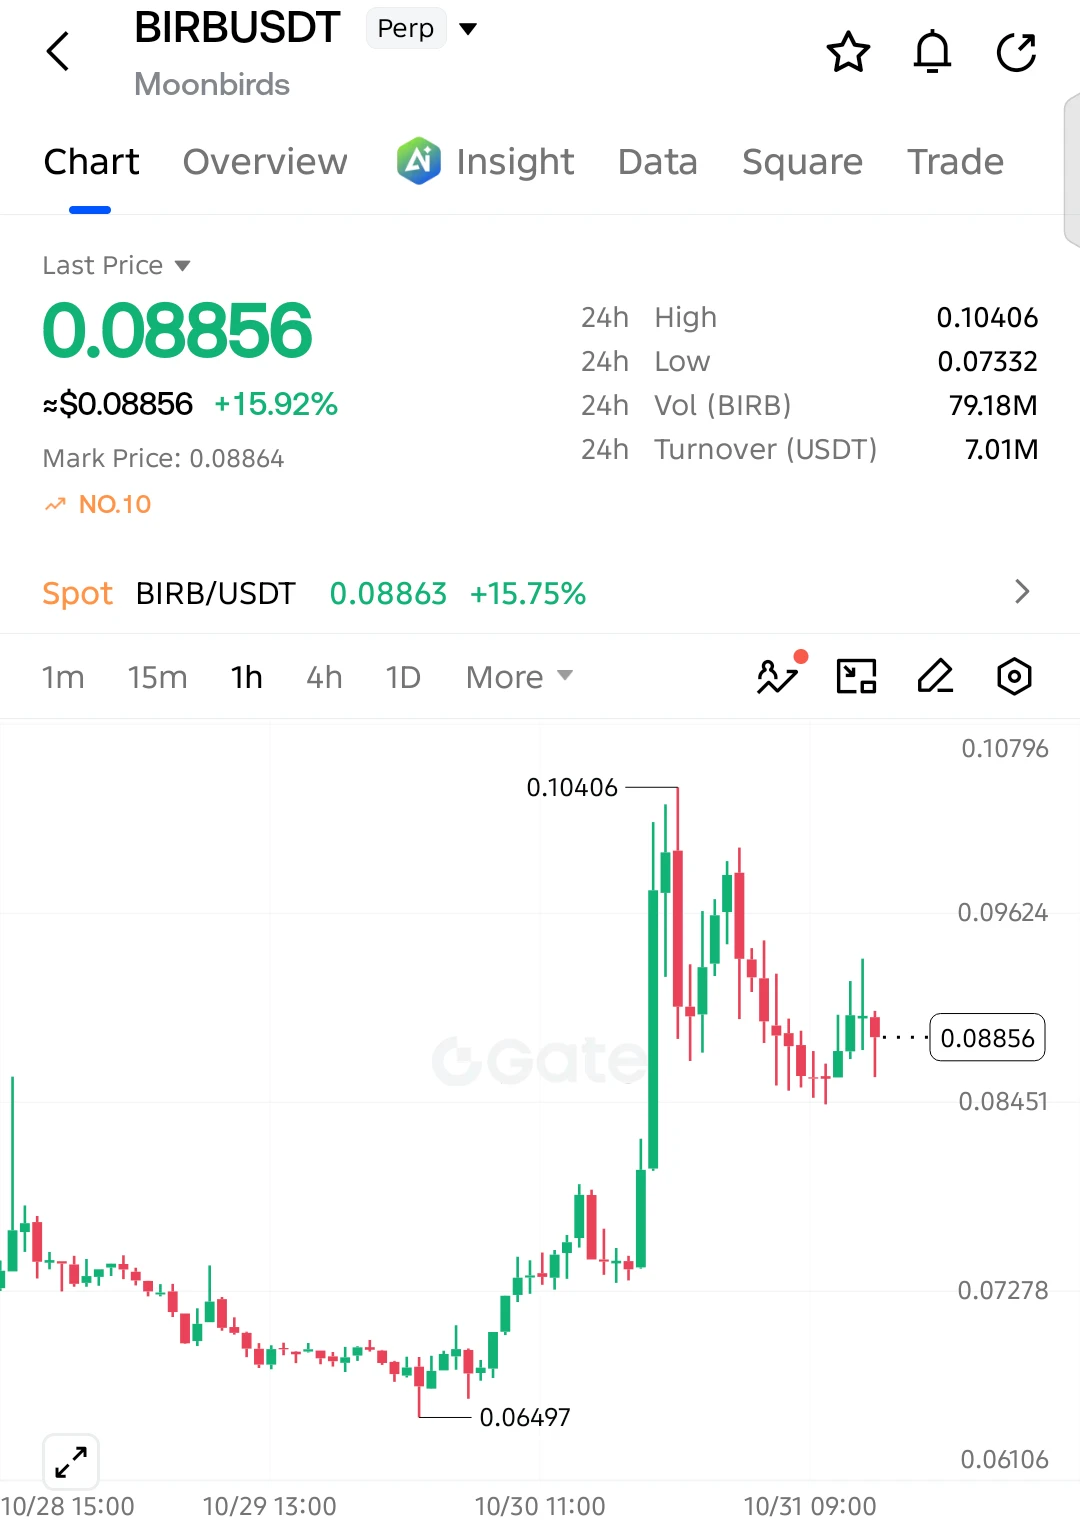
$BIRB LONG SETUP — READY FOR ANOTHER PUMP?
Entry: 0.08856
SL: 0.08350
TP1: 0.09250
TP2: 0.09620
TP3: 0.10000
Final Target: 0.10400
$BIRB is showing strong bullish momentum after a massive breakout! Buyers are defending the 0.0845 support area, and price is attempting another recovery. If buying pressure increases above 0.0925, we could see another rally toward 0.1000 and potentially 0.1040. Bulls still have a chance to take control!
post-image
BIRB-16.68%
  • 4
Crypto traders monitor market capitalization for signs of renewed momentum
live-cover
LIVE1,211
How would you feel if someone gifted you $100? Wouldn't you be extremely happy?
Imagine receiving a surprise gift of $100! 🎁
$BTC ‌$XRP ‌$ZEC ‌
post-image
BTC-0.67%
XRP-1.12%
ZEC+1.29%
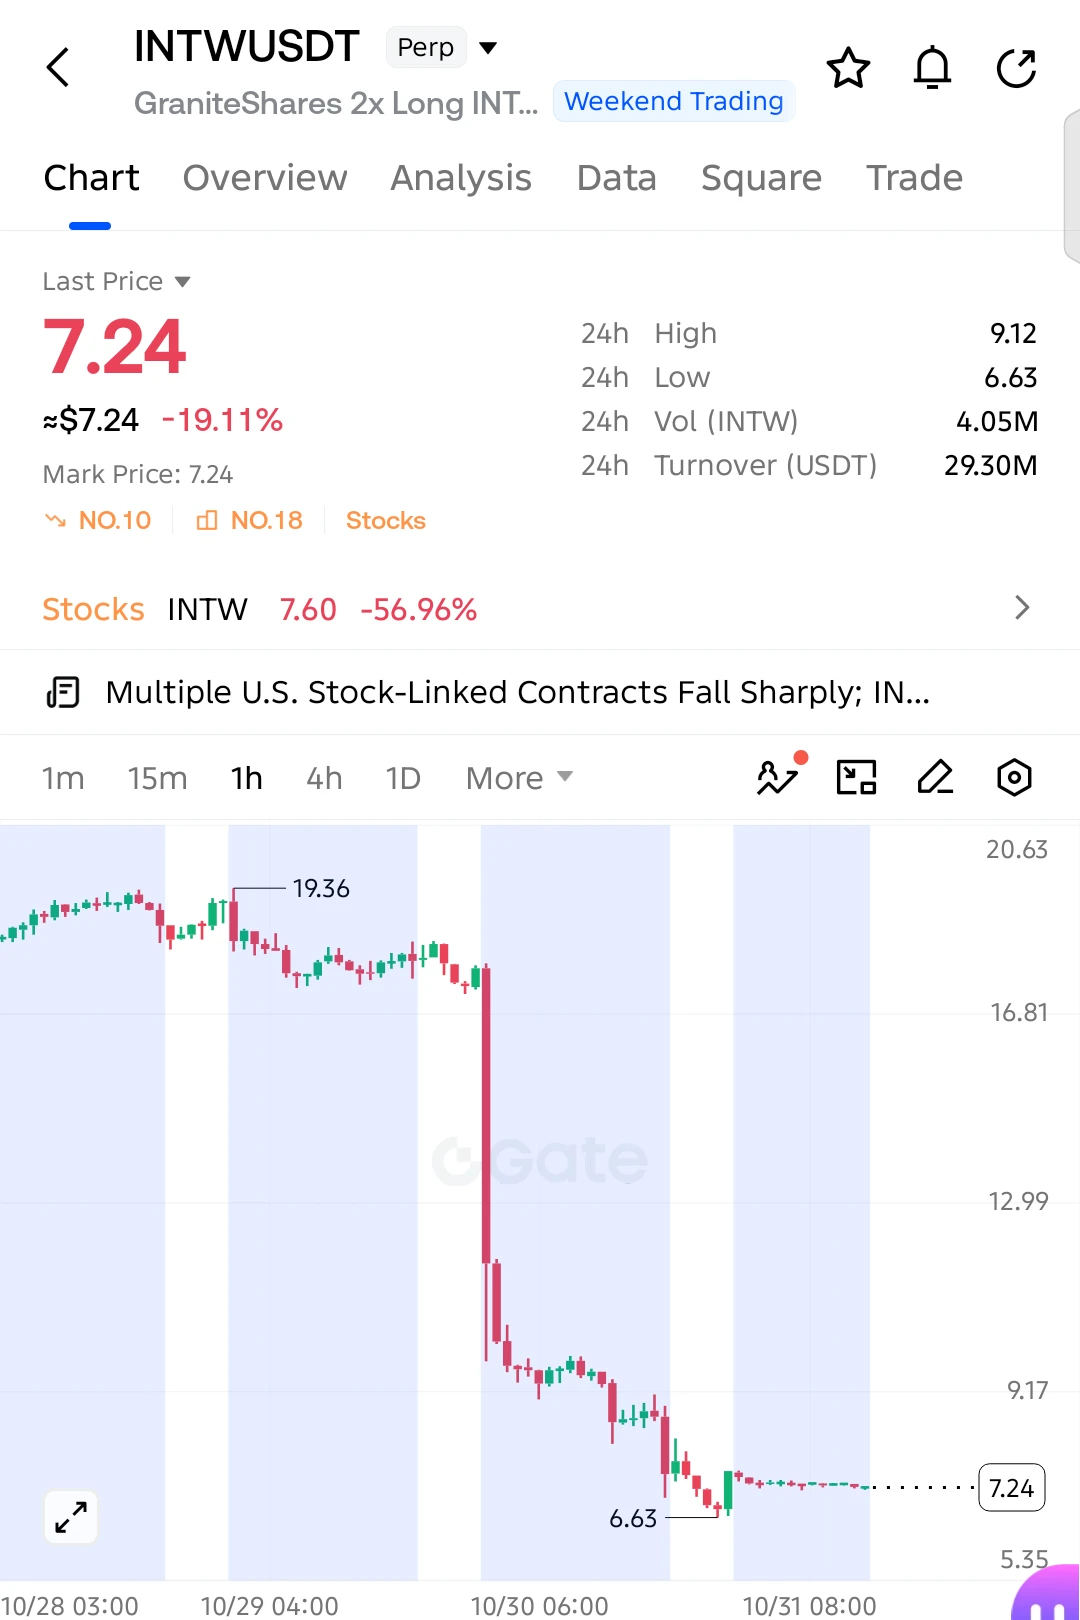
$INTW SHORT SETUP — SELLERS ARE NOT FINISHED YET!
Entry: 7.24
SL: 7.75
TP1: 7.00
TP2: 6.63
TP3: 6.20
Final Target: 5.50
$INTW is down over 19%, and sellers are still dominating! The massive breakdown has left buyers struggling to recover, while price is consolidating near its recent lows. If 6.63 breaks, another wave of selling could push the price toward 5.50. Bears remain in control, guys!
post-image
INTW+0.26%
  • 3
  • 2
$XAU Longs entered at 4200 are down more than 300 points? A whale has lost over $8 million, and if 3886 breaks, it’s an abyss! Can you still get out?
XAU is currently at 3890. If you went long at 4200, it’s not bad luck—you’ve stepped into a double meat grinder of macro forces and market positioning.
First, the news: U.S. nonfarm payrolls and PCE data have repeatedly come in above expectations, sending the odds of a Fed rate hike in December soaring. The dollar and Treasury yields are firmly squeezing gold. Even more brutal is the positioning: 82 long whales have an average cost of 4434 and un
XAU+0.38%
  • 11
  • 3
IT Home, October 31: According to Neowin, Microsoft will offer the LaunchEdgeOnWindowsStartupEnabled policy for Edge, allowing administrators to force-enable or force-disable automatic startup, or leave it unconfigured. When unconfigured, automatic startup is off by default, but Microsoft will periodically show a banner prompting users to enable it; users can also toggle it on or off in Settings at any time.
The policy lets administrators leave the choice to users. However, when it is unconfigured, Microsoft will still periodically show banners encouraging users to enable it. So-called user ch
post-image
BTC-0.67%
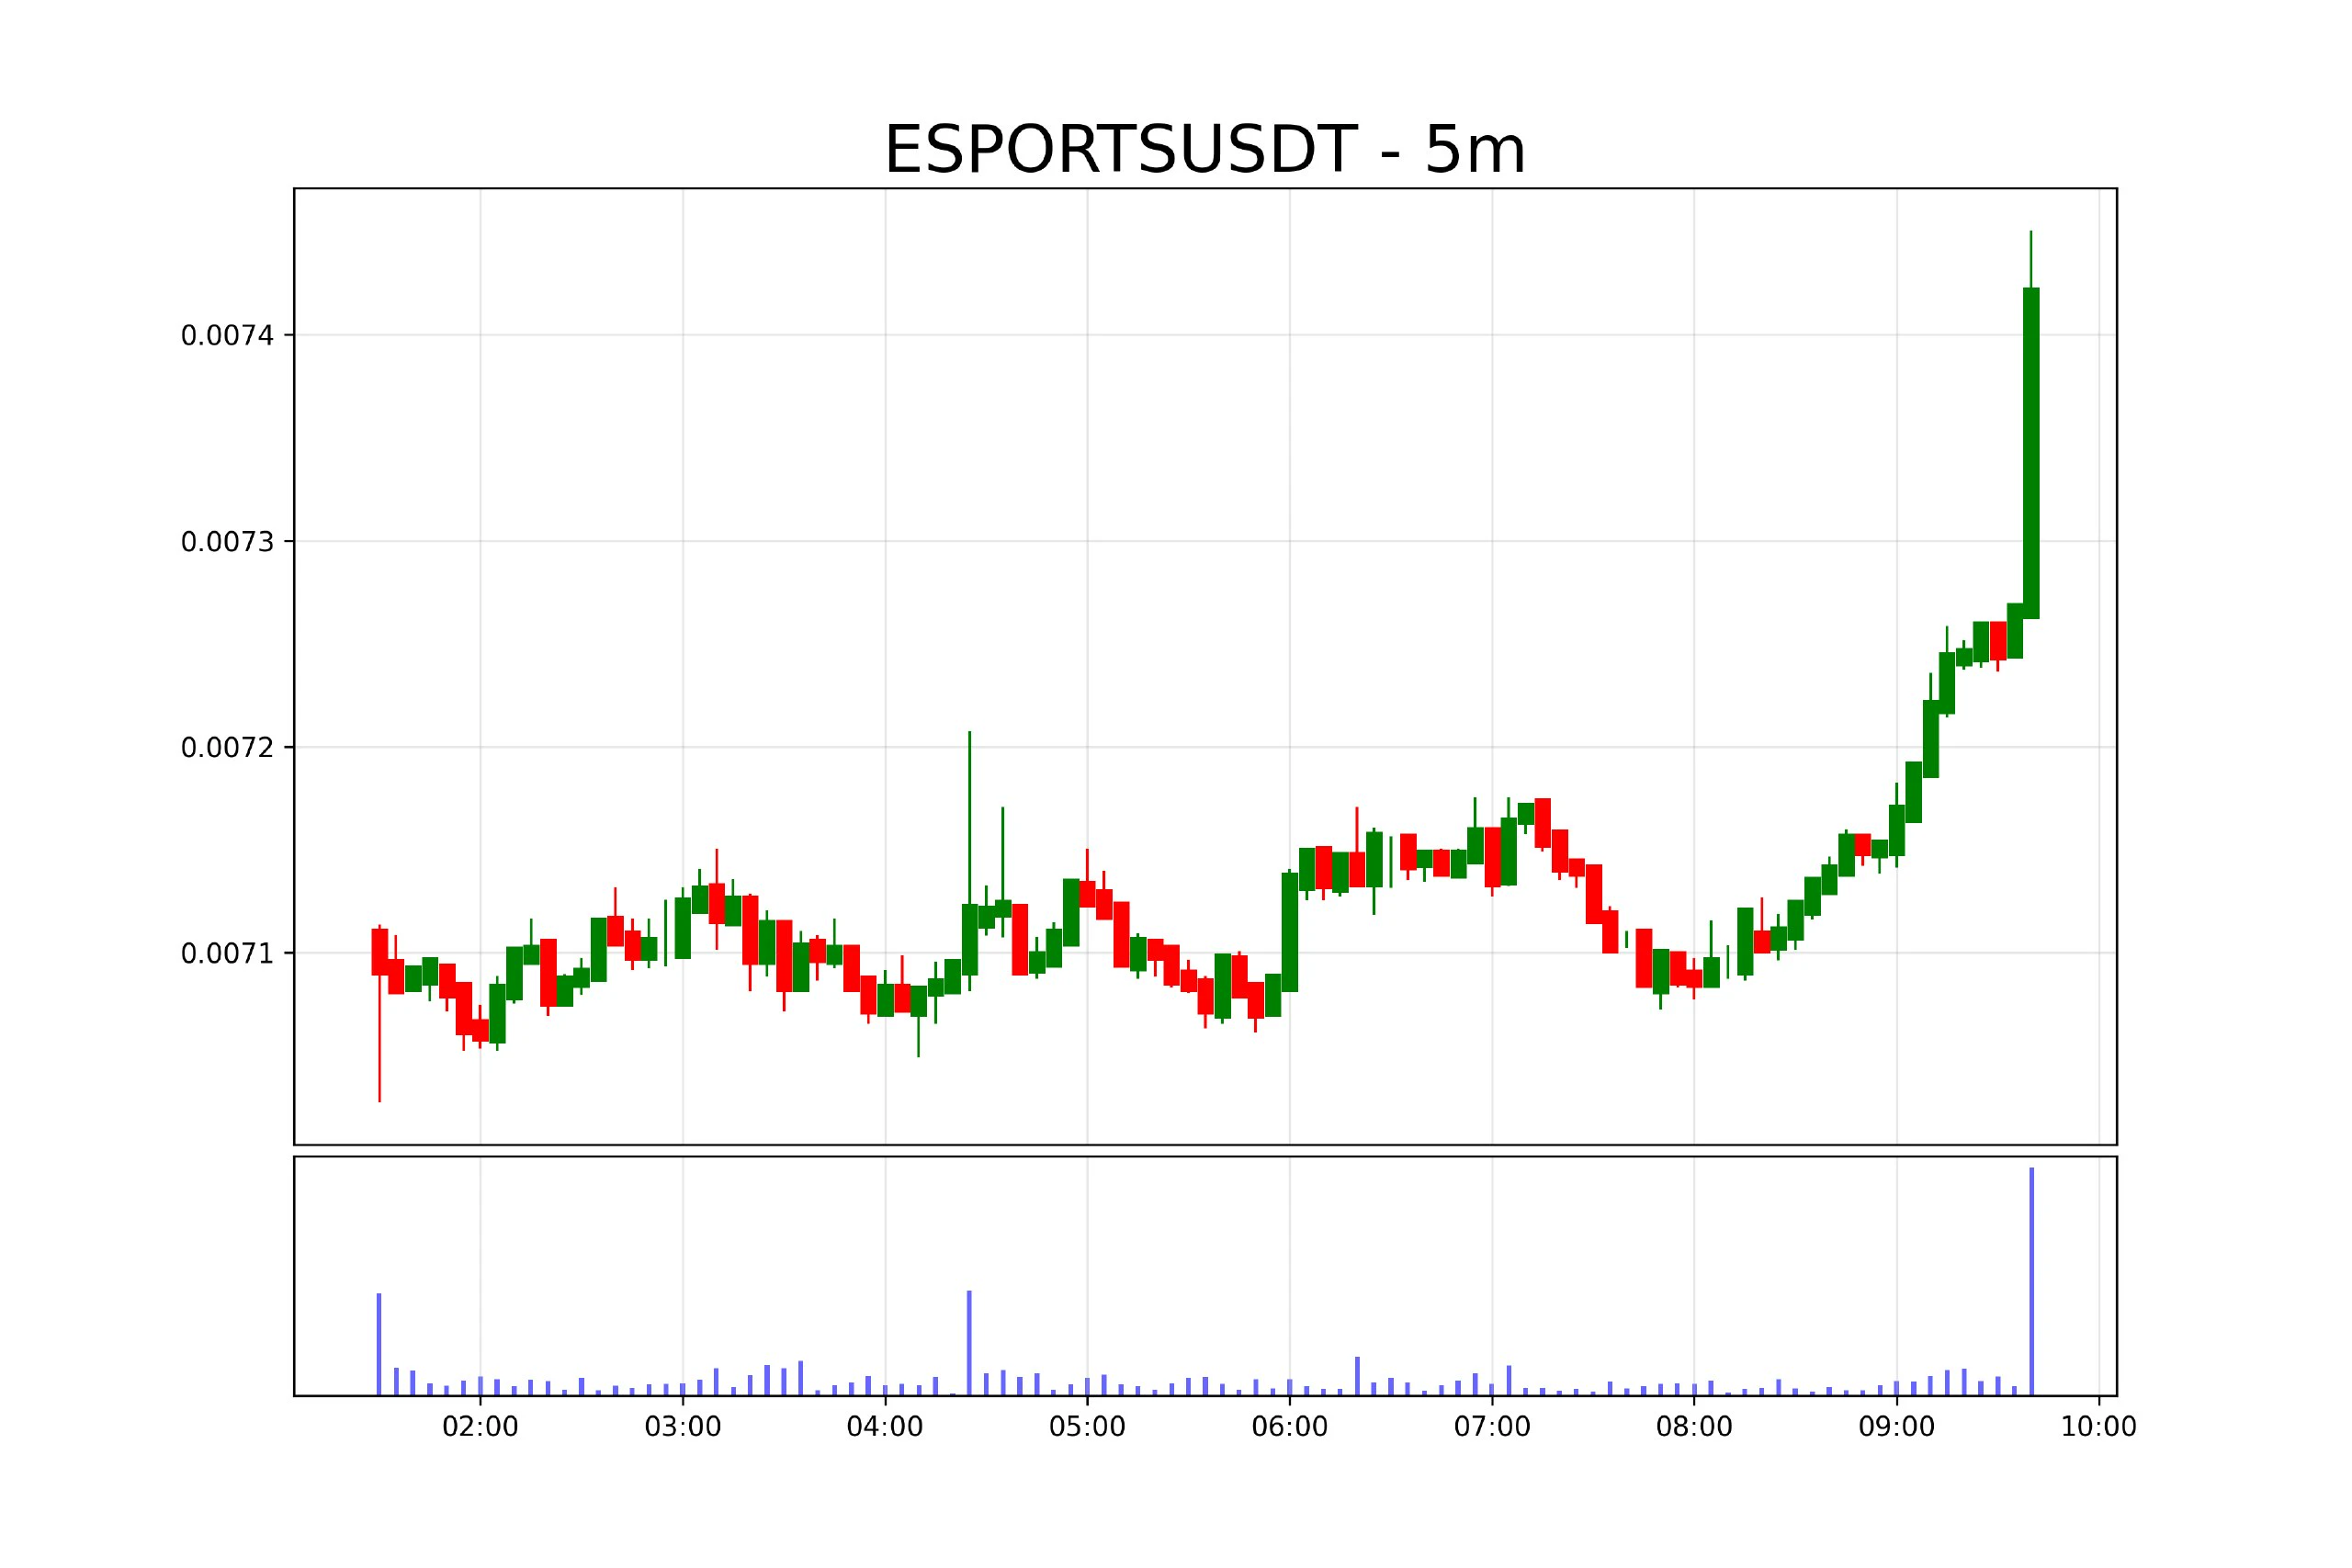
$ESPORTS is gaining traction, with the latest price move up 2.1% and trading volume surging 1,340.9%. The token is trading around $0.007419, while its 24-hour gain of 4.0% adds to the bullish momentum watch.
Support Zone: $0.00710–$0.00725
Resistance Zone: $0.00760–$0.00780
Next Bullish Target: $0.00810–$0.00850
Invalidation: Sustained move below $0.00690
A strong close above $0.00780 with continued buying volume could support another upward move. Failure to clear resistance may lead to sideways consolidation. Keep an eye on liquidity and avoid entries after an extended candle.
$ESPORTS ‌
post-image
ESPORTS-4.77%
#USEarningsSeason $AAPL $TSLA $MSFT $GOOGL
AI growth is impressive. But the market is starting to ask a harder question: how much profit can all this infrastructure actually generate?
The latest Microsoft and Alphabet earnings offer two interesting lessons about the AI investment cycle.
Both companies are expanding their AI businesses, but their financial results show why revenue growth alone is no longer enough to satisfy investors.
1. Microsoft: Strong growth with cash generation
Microsoft delivered:
$92.3B quarterly revenue, up 19% year over year.
$63.9B Microsoft Cloud revenue, up
post-image
AAPL-1.18%
TSLA-0.85%
MSFT-1.60%
GOOGL-1.32%
$BIRB $BIRB BOOM🤑🤑 The second wave of the rally is starting, guys, get on board now🤩Go long now🔥🔥Take-profit 1: 0.094 Take-profit 2: 0.098 Take-profit 3: 0.12 Stop-loss: 0.0838$IDOL $AIN
post-image
BIRB-16.68%
IDOL-6.71%
AIN+3.85%
#BTC大跌 #BTC跌破77000美元
In mid-October, several analytics firms identified the area around $77,000 as a key support level: it is a dense cost-basis zone for a substantial portion of Bitcoin’s supply, as well as the level of active investors’ average purchase price (the “True Market Mean”).
Around $74,000 is the cost basis for short-term holders, while around $72,000 is the 200-day moving average. On October 9, when Bitcoin was still above $82,000, prediction markets showed that the market saw roughly a 40% chance of Bitcoin falling to $77,500 in October.
A week earlier, analysts had warned that
BTC-0.67%
  • 1
  • 1
Load More

Join 40 M users in our growing community

⚡️ Join 40 M users in the crypto craze discussion

💬 Engage with your favorite top creators

👍 See what interests you

Trending Topics

BTC大跌

269.38k Views39.6k Discussing

$BTC briefly fell below $77,000 and remains under pressure around the $77K zone, with its 24-hour decline still above 4%. With risk appetite weakening and Fed uncertainty rising, where is the next key support after losing $80K?

IntelBeatsEarningsButStockPlunges

20.07k Views826 Discussing

StrategySTRCNears100ParValue

24.74k Views4.08k Discussing

View More