
Square
Following
Hot
News
Notifications
Profile
Share your thoughts
placeholder
Article
afternoon updates about btc
live-cover
LIVE2,036
BTC-0.67%
ETH-1.26%
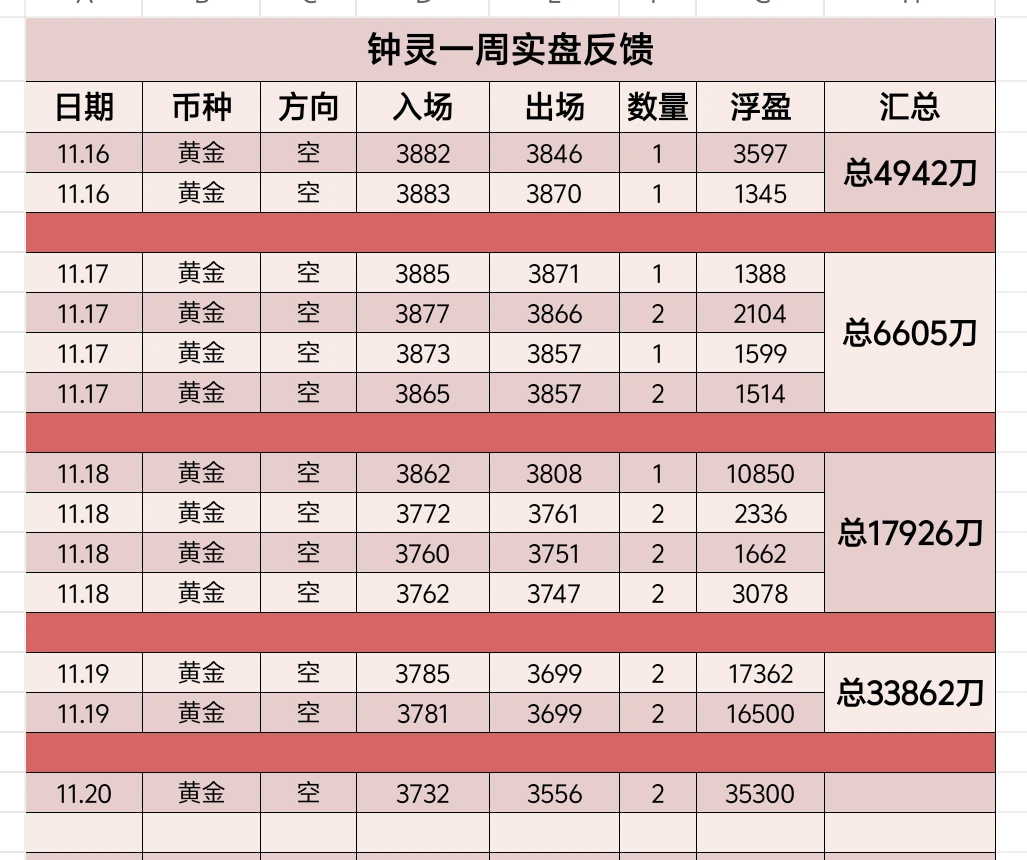
【5,000 Principal – Ms. Chen’s Live Trading Record】
A market opportunity this rare is one you have to seize when it comes along! As everyone knows, Zhongling has only been shorting recently! Zhongling also managed to achieve a significant result in yesterday’s market! Entered at 3732, gained 176 points, and pocketed $35,300!
$XAU $BTC #Gate直通IPO第三期ANT配售92100股 #美国11月初请失业金人数高于预期 #Launchpool三大项目同步开放
post-image
XAU+0.38%
BTC-0.65%
Trenches
mihao
m
bade
b
mihao
4Cxj...pump
Market Cap
$.
Change
.
24h Vol
$.
Holders
.
FIONA
F
bade
b
FIONA
B34n...pump
Market Cap
$.
Change
.
24h Vol
$.
Holders
.
PIEVERSE
P
bade
b
PIEVERSE
0x0e...25a9
Market Cap
$.
Change
.
24h Vol
$.
Holders
.
RUGGED
R
bade
b
RUGGED
GT8W...pump
Market Cap
$.
Change
.
24h Vol
$.
Holders
.
PIPI
P
bade
b
PIPI
6MKD...pump
Market Cap
$.
Change
.
24h Vol
$.
Holders
.
$SOXL It plunged from 56.47 to 41.37 in a day, down nearly 22 points. Most people’s first reaction is, “Something’s wrong with semiconductors—get out now.” That consensus isn’t wrong: leveraged ETFs take a hit from volatility decay during sharp drops, and historically, after every major pullback, it’s been hard for them to make a clean, quick V-shaped recovery in the short term. What everyone is really afraid of is the same thing: the drop is too fast to catch.
But there’s one detail worth watching this time. Trading volume was 7169.5M. That’s not a level retail panic alone could generate; it
  • 1
Trump only leaves the curtains open in China so he can enjoy the view of Shenzhen at night.
The Whale’s Breath: Decoding the EVA AUSDT Liquidity Sweep
$EVAA ‌

Why do I trade when whale wallets show unusual accumulation?

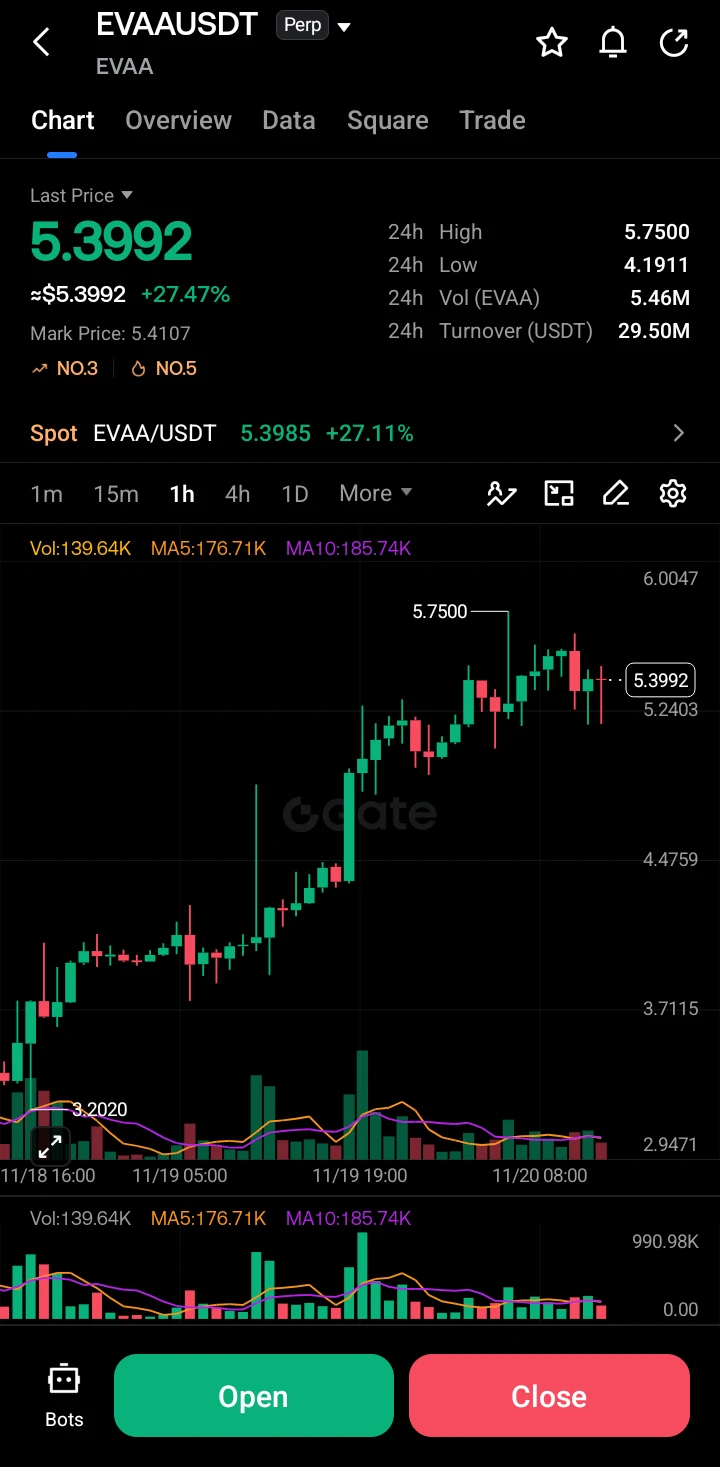
Because retail sees a green candle, but I see a mathematical deviation in volume flow. Looking at EVA AUSDT, the market is currently speaking a language of aggressive accumulation. The last price is sitting at 5.3992, marked by a massive +27.47% daily surge. This isn't just a random pump; it is a structural breakout. The 24h high of 5.7500 and the volume turnover of 29.50M USDT suggest that smart money has been active. We are looking at a classic "Long Squeeze" sc
post-image
EVAA-0.49%
  • 2
I’ve been unsubscribed from Gemini for almost a year. After hearing you all praise it so highly lately, I thought I’d quickly resubscribe and give it another chance... $GOOGL
post-image
GOOGL-3.48%
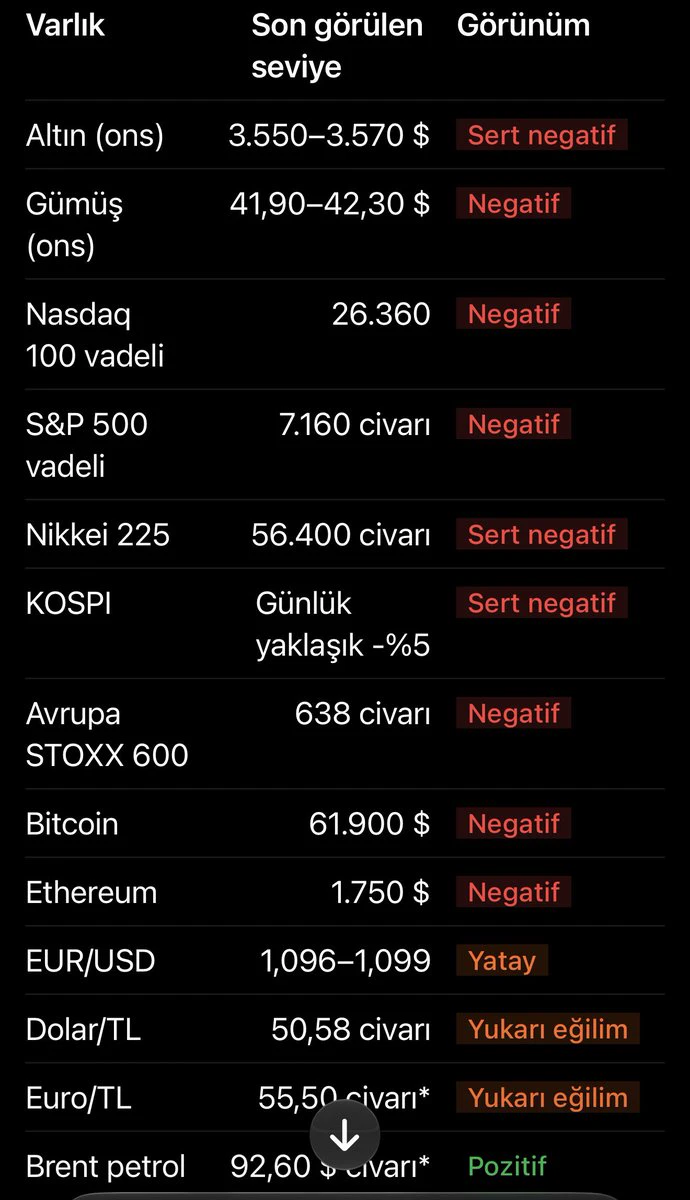
🔴SNAPSHOT OF THE DAY IN GLOBAL MARKETS‼️
Global risk appetite is weakening
Sell-offs on Wall Street spread to Asia. A strong dollar, high real interest rates, and concerns about technology company valuations are weighing on markets all at once.
post-image
The weather’s cold, the market’s cold, and my heart’s cold.
Had nothing to do, so I took my cat to get its little cat-life troubles taken care of.
Now it can enjoy a happy life with all six senses at peace.
post-image
Did it finally fall after all?$SNDK
post-image
SNDK-0.18%
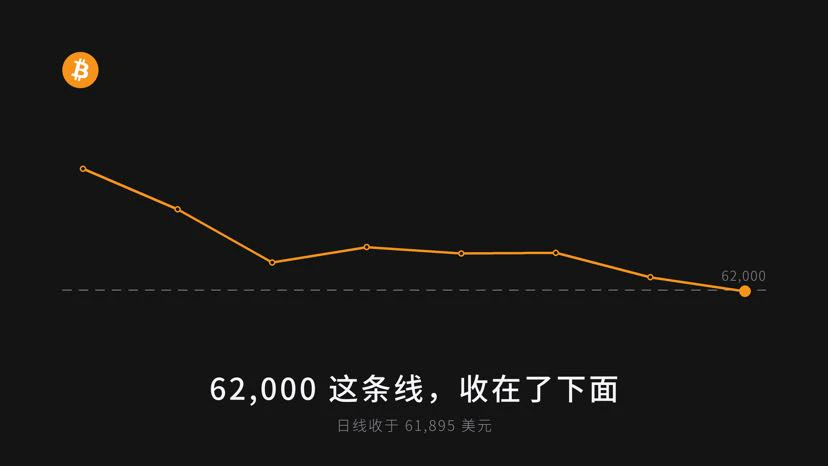
Closed below the 62,000 line
#BTC跌至9月以来新低
On November 17, Glassnode’s weekly report drew a line for $BTC : $62,000 to $66,000 is the cost-basis zone where recent buyers are concentrated, and the only dense support below the price.
The report also outlined what happens if the price breaks below: if the daily candle closes below $62,000, the buyers who entered in August will move into losses, and a large number of long liquidations below could be triggered at the same time. Further down are the June low of $58,500 and the realized price of $53,700.
Based on the USD spot price, as of 8 a.m. Beij
post-image
BTC-0.67%
  • 1
  • 2
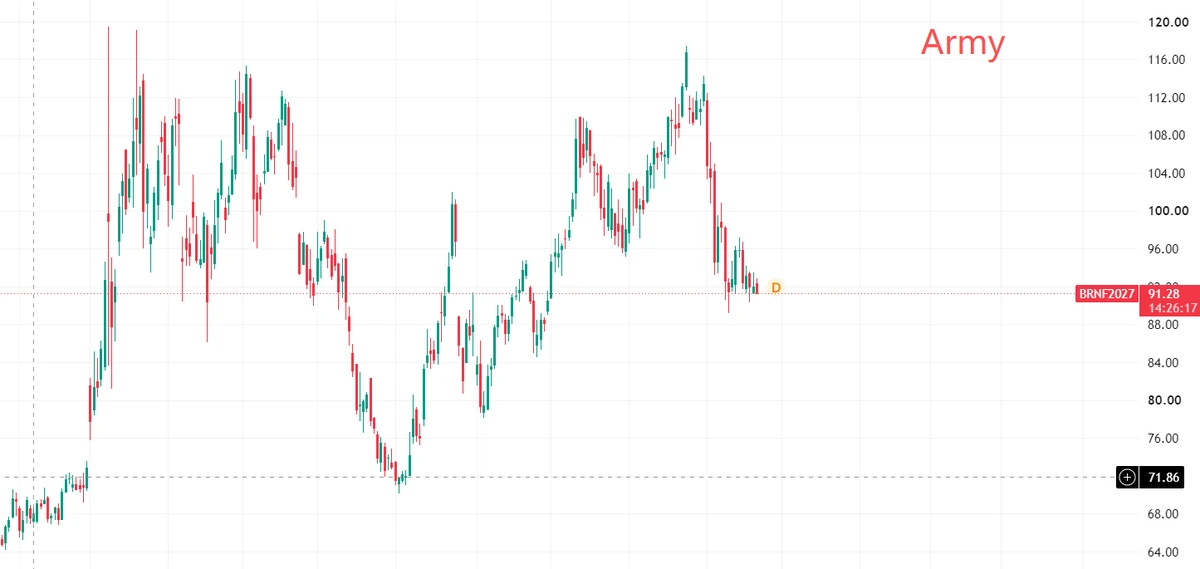
“Near $90, Yet Trading ‘Oversupply’:
Is Crude Oil Seeing the Most Dangerous Case of Expectations Getting Ahead of Reality?”

Oil prices are nearing the $90 mark,
yet the market is trading “oversupply.” That divergence is itself the most dangerous signal.
The return of Middle Eastern supply to the market is essentially a rapid unwinding of the geopolitical premium.
But what’s really weighing on oil prices isn’t current inventories—it’s the market pricing in OPEC+ production increases and a shale oil resurgence ahead of time.
When expectations run ahead of the data, prices peak before fundamenta
post-image
  • 2
  • 2
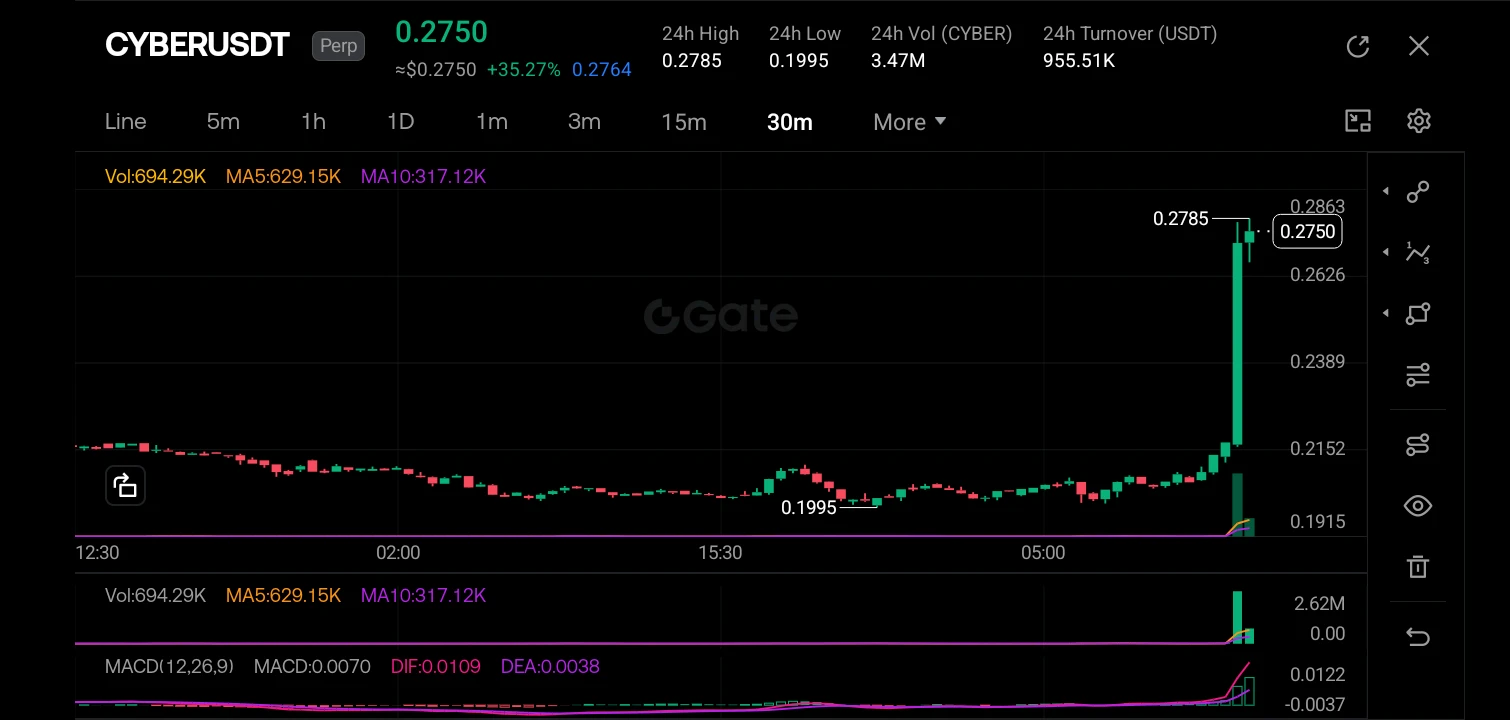
Why do I trade when whale wallets show unusual accumulation/distribution?
$CYBER ‌

Because the chart tells me the truth the wallet screenshots hide. On the 30-minute CYBERUSDT chart, price sits at 0.2750, up +35.27% on the day, with a 24-hour high of 0.2785 and a low of 0.1995. The move is not gradual—it is a vertical, single-candle repricing event. Volume exploded to 694.29K, nearly double the MA5 volume of 629.15K and miles above the MA10 of 317.12K. This is not organic accumulation. This is a forced squeeze.

Explicit Structural Mapping: Macro to Micro

Macro flow (one month to one week):
post-image
CYBER-5.40%
  • 2
  • 1
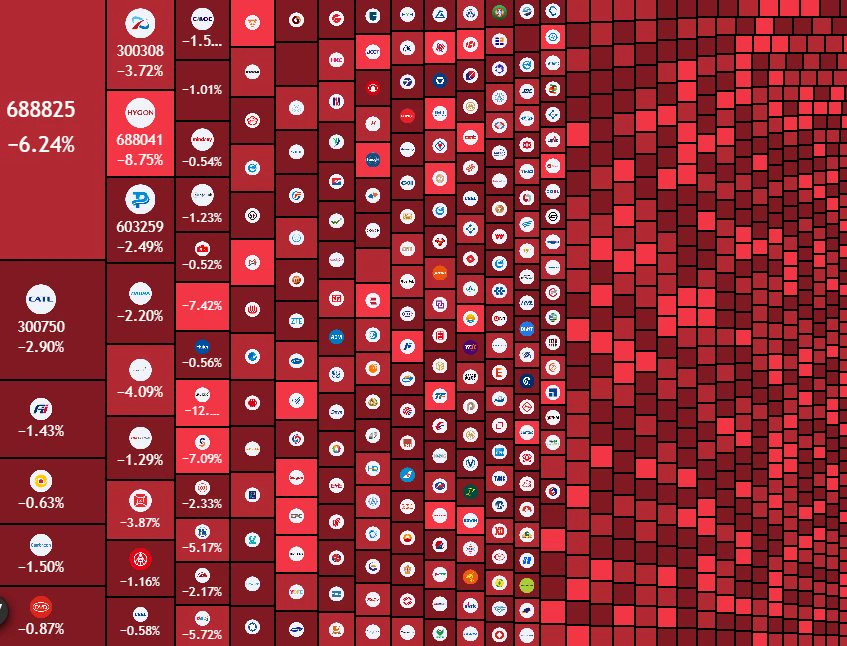
#BREAKING :
China's stock market lost a huge amount of money today.
It is like 1,000,000,000,000 yen gone in one day.
People are scared that a big crash has started.
post-image
On the street at 1 a.m.,
the chairman still didn’t forget to give his secretary a little ideological education.
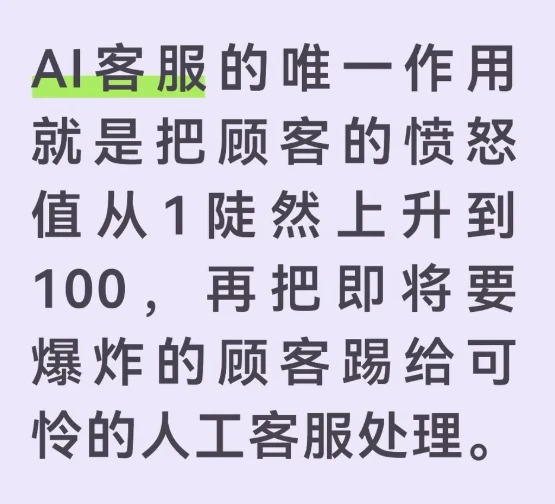
No matter what software it is, when I contact customer service, the first thing I usually say is: Get me a human!
post-image
Crypto market prediction
live-cover
LIVE1,680
BTC-0.67%
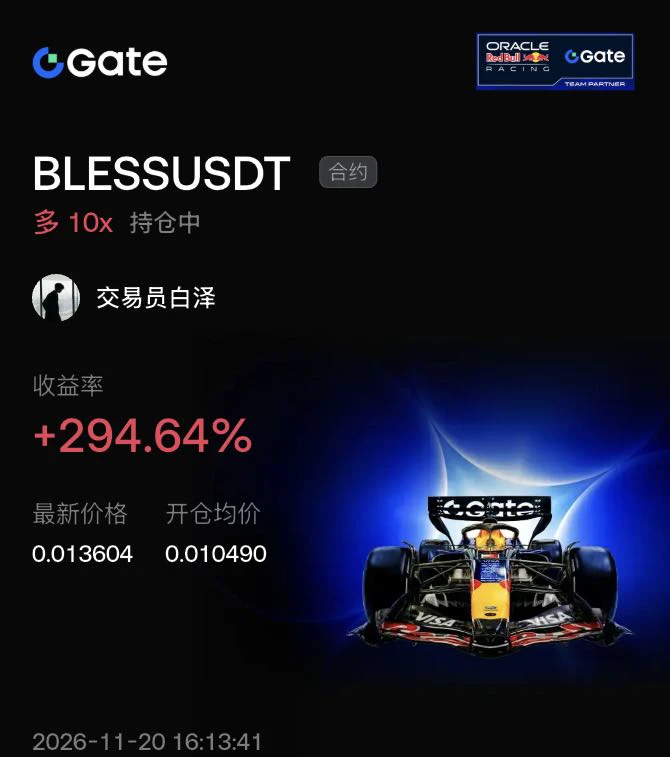
Easy money! $BLESS My long position surged nearly 300%!

The market was on fire today! Seeing BLESS break above the EMA and trading volume soar, I went all in on a 10x long at 0.010490.

The logic was clear: the DePIN sector was hot, and capital was clearly flowing in. Sure enough, the price surged to 0.0136, and my account showed a +294.64% return!

Looking back, this coin is extremely volatile, and selling pressure was also significant after its earlier rally. Luckily, I got out quickly and locked in my gains.

If you haven't jumped in yet, don't rush. There are always opportunities in the m
post-image
BLESS-2.03%
BTC-0.65%
ETH-1.23%
  • 2
  • 1
What the hell, how did the head just disappear?
I stared at it for a full 10 seconds before it finally clicked...
post-image
I’d call it the most powerful burning ritual for changing your personal luck.
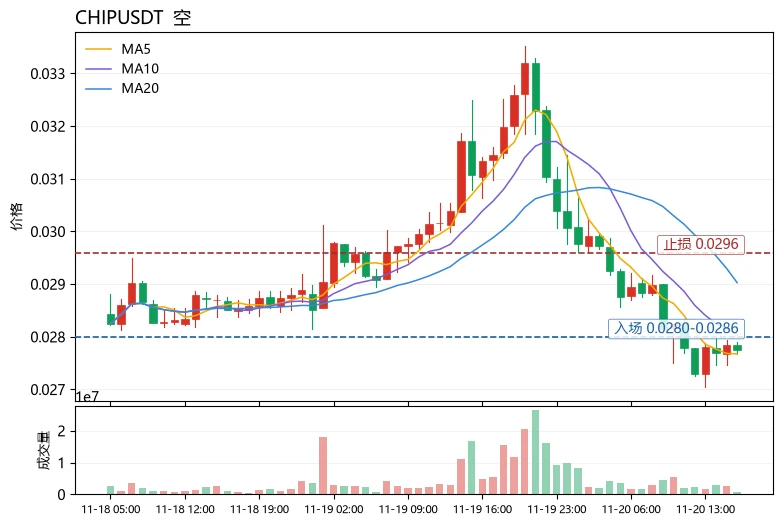
Many people instinctively buy the dip when they see “extreme fear,” but the Fear Index never tells you where short positions are crowded. $CHIP is currently at 0.02775, down 9.90% over 24h. Price is hovering near MA5 (0.027676) but far below MA20 (0.029027), and the bearish moving-average alignment remains unchanged; RSI is only 36.3, while the MACD histogram at -0.0001644 remains below zero, with trend momentum skewed bearish. What is truly worth watching is the funding rate of +0.0019%—prices are falling while longs still pay to hold positions, indicating crowded longs and shorts in control
post-image
CHIP+4.26%
INIT-2.53%
SUI-1.05%
Load More

Join 40 M users in our growing community

⚡️ Join 40 M users in the crypto craze discussion

💬 Engage with your favorite top creators

👍 See what interests you

Trending Topics

GateDirectIPOPhase3ANTAllocates92100Shares

648.5K Views4.5K Discussing

The allocation results for Gate Direct IPO Phase 3 — Anthropic (ANT) — have been announced, with a total of 92,100 $ANT shares allocated. Successful participants can check their accounts and review their subscription results. Did you secure an allocation this time? Share your subscription experience and allocation result on Gate Square!

USNOVJoblessClaimsBeatExpectations

171.3K Views1.3K Discussing

FedMayNeedA50bpRateHike

414.3K Views3.1K Discussing

View More