Square
Following
Hot
News
Profile
Share your thoughts
placeholder
Article
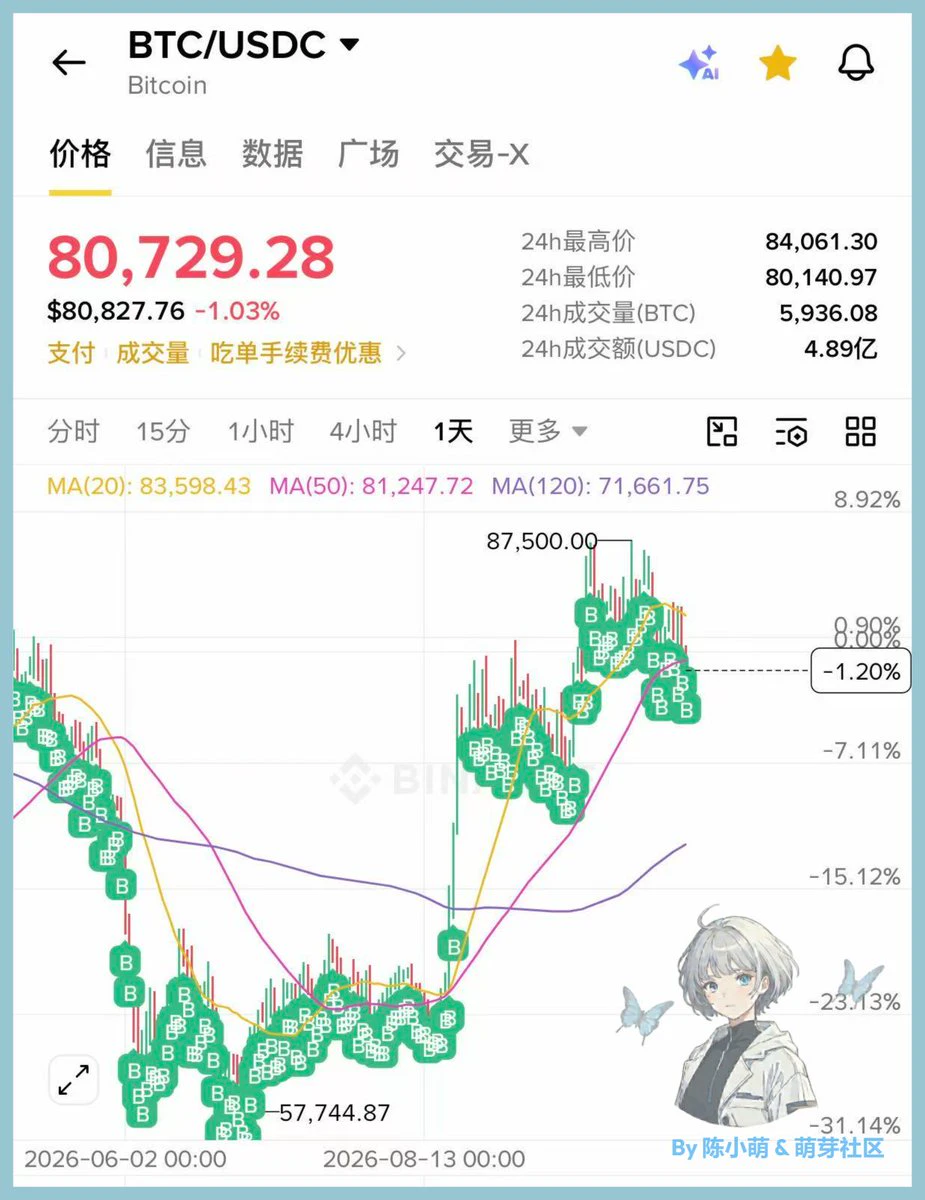
I’m going to sleep. Even the Korean index next door has dropped so hard that it practically crapped itself. Honestly, looking at it this way, we’ve already performed very well... really well... Compared with the brutal sell-off a few days ago, this has been very gentle. The Korean index triggered a circuit breaker and fell as much as 7%, while we’ve only dropped a few hundred points.
If you want to buy Bitcoin, here are three options:
1、Break sideways out of this downward channel and form a 1-hour bottoming pattern, accompanied by a higher low. You can buy in, with a stop-loss below the previo
BTC-3.07%
Don’t always wait until everything is ready before setting out.
There is no perfect time in life,
only the first step taken with courage.
Just keep moving forward and doing your best; leave the rest to time!
Good morning, my world~
post-image
$BTC I knew you would fall, but dumping straight down without giving even a rebound? I chased it.
#美国9月CPI超预期
post-image
BTC-2.96%
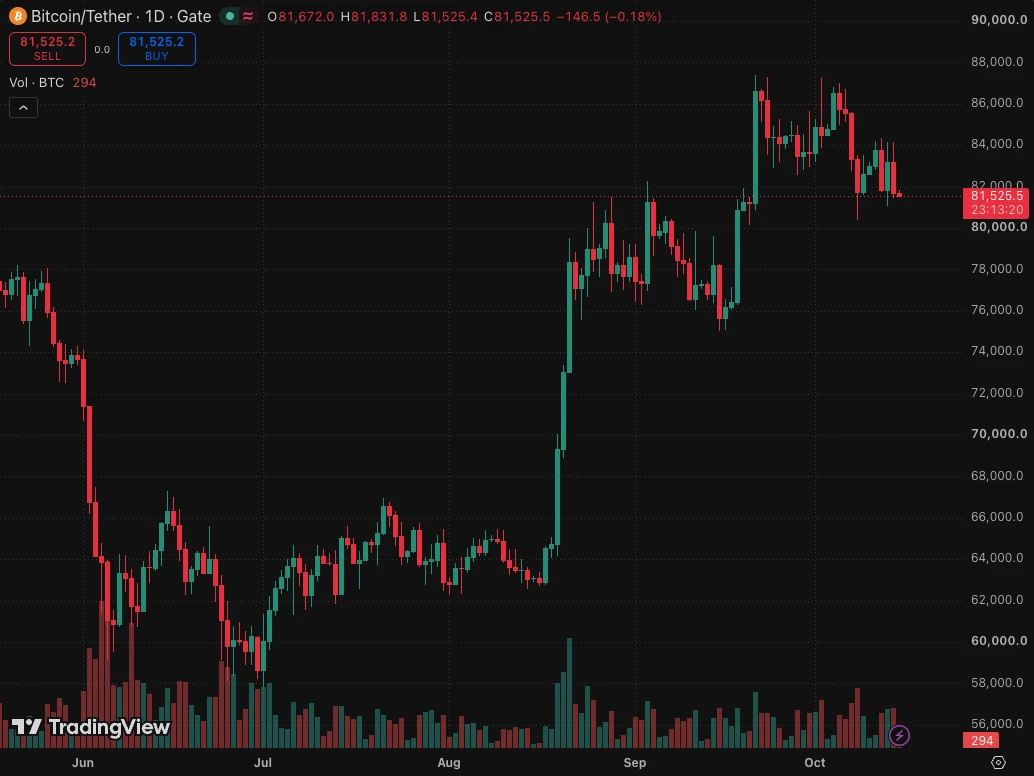
$BTC 26 day consolidation pattern
Higher highs higher lows. 26 day consolidation followed by five day up trend. Started on first higher high.
post-image
BTC-2.96%
2026.10.15 Early BTC/ETH/XAU/SNDK Analysis
The market wiped out $447 million overnight, leaving 108019 people bankrupt and wiped out!
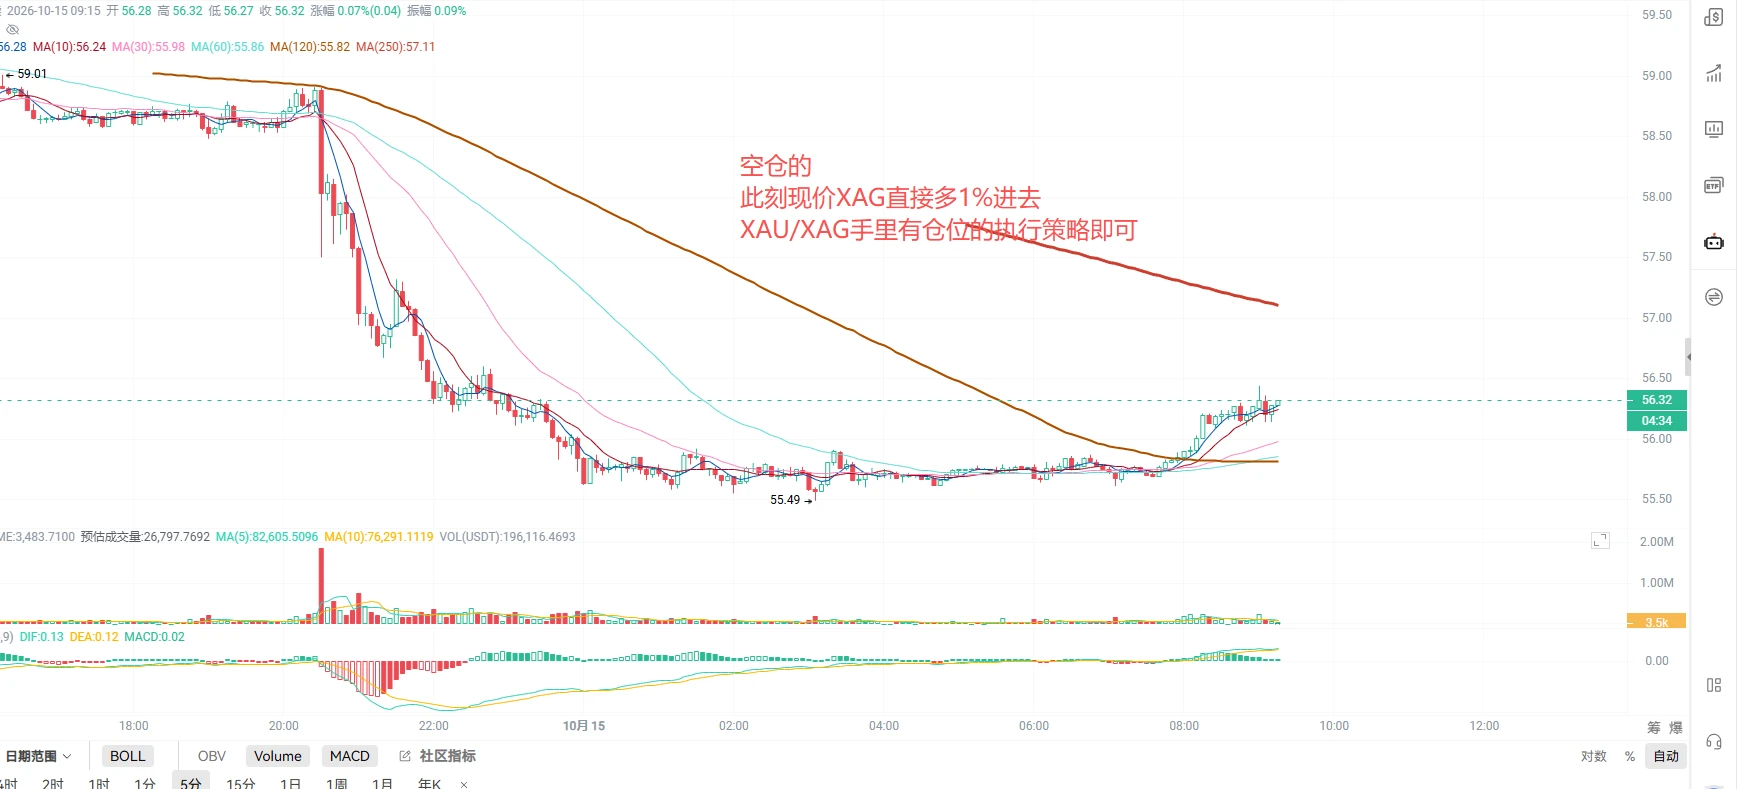
Last night, the major bearish CPI news came in above expectations, igniting short-seller enthusiasm, especially in XAU/XAG!
Last night, I went against the trend and established core long positions in XAU/XAG. XAU should be around 4100; you can reduce your position and move your stop to protect profits now. XAG at 56.8 is slightly underwater at the moment, so hold it for now. Whichever of the two you traded, follow the corresponding strategy!
BTC support/
post-image
BTC-3.07%
ETH-6.07%
XAU-0.55%
SNDK-5.35%
XAG-5.39%
  • 2
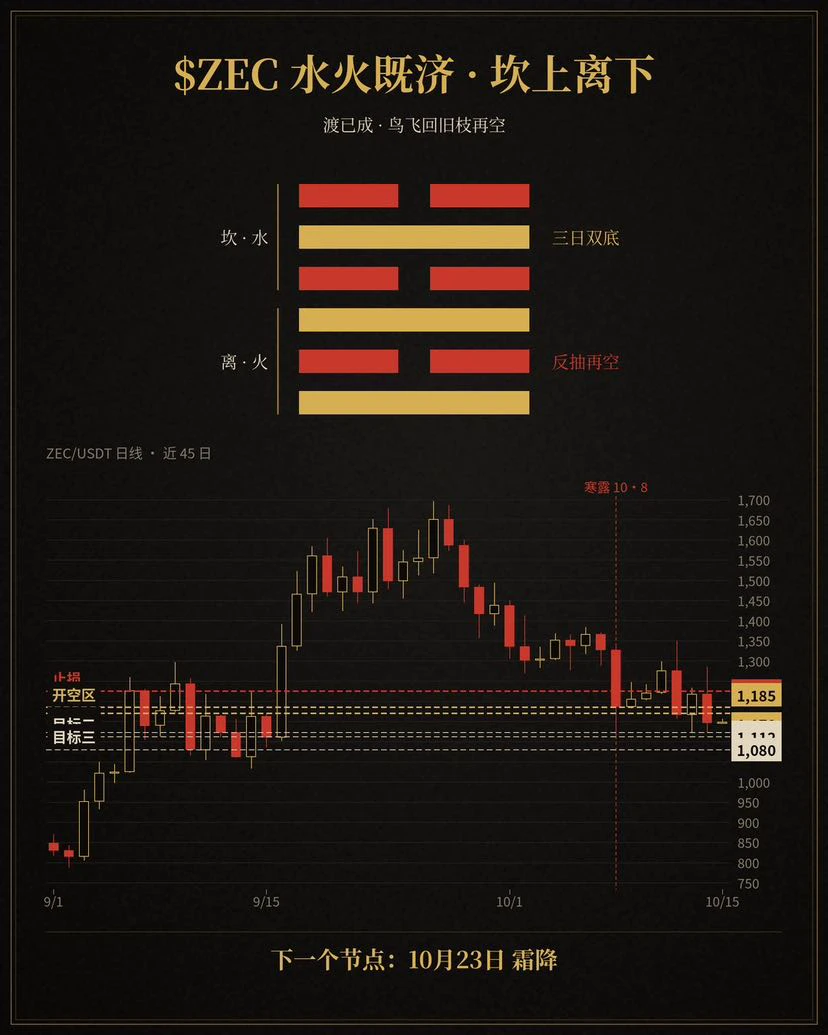
$ZEC Water and Fire Already Complete, Kan above and Li below. Water is above fire—the crossing is already complete; with the third line changing, don't chase shorts after the market has already been dumped. The changed hexagram is Water and Wind: The Well.
On the daily chart, price surged to 1348 on October 12 before crashing down; the lows on October 13 and 14 both landed around 1123, forming a three-day double bottom. The current price is 1149, below the daily 20-day moving average at 1270 and 50-day moving average at 1188. On the four-hour chart, price crashed to 1141 last night, rebounded
post-image
ZEC-12.36%
today morning update
live-cover
LIVE2,092
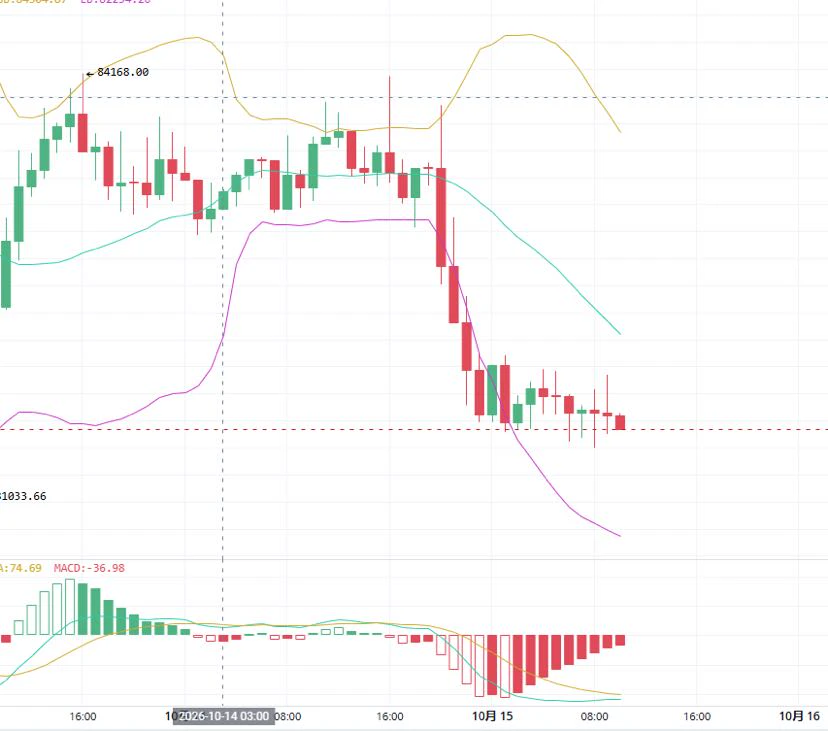
10.15 BTC Setup Plan
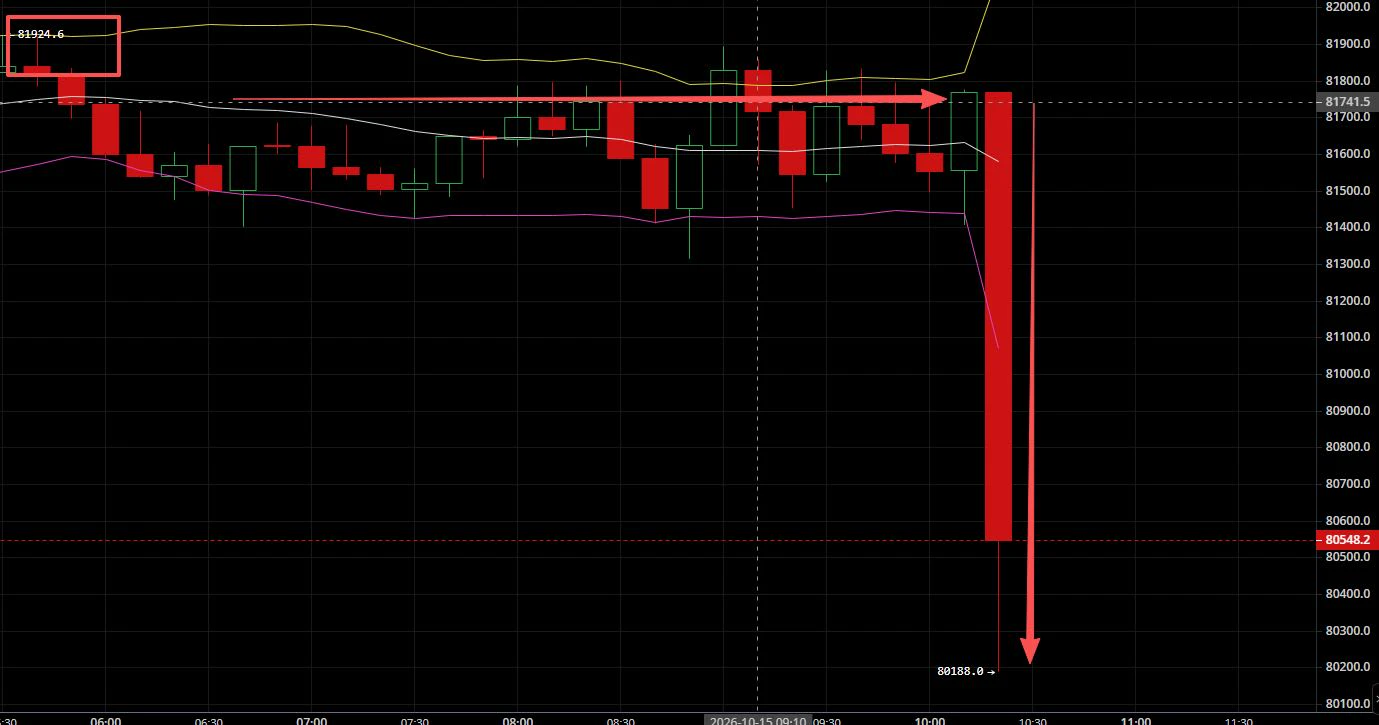
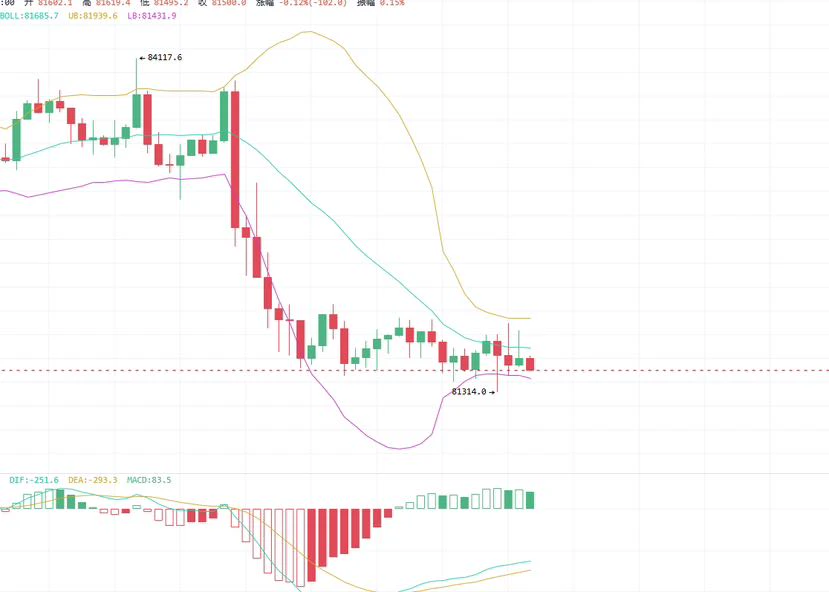
  After BTC experienced a rapid decline, downward momentum has significantly weakened. The price is consolidating and forming a base in the 81000-81800 range; the Bollinger Bands have shifted from widening downward to narrowing, with the price moving near the middle band. The lower band and the previous low at 80985 together form strong short-term support. Meanwhile, MACD has formed a golden cross below the zero axis, and the red bars have continued to expand. Short-term rebound momentum is gradually building, and the market is overall in a post-oversold recovery phase. To
post-image
BTC-2.96%
Bad Boy Watch: RKLB 10.15
Rocket Lab closed at 59.18, down 7.85%, with an intraday high of 63.56 and a low of 58.54.
A big down day for Rocket Lab.
After hours, it was also confirmed that the Neutron rocket has been delayed to 2027. The only positive is that, if the maiden flight goes smoothly, reusability could be achieved quickly. This stock’s key issue has always been the progress of the Neutron rocket.
Back to the technicals:
It has now officially fallen below the one-year moving average, and there is little support below. Bad Boy added a 720-day moving average, which is currently around 3
RKLB-7.81%
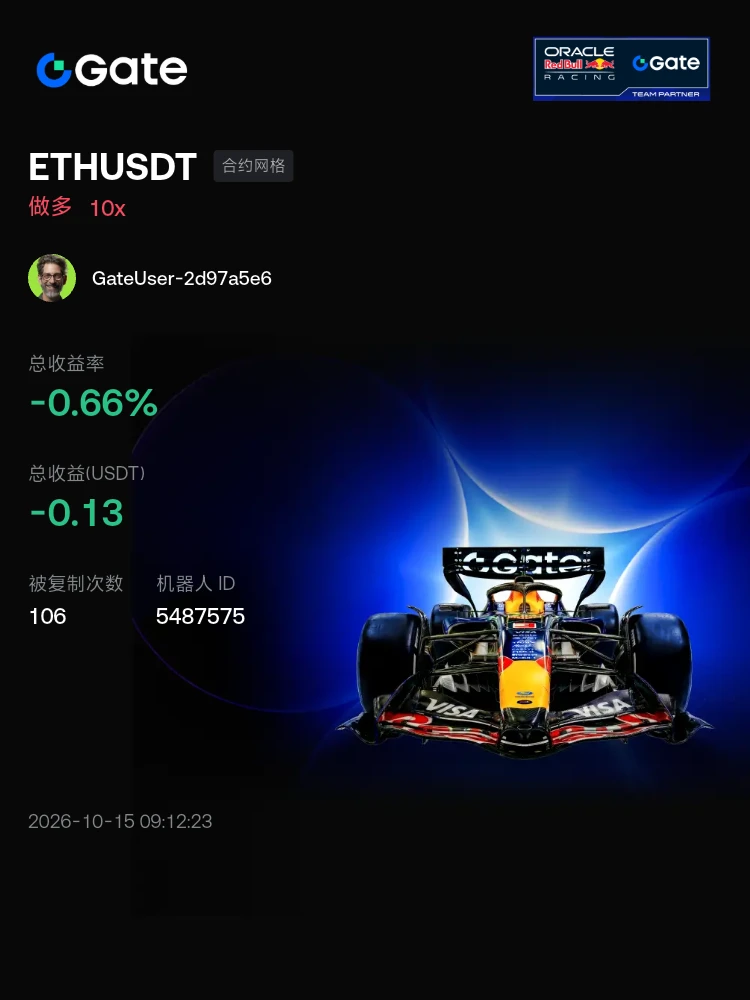
#交易机器人 I’m using the ETHUSDT futures grid bot on Gate—come copy-trade with me
post-image
Bad Boy Watch: SPCX Update 10.15
Big Rocket closed at 152.16 in U.S. trading, down 2.8%, with an intraday high of 155.44 and low of 151.10
Big Rocket’s stock price has reached the lower boundary of the price channel.
The on-chain candlestick chart shows that it has already retested the 60-day moving average.
Tonight’s market action is quite critical, as we need to see whether support around 150 holds.
Of course, Bad Boy also needs to prepare for the scenario after a break below 150, in which case we’ll have to look toward around 140.
Keep observing—the October impact still feels like it’s on i
SPCX-5.41%
Bitcoin outlook this morning
Trade:
Short around 820-825
First target: 815-810
Second target: 805-8w
Set a stop-loss
On the current Bitcoin chart, the previous resistance at 83930 led to a pullback, with the overall trend leaning toward a volatile decline. The current price is 815, trading below the Bollinger middle band, while the Bollinger Bands are narrowing and entering a consolidation phase. MACD is below the zero line, and the RSI rebound failed to break above 60, indicating limited rebound momentum.
In a range-bound market, avoid chasing shorts. Do not blindly chase trades after a break
post-image
BTC-2.96%
5x target achieved! Keep moving forward!
1000u reached 5000u$ZEC
post-image
ZEC-12.36%
  • 1
Calm as still water
Just buy, that's it
post-image
TOTAL 3 I hope TOTAL 3 Surprises Bears .
5 Resistance TESTS on the trendline from 2021 to 2025.
2026: We've tested 200MA( Redline) ,Broken through 50MA and now retested (Greenline) 50MA.
I expect a Continuation to the trendline to test the RESISTANCE. By then ALTS SHOULD PUMP
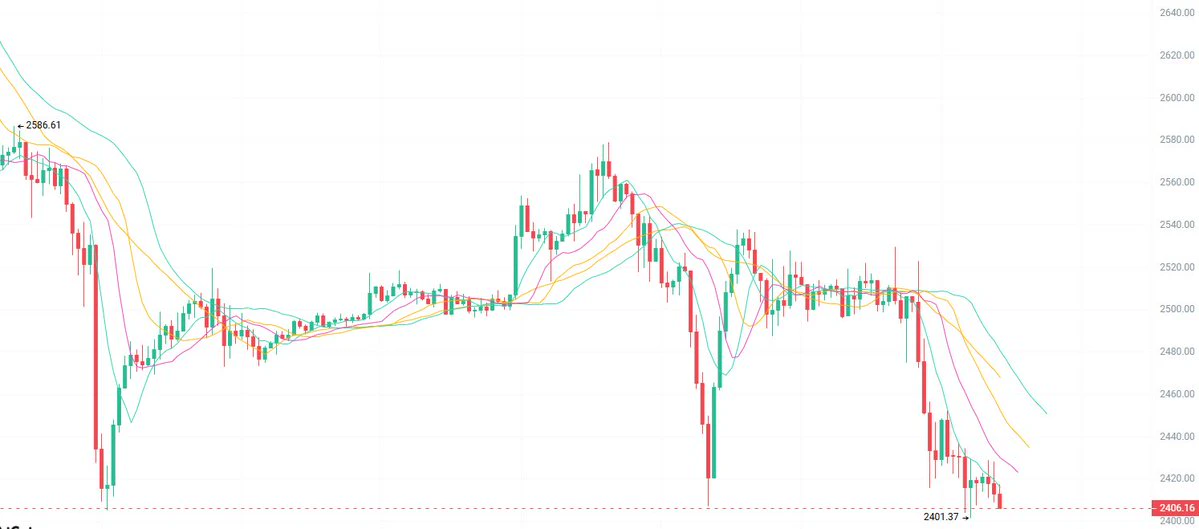
10.15 ETH around 2440, take a light short, defense at 2480, targets 2400/2360
I’ll wait around 2360 for stabilization before trying a long, defense at 2320, targets 2420/2460.
ETH on the 1H chart plunged from 2578 all the way to 2401. The current price of 2410 is only a weak rebound, with the moving averages in a bearish alignment.
2440-2460 is the resistance zone above. If 2400 fails to hold, be prepared for further downside.
$ETH #ETH
post-image
ETH-6.07%
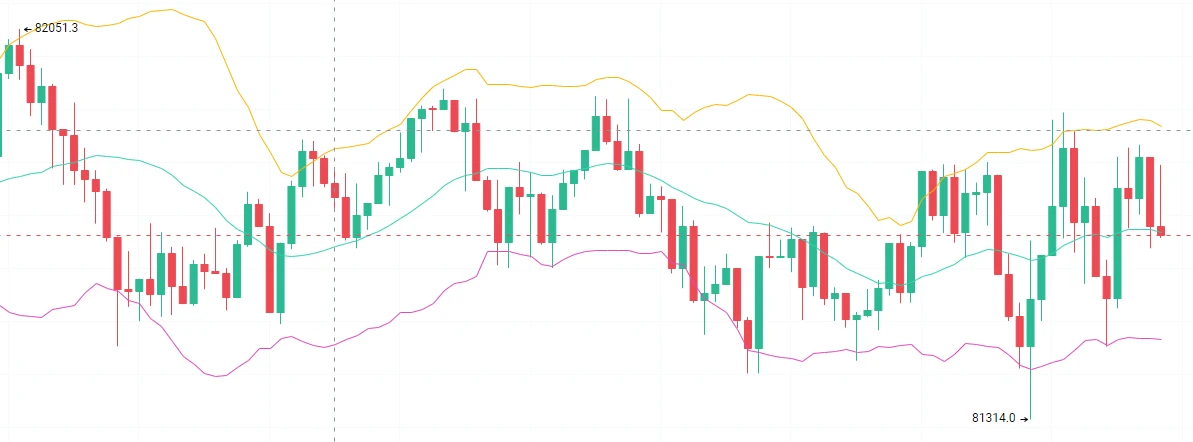
10.15 Bitcoin Price Action Analysis
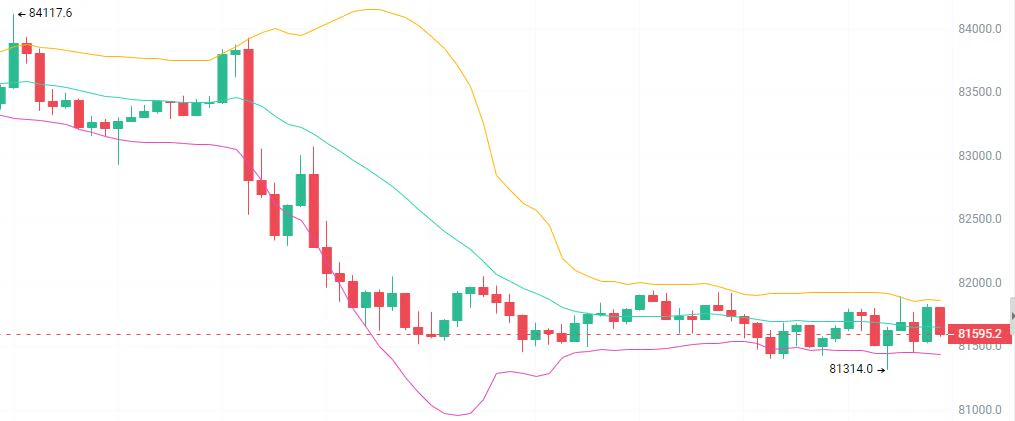
After an earlier surge to 83930.1, a large bearish candle quickly sent the market tumbling, and market conditions entered a sustained downtrend, with the price continuing to fall and reaching a low of 81314.0. After the decline, market conditions gradually stabilized and entered a prolonged period of low-level sideways consolidation. The Bollinger Bands continued to narrow, intensifying the bull-bear battle. The MACD indicator is in negative territory, with bearish momentum weakening, but the bulls have not fully taken the initiative. The market is currently
post-image
BTC-2.96%
10.15$BTC Silk Road
# Market Analysis
After surging to 84146.72, the market quickly plunged, falling to a low of 81398.37 before briefly stabilizing and moving sideways. The Bollinger Bands are opening downward, the MACD is in a death cross, and the green bars have narrowed somewhat, indicating slight exhaustion in bearish momentum. In the short term, the market is in a low-level consolidation and recovery phase following the sharp drop. Resistance above: 82200; support below: 81398.37.
## Bullish Strategy (Long)
✅Long rationale: After several consecutive sharp declines, the price stabilized a
post-image
BTC-2.96%
$XAUT 10.15 Gold outlook
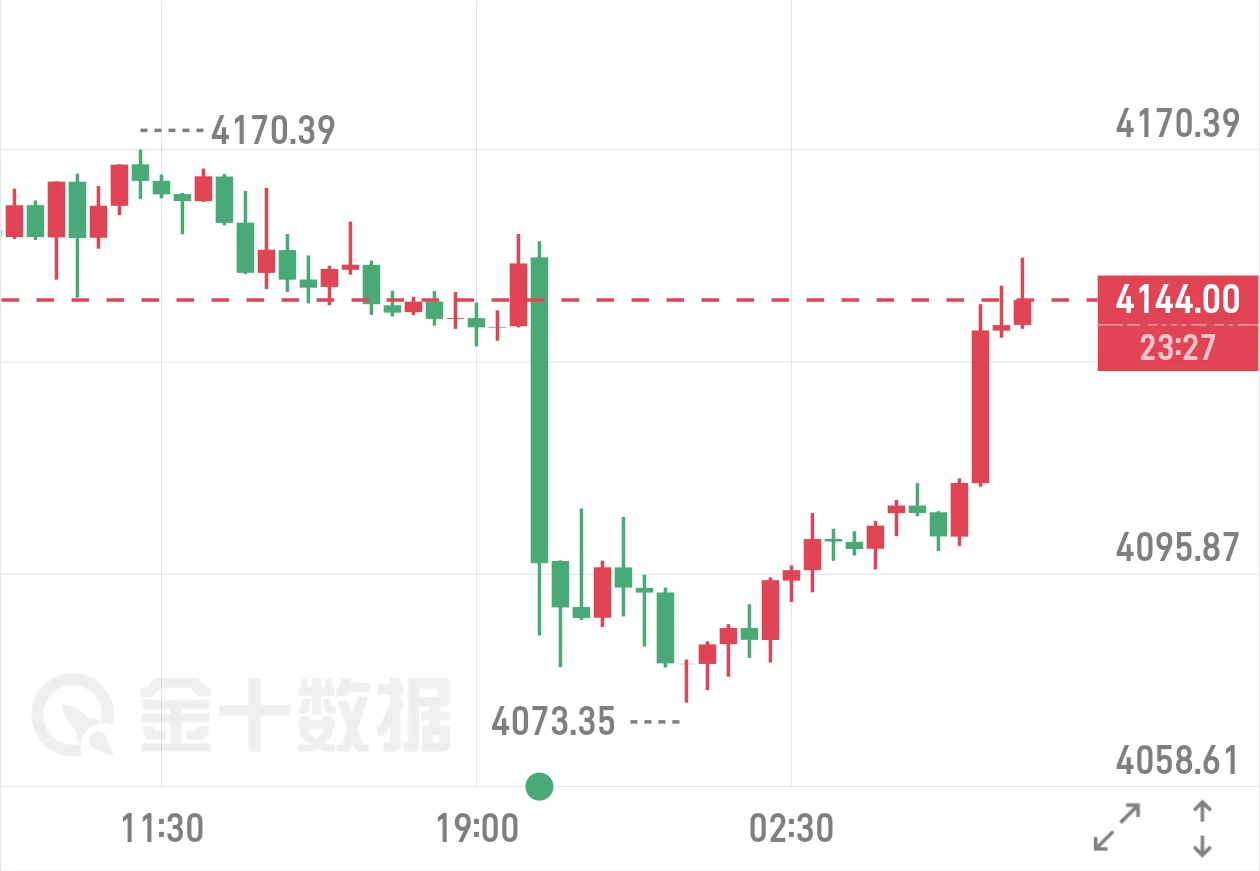
Yesterday, after the CPI data was released, the market moved in a “sharp drop followed by a rebound”: it first plunged rapidly to 4073, then bulls entered to buy the dip, leading to a rebound and choppy consolidation
From the price action, the rebound was clearly weak. On the hourly chart, the price stalled as soon as it touched the middle band. Although the minute-level MACD formed a golden cross, the red bars were limited in length, indicating clearly insufficient upward momentum
The core logic has not changed. The prudent approach remains to sell into rebounds
Trade
post-image
XAUT-0.65%
BTC PREDICTION MARKET UPDATE
live-cover
LIVE1,297
Load More

Join 40 M users in our growing community

⚡️ Join 40 M users in the crypto craze discussion

💬 Engage with your favorite top creators

👍 See what interests you

Trending Topics

USSeptemberCPITopsEstimates

36.22k Views2.56k Discussing

US September CPI rose 3.7% YoY, above the 3.6% estimate; core CPI rose 2.6%, also above the 2.5% estimate. With inflation topping forecasts across the board, how will rate hike expectations shift? How will BTC react? Share your view.

WillYouBuyDipInKoreanStocks

46.99k Views1.71k Discussing

DrLinHanSpeaksAtOxfordUnion

135.24k Views1.85k Discussing

View More