






#美国初请失业金人数高于预期 U.S. Jobless Claims Hit 200K Against Hot Inflation: Why the Fed Remains Trapped Between Two Conflicting Signals
As of November 15, 2026, macroeconomic traders are staring at one of the hardest policy puzzles of the year: a labor market showing early signs of cooling at the margin while consumer and wholesale inflation refuse to retreat. When the U.S. Department of Labor reported that weekly initial jobless claims climbed to 200,000 against consensus expectations of 194,000, hopeful bulls immediately asked whether softer employment data might revive Federal Reserve rate-cut bets. Yet looking at the complete macro picture shows why one weekly tick upward is nowhere near enough to force a dovish policy pivot.
1. Decoding the 200K Claims Print: Marginal Softening, Not Distress
A single headline beat on jobless claims rarely shifts Federal Reserve thinking without broader confirmation across underlying labor metrics:
• Historical Context: While 200,000 initial filings exceeded the 194,000 estimate, claims at or below the 200,000 threshold still reflect remarkably tight labor conditions by multi-decade standards. Employers are slowing new hiring at the edges rather than executing widespread layoffs.
• Four-Week Trend Stability: Smoothing out weekly filing fluctuations keeps the four-week moving average anchored below 200,000, while continuing claims remain historically contained—proving displaced workers are still finding new roles relatively quickly.
• October Payrolls & Unemployment: Paired with October’s resilient nonfarm payroll additions and a low 4.1% unemployment rate, the U.S. employment backdrop still shows far more durability than weakness.
2. Why Inflation Remains the Fed’s Primary Target
To understand which signal the Federal Reserve prioritizes next, compare the minor uptick in claims against recent price data:
• Hot October CPI & Sticky Annual PPI: Consumer inflation continues running uncomfortably above the Fed’s 2% target, while October’s Producer Price Index—despite cooling to +0.3% month-over-month—accelerated to +6.5% year-over-year, its highest annual pace since November 2022.
• Policy Mandate Reality: When employment sits near full capacity and annual inflation runs above 3%–6%, central bankers prioritize price stability every time. With interest-rate markets pricing an overwhelming probability of another 25-basis-point rate hike in December rather than rate cuts, a 6,000-claim miss on weekly filings does not give policymakers room to ease.
3. The Stagflation Dilemma: What If Jobs Weaken While Inflation Stays Hot?
This brings us to the sharpest risk facing financial markets heading into year-end: what happens if employment weakens further while inflation stays elevated?
That combination—slowing growth alongside sticky prices—is the classic stagflation trap, and it is rarely bullish for risk assets in the short term:
• Why Jumping In Early Carries High Risk: If unemployment rises while CPI and core services inflation remain stubborn, the Fed cannot immediately rescue markets with aggressive rate cuts without reigniting inflation expectations.
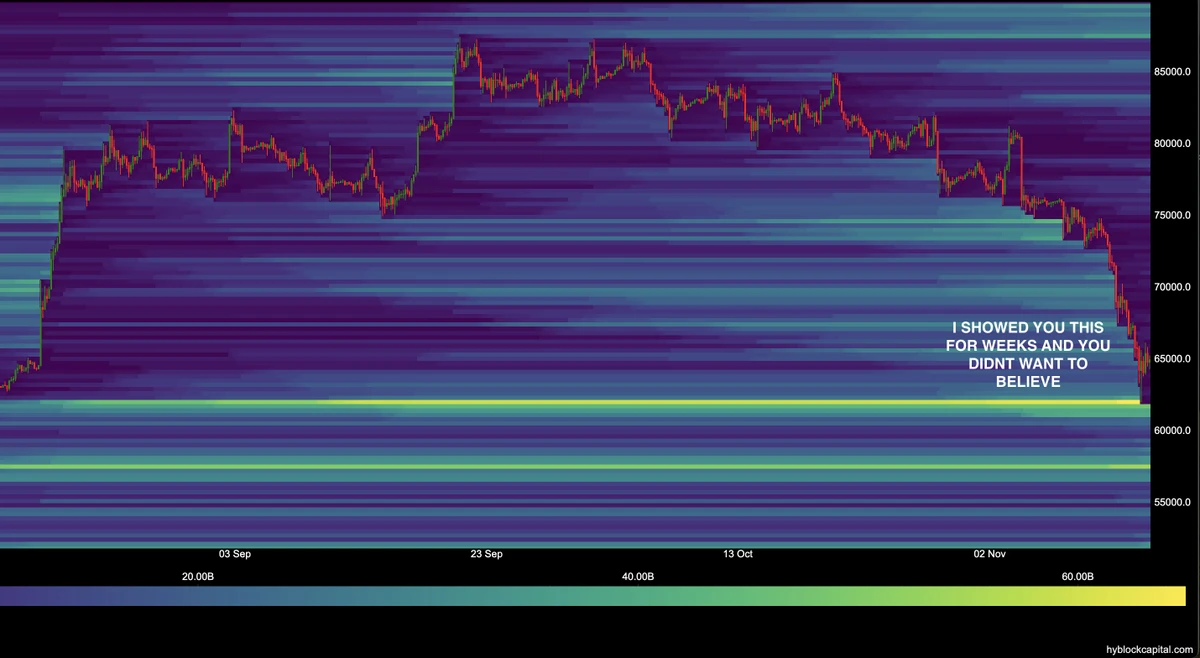
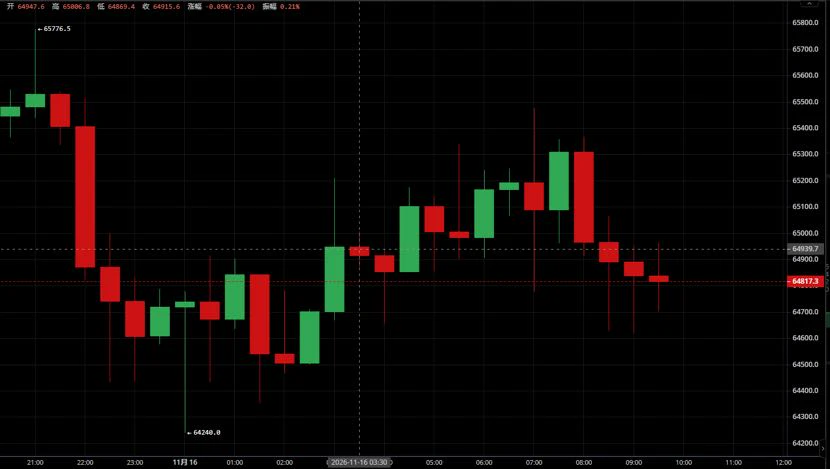
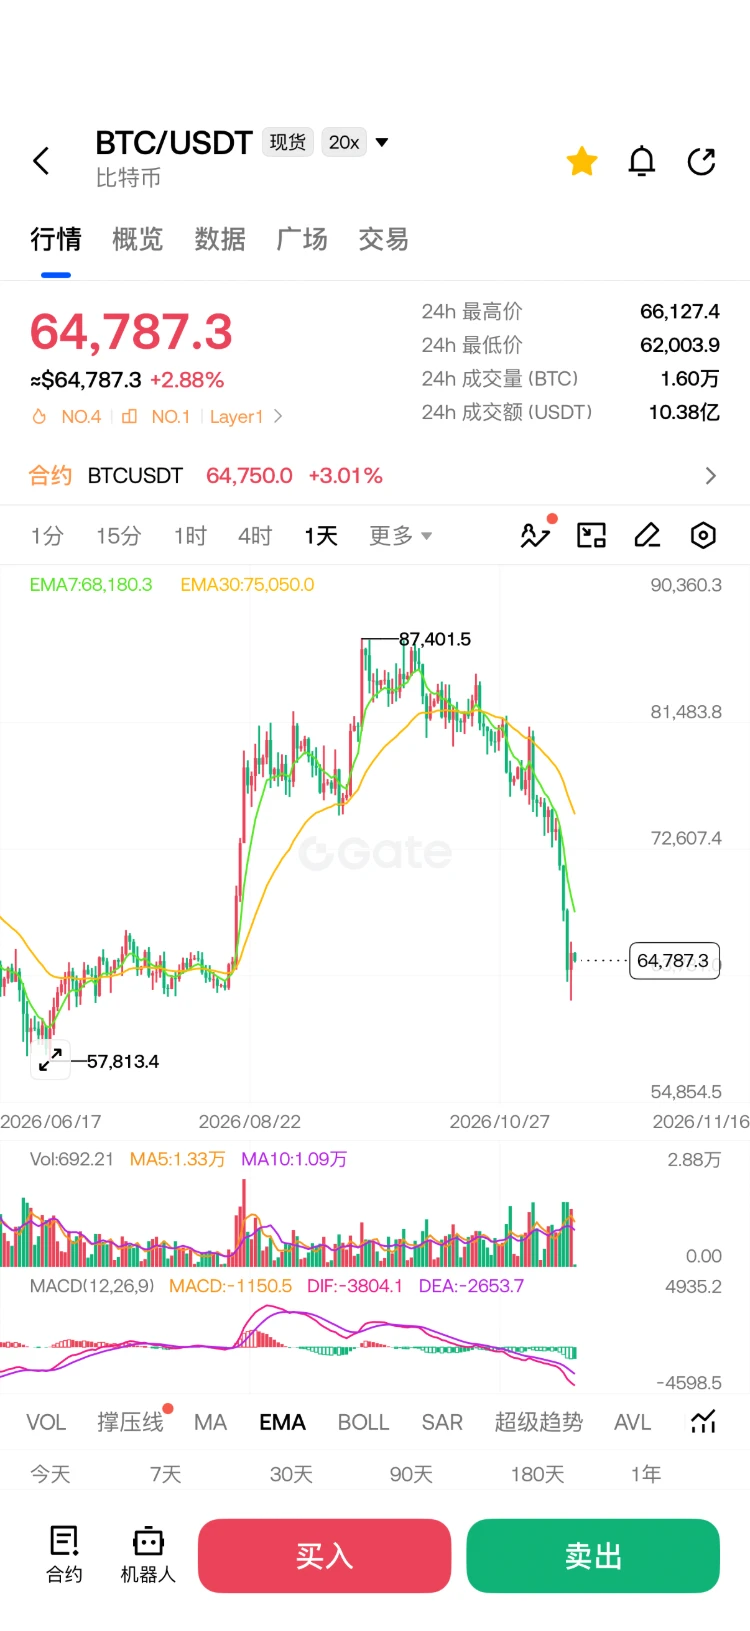
• Impact on Bitcoin ($BTC ) and U.S. Equities: High-beta tech stocks and Bitcoin—which recently slipped beneath $70,000 toward the $64,700–$67,600 zone amid elevated Treasury yields, a strong U.S. dollar, and spot ETF outflows—thrive on expanding liquidity, not policy gridlock. Until inflation cools decisively, rallies driven purely by weak employment headlines risk fading into overhead resistance.
Strategic Takeaway: Cooling Inflation Matters More Right Now
Right now, markets need cooling inflation far more than resilient employment. A strong job market only hurts risk assets when it keeps the Fed hiking; conversely, a clear, multi-month downtrend in CPI and core producer prices is the only catalyst capable of bringing down Treasury yields and unlocking sustainable liquidity for both U.S. stocks and Bitcoin. Until inflation breaks lower, patience, staged entries, and strict risk management remain far wiser than chasing early rate-cut rumors.
#USJoblessClaimsBeatExpectations
#ShareWeekly #WCTCS9
As of November 15, 2026, macroeconomic traders are staring at one of the hardest policy puzzles of the year: a labor market showing early signs of cooling at the margin while consumer and wholesale inflation refuse to retreat. When the U.S. Department of Labor reported that weekly initial jobless claims climbed to 200,000 against consensus expectations of 194,000, hopeful bulls immediately asked whether softer employment data might revive Federal Reserve rate-cut bets. Yet looking at the complete macro picture shows why one weekly tick upward is nowhere near enough to force a dovish policy pivot.
1. Decoding the 200K Claims Print: Marginal Softening, Not Distress
A single headline beat on jobless claims rarely shifts Federal Reserve thinking without broader confirmation across underlying labor metrics:
• Historical Context: While 200,000 initial filings exceeded the 194,000 estimate, claims at or below the 200,000 threshold still reflect remarkably tight labor conditions by multi-decade standards. Employers are slowing new hiring at the edges rather than executing widespread layoffs.
• Four-Week Trend Stability: Smoothing out weekly filing fluctuations keeps the four-week moving average anchored below 200,000, while continuing claims remain historically contained—proving displaced workers are still finding new roles relatively quickly.
• October Payrolls & Unemployment: Paired with October’s resilient nonfarm payroll additions and a low 4.1% unemployment rate, the U.S. employment backdrop still shows far more durability than weakness.
2. Why Inflation Remains the Fed’s Primary Target
To understand which signal the Federal Reserve prioritizes next, compare the minor uptick in claims against recent price data:
• Hot October CPI & Sticky Annual PPI: Consumer inflation continues running uncomfortably above the Fed’s 2% target, while October’s Producer Price Index—despite cooling to +0.3% month-over-month—accelerated to +6.5% year-over-year, its highest annual pace since November 2022.
• Policy Mandate Reality: When employment sits near full capacity and annual inflation runs above 3%–6%, central bankers prioritize price stability every time. With interest-rate markets pricing an overwhelming probability of another 25-basis-point rate hike in December rather than rate cuts, a 6,000-claim miss on weekly filings does not give policymakers room to ease.
3. The Stagflation Dilemma: What If Jobs Weaken While Inflation Stays Hot?
This brings us to the sharpest risk facing financial markets heading into year-end: what happens if employment weakens further while inflation stays elevated?
That combination—slowing growth alongside sticky prices—is the classic stagflation trap, and it is rarely bullish for risk assets in the short term:
• Why Jumping In Early Carries High Risk: If unemployment rises while CPI and core services inflation remain stubborn, the Fed cannot immediately rescue markets with aggressive rate cuts without reigniting inflation expectations.
• Impact on Bitcoin ($BTC ) and U.S. Equities: High-beta tech stocks and Bitcoin—which recently slipped beneath $70,000 toward the $64,700–$67,600 zone amid elevated Treasury yields, a strong U.S. dollar, and spot ETF outflows—thrive on expanding liquidity, not policy gridlock. Until inflation cools decisively, rallies driven purely by weak employment headlines risk fading into overhead resistance.
Strategic Takeaway: Cooling Inflation Matters More Right Now
Right now, markets need cooling inflation far more than resilient employment. A strong job market only hurts risk assets when it keeps the Fed hiking; conversely, a clear, multi-month downtrend in CPI and core producer prices is the only catalyst capable of bringing down Treasury yields and unlocking sustainable liquidity for both U.S. stocks and Bitcoin. Until inflation breaks lower, patience, staged entries, and strict risk management remain far wiser than chasing early rate-cut rumors.
#USJoblessClaimsBeatExpectations
#ShareWeekly #WCTCS9