






Square
Following
Hot
News
Profile
Share your thoughts
placeholder
Article
$CFX Up 22% in a day with $192 million in trading volume—this is not retail-driven volume.
No financial headline came out, but the chart speaks for itself. The 24-hour low was 0.0505 and the high was 0.0649, nearly a 30-point range. A 192M trading volume on CFX constitutes a high-volume breakout. Conflux, this old homegrown public-chain coin, is usually dead quiet, but suddenly funds entered and started sweeping up tokens. Most likely, they are betting on some expectation—either an ecosystem partnership going live or the Hong Kong compliance narrative being revived for another round of specula
CFX+20.34%
Sometimes it feels like life itself is an absurd journey through the universe.
We’re busy buying time, rushing to get somewhere, and trying to resign from life, yet we forget that we may not have even finished Earth’s probationary period.
post-image
Financial News, Crypto Updates, Real Trading Strategies
live-cover
LIVE1,002
#Bots I'm trading AIAUSDT with the Futures Grid bot on Gate. Join me!
post-image
BOT+1.54%
  • 1
A perfect move, but I don't think it's over yet; we still need confirmation on whether this trend will continue. $CFX ‌
post-image
CFX+20.34%
10.11 Day-Session Strategy: Bearish Bias, Technical Long Trap, Narrowing Volatility, Continue to Be Bearish
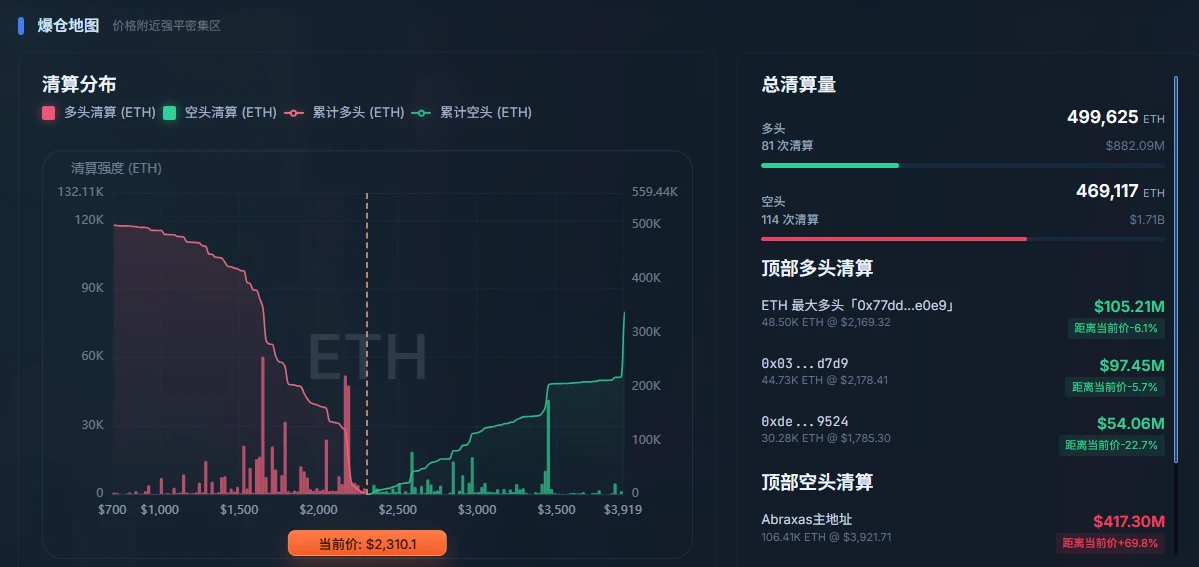
According to on-chain data analysis, Ethereum ($ETH ) holdings among major market participants have weakened significantly. Changes in open interest over both 30 days and 180 days are negative; whales have reduced their long exposure while increasing their short positions. Total open interest remains at approximately 10.58 million ETH, and market leverage exposure is still substantial, leaving Ethereum at risk of another round of forced liquidations.
The total number of contracts has decl
ETH+0.65%
  • 1
It took Japan's stock market 34 YEARS to recover from its 1989 peak:
In December 1989, the Nikkei 225 closed at a record 38,916, and Japan made up ~45% of global stock market value.
Then the bubble burst, and by March 2009 the index had fallen -82% to ~7,055.
The Nikkei did not set a new all-time high until February 2024, more than 34 years later.
Today, it trades near 68,871, roughly +77% above its 1989 peak.
In other words, an investor who bought at the top waited over three decades just to break even.
post-image
🌈 #GateLiveStreamingInspiration -October 11

Go live with the following topics now to receive extra official support and promotional exposure!
Today's Topic Recommendations:
🔹 XRP Ledger fixes a major vulnerability that existed nearly 11 years ago, which attackers could exploit to generate XRPs out of thin air.
🔹 "Robinhood's on-chain activity cools down: Daily active users down 31% from mid-September, DEX trading volume down 21%.
🔹 Poll: Trump's approval rating drags down Republicans; 26% of his own supporters call for a break.
🔹 Tom Lee: Ethereum may break $5,000 by the end of the year
post-image
XRP-0.22%
ETH+0.65%
  • 1
  • 1
crypto trade today
live-cover
LIVE343
  • 1
no reversal signal on cash-cat:native yet
taking the risk now
30% upside if it turns. SL if doesn't
post-image
It took Japan's stock market 34 YEARS to recover from its 1989 peak:
In December 1989, the Nikkei 225 closed at a record 38,916, and Japan made up ~45% of global stock market value.
Then the bubble burst, and by March 2009 the index had fallen -82% to ~7,055.
The Nikkei did not set a new all-time high until February 2024, more than 34 years later.
Today, it trades near 68,871, roughly +77% above its 1989 peak.
In other words, an investor who bought at the top waited over three decades just to break even.
post-image
CAN $JASMY REACH BACK TO A $2.9B MARKET CAP? 👀
post-image
JASMY+0.41%
How come BTT's trading volume is so large
post-image
BTT+0.41%
Thank you for witnessing me go from 0% to 1348% in ten days.
I never went heavily into a position or went all in.
I hope we can reach 2000%, 3000%, 5000%, and 10000% together.
The track record I have built across major exchanges absolutely did not come from going all in. <
My system is simple: I use technical analysis and indicators to strictly screen every token, project team, ecosystem, positive and negative catalysts, macro conditions, and technical factors, determining whether to enter and, most importantly, at which level. I use high-frequency pin-bar naked-candlestick arbitrage, repeated
🔥U.S. spot Bitcoin ETF holdings have surpassed 2.013 million BTC, accounting for 10.02% of the circulating supply, with a total market value of approximately $227.6 billion.
👉Long term: Institutions continue to lock up BTC, reducing the market’s liquid supply and establishing long-term supply-demand support.
⚠Short term: The bullish impact is a slow-moving variable! The market remains constrained by the Federal Reserve, U.S. Treasuries, and geopolitical factors.
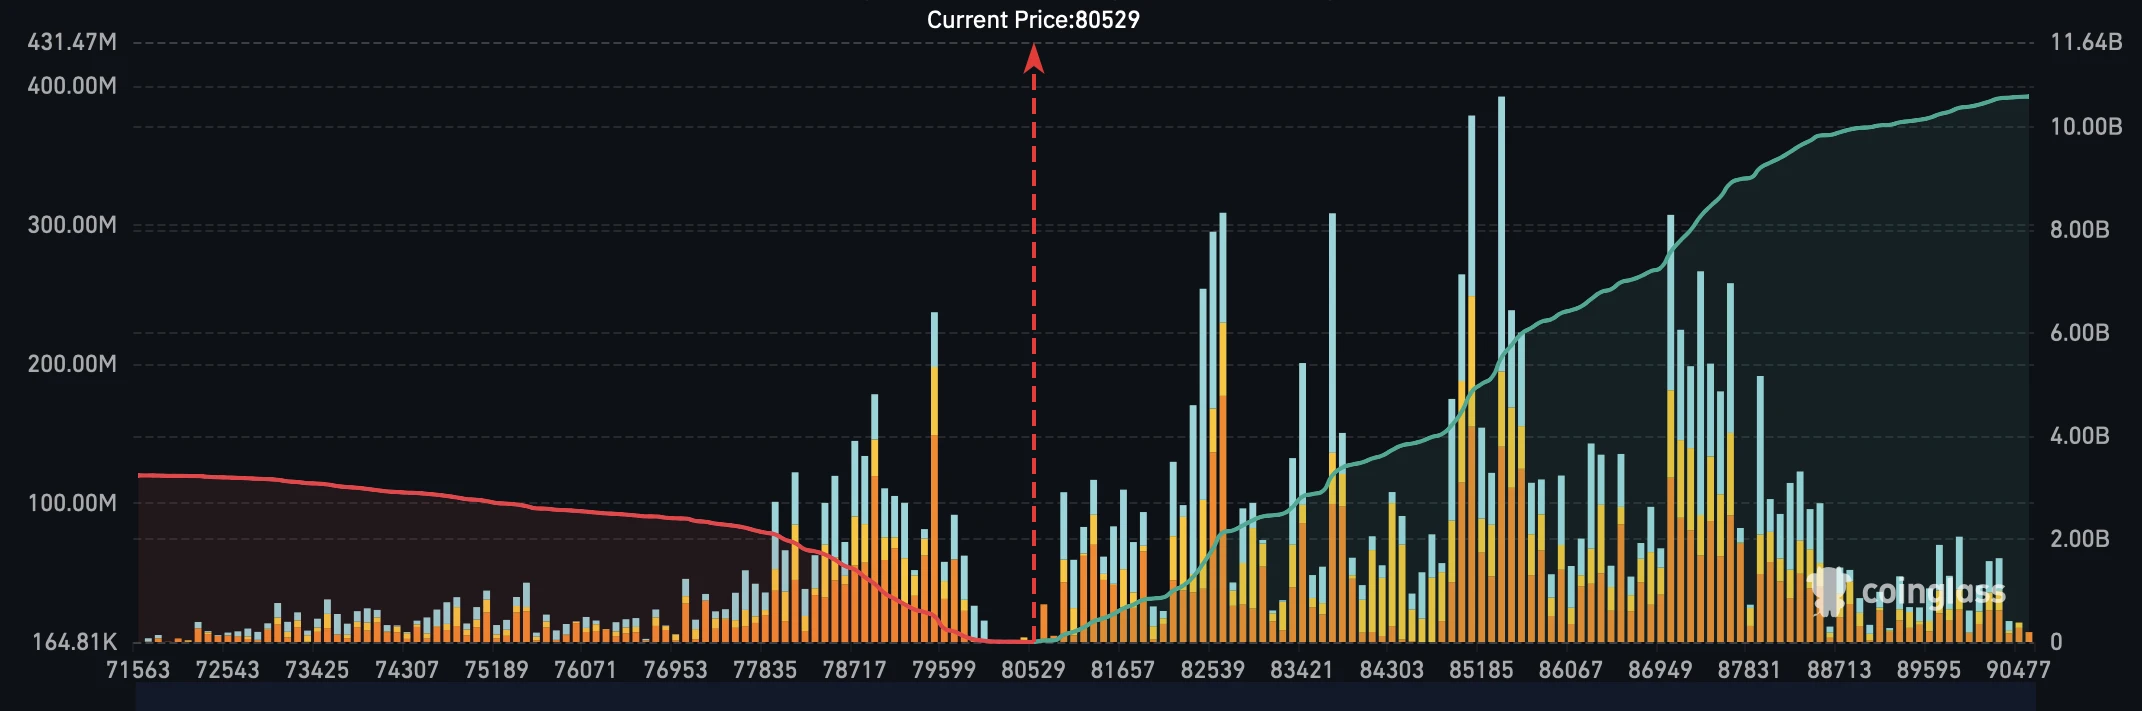
Support 81200|Resistance 86000-87500
Keep a close eye on daily ETF fund flows: Net inflows could drive a rebound, while a shift to
post-image
BTC+0.66%
Less well-known lesson from 10/10: ADL, the automatic reduction of positions.
→ A winning position can be reduced to cover other users’ losses
→ Portfolios that were supposed to be neutral became directional
LA+7.76%
#BTC回调触及81000美元
#BTCPullsBackTo81000
BITCOIN MARKET OUTLOOK: BTC RECOVERS TOWARD $83,000 — IS $85,000 THE NEXT BREAKOUT LEVEL?
Bitcoin is trading around the $82,000–$83,000 range according to the latest price reference provided for this analysis, recovering from its recent decline toward the $80,000–$81,000 support zone. This rebound brings renewed attention to an important question: Is BTC preparing for a stronger recovery, or is this simply a temporary bounce before another downward move?
My current outlook is cautiously optimistic about the short-term recovery but remains defensive until
BTC+0.45%
With silver prices this time around, trading volume has surged, but the price has barely moved—a typical sign of stagnation. After trading for so long, position sizing is always more important than predicting the direction. What have you observed on your end? On my end, I’m watching to see whether a certain coin can first hold its ground. Keep an eye on it if you’re following it #silver
post-image
XAG-0.26%
  • 4
#GateEventMarketVolumeHits73M
Gate × Polymarket: $73 Million in Monthly Volume Shows Why Prediction Markets Are Becoming a New Battleground for Crypto Platforms
What if the next major competition between crypto platforms is not about listing more coins, offering higher leverage, or attracting traders with lower fees—but about giving users a reason to open the app even when they have no intention of trading crypto?
That is the bigger question behind Gate’s integration with Polymarket.
In March 2026, Gate integrated Polymarket into its platform, bringing event-based prediction markets into a c
Don't rush to take a position on $ADA . The 1-hour and 4-hour charts are still in conflict, and this is when it's easiest to mistake a rebound for a reversal. I'd rather lay out the bearish case first.
Bears are focused on the risk after a break below 0.2424, while bulls need to prove that buyers remain after a break above 0.2595. Current volume is 0.63x.
The current price is 0.25, about 3.04% from the 1-hour support at 0.2424 and about 3.80% from the resistance at 0.2595. Position determines which side is more urgent; the next level to watch is 0.2238.
Waiting for the boundaries to provide an
post-image
ADA+0.92%
Load More

Join 40 M users in our growing community

⚡️ Join 40 M users in the crypto craze discussion

💬 Engage with your favorite top creators

👍 See what interests you

Trending Topics

GateAtTOKEN2049

40.14k Views21.59k Discussing

Gate brought a series of major events to TOKEN2049 Singapore! From the official launch of Gate Money to the F1 Red Bull driver meet-and-greet and the Gate Gala, we witnessed a new chapter of "One Gate, Borderless Finance." Which moment from TOKEN2049 stood out most to you?

LedgerLossesNear90Million

39.16k Views205 Discussing

GateWCTCS9GlobalTradingCompetition

33.72k Views4.94k Discussing

View More