Square
Following
Hot
News
Notifications
Profile
Share your thoughts
placeholder
Article
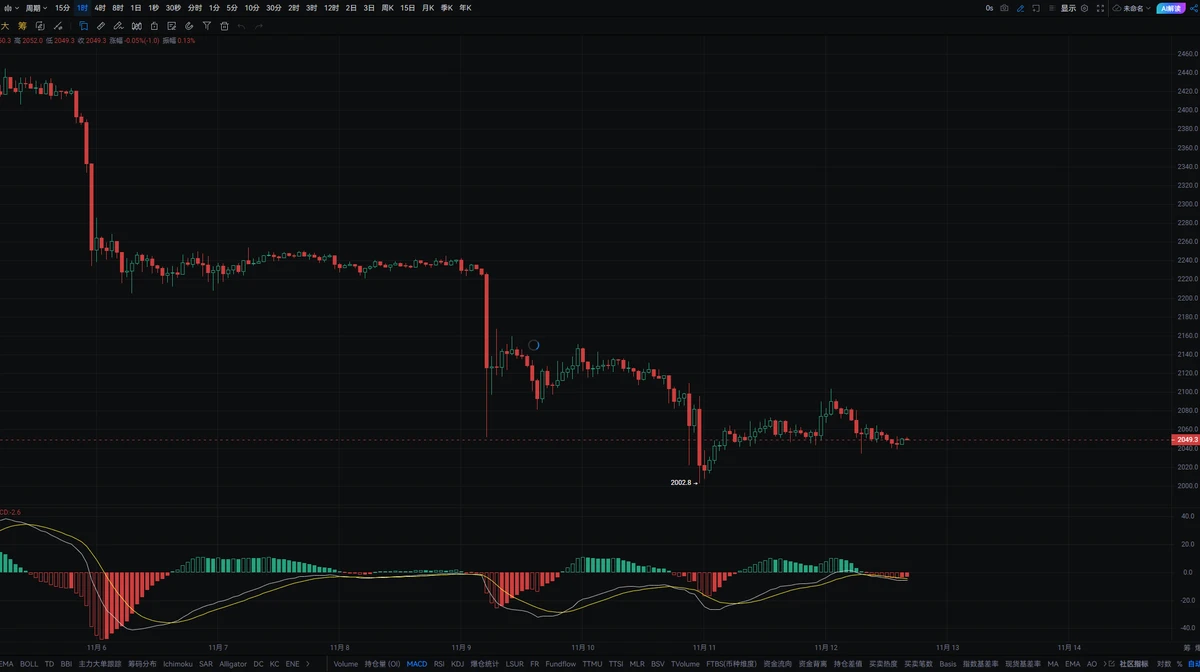
The bearish trend dominated all day, and high-level shorts across multiple coins—BTC, ETH, ZEC, and SOL—all paid off.
Rallies met resistance, highs marked turning points, and every target was hit. We followed the trend and took profits, staying in rhythm throughout. #美国就业数据今晚公布 $BTC ‌$ETH ‌
BTC-0.65%
ETH-1.23%
The Impact of Tomorrow Night’s PPI Data on the Crypto Market

The US October PPI will be released at 21:30 tomorrow night. As a leading inflation indicator, it will directly affect expectations for Fed rate hikes and feed through to the crypto market. Current market expectations: annual rate, previous 6.3%, expected 6.6%; monthly rate, previous 1.3%, expected 0.4%.

Three Scenarios

1: Data comes in above expectations: Inflation proves stickier than expected, pushing up the US dollar and Treasury yields. The crypto market comes under broad pressure, with major coins pulling back and altcoins f
post-image
BTC-0.65%
ETH-1.23%
Trenches
Max
M
bade
b
Max
5qaP...pump
Market Cap
$.
Change
.
24h Vol
$.
Holders
.
mihao
m
bade
b
mihao
4Cxj...pump
Market Cap
$.
Change
.
24h Vol
$.
Holders
.
AGT
A
bade
b
AGT
0x5d...e274
Market Cap
$.
Change
.
24h Vol
$.
Holders
.
DacityCoin
D
bade
b
DacityCoin
DKYc...pump
Market Cap
$.
Change
.
24h Vol
$.
Holders
.
IDOL
I
bade
b
IDOL
0x3b...ab07
Market Cap
$.
Change
.
24h Vol
$.
Holders
.
Arbitrum now hosts 5,772 tokenized real-world assets, more than any other blockchain, ahead of Solana's 3,563 and Ethereum's 3,367.
That is more than 1.71 tokenized assets on Arbitrum for every 1 on Ethereum.
@arbitrum
ARB+1.17%
SOL-0.77%
ETH-1.26%
$ENA $ENA Whales keep transferring in to dump! More downside ahead! Short, short, short! Live in a palace! Take a quick trade and get out!
post-image
ENA+8.04%
#BTC The current price is 73615. Prices have pulled back again, extending the recent pattern of weak, range-bound trading. The bulls lack the strength to sustain a rebound, while persistent selling pressure continues to weigh on the market. Near-term resistance is at 74400-74800. Only a high-volume move above and hold in this zone could reverse the current weakness and open the way for a test of resistance near 76000. Key support below is at 73000, the main battleground for bulls and bears in recent trading. A decisive break below it would give bears more room to push prices lower, with the ne
post-image
BTC-0.65%
  • 6
  • 2
Gm☕
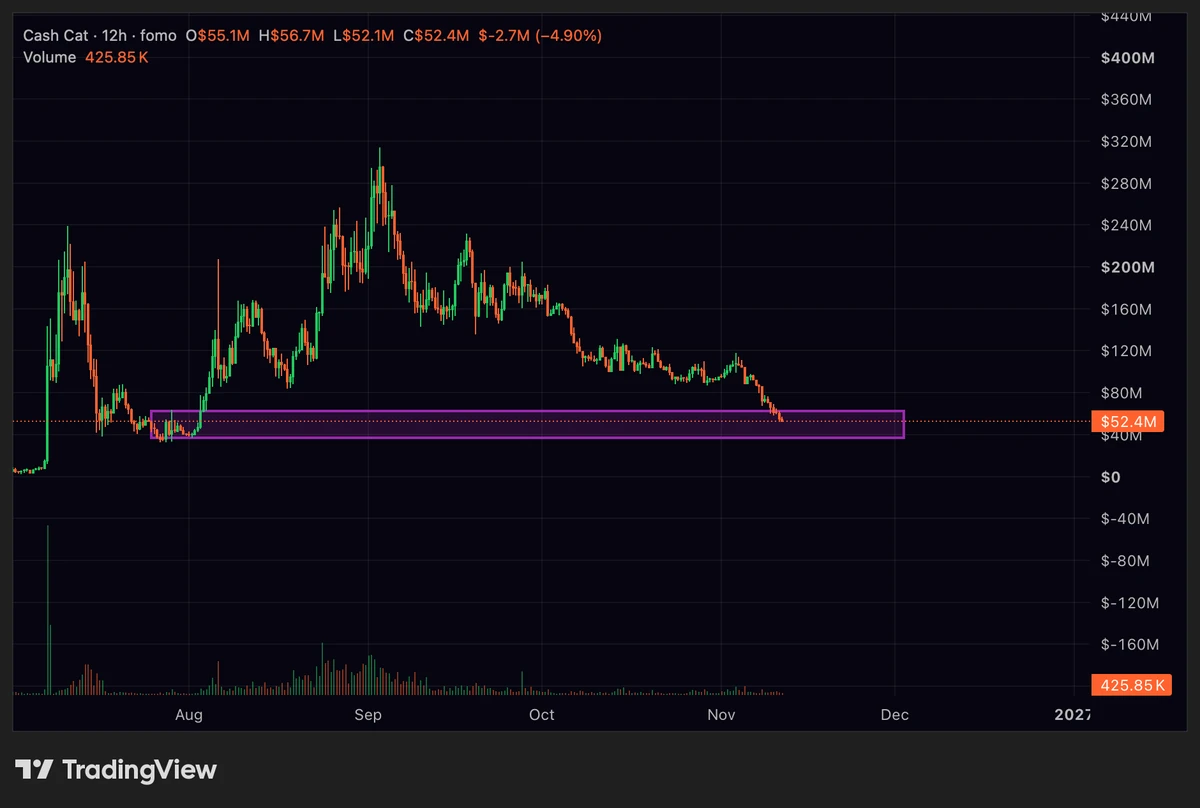
cashcat at major support.
next few days will show us if this coin has future.
post-image
CASHCAT-0.08%
$1000PEPE It plunged 13% in a day, and buyers started stepping in at 0.0045. 24h trading volume was $517 million, with no drop in volume, which means it’s not dead quiet—people are swapping hands. It touched a low of 0.0044 once without breaking below it, so there’s some short-term support. Sentiment-wise, this move was a panic sell-off by profit-takers, not a collapse in fundamentals; it was driven by the broader pullback in the meme sector. My plan: enter in batches in the 0.0044–0.0045 range, with a 20% position; stop-loss at 0.0042—if it breaks below, exit and don’t hold on. First take-pro
MEME-0.94%
  • 11
The Next Step in AI and Web3 Integration: Turning Complex Technology into a Simple Experience

When people talk about Web3, they often focus on blockchain performance, transaction speed, the degree of decentralization, and technical architecture. But for ordinary users, what ultimately determines whether a technology can be widely adopted is often not how complex it is under the hood, but how easy it is to use.

Imagine users being able to complete a cross-platform task without needing to understand the differences between blockchains, repeatedly search for data, or switch between multiple app
post-image
BTC market update
live-cover
LIVE1,944
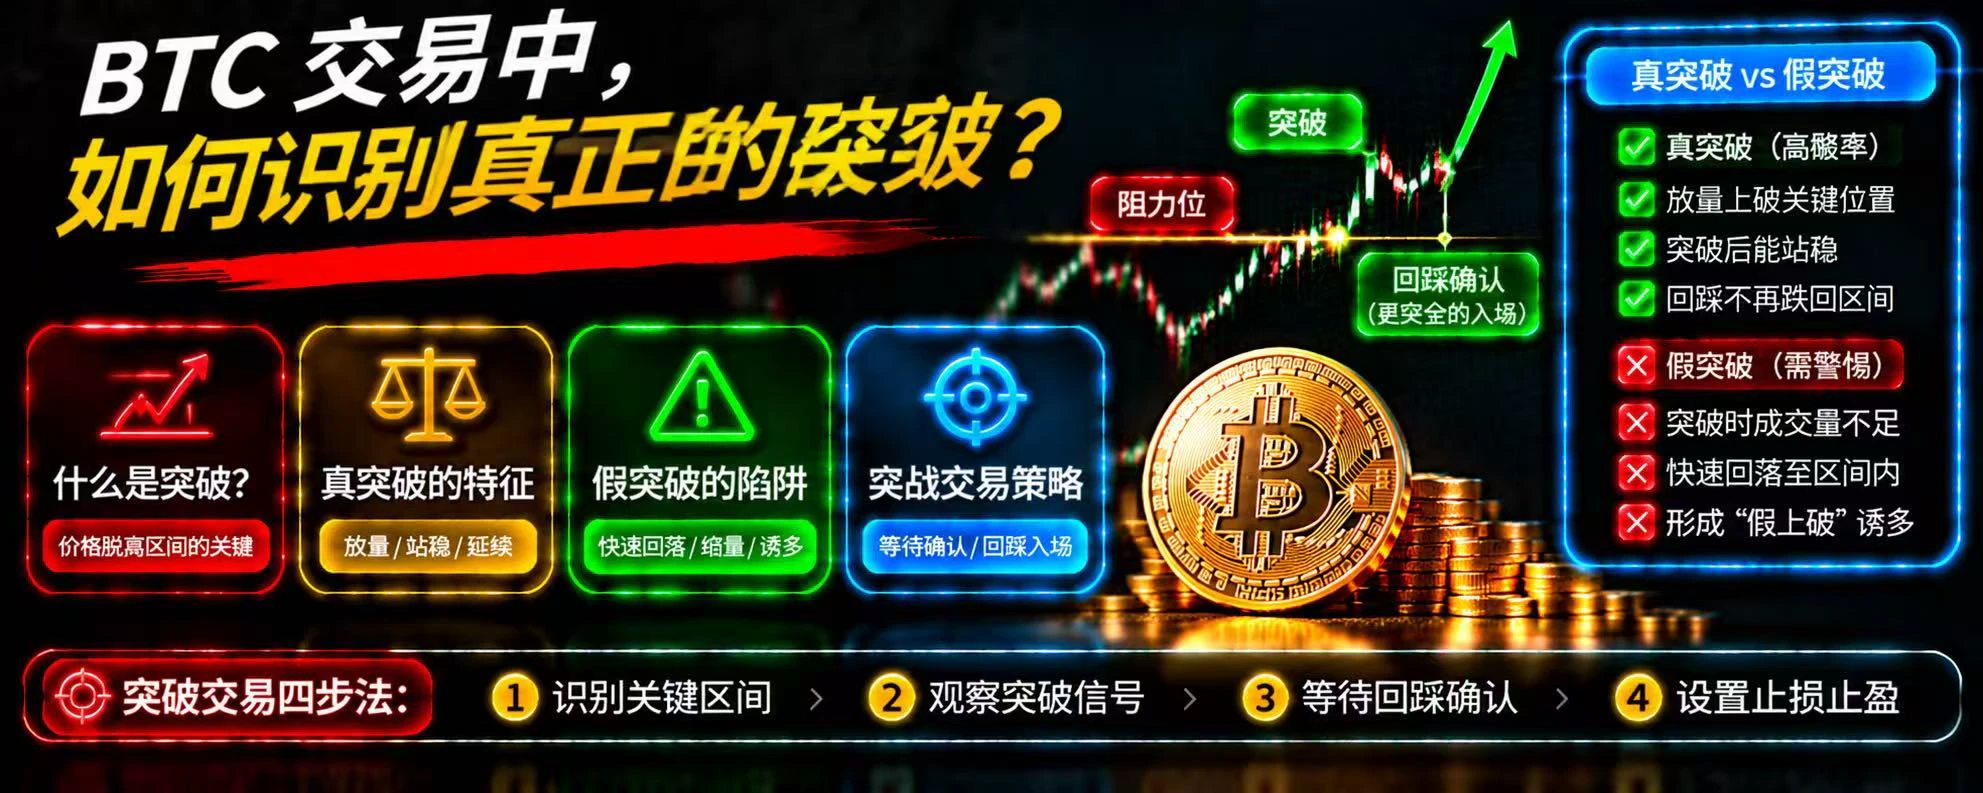
How to Identify a Genuine Breakout in BTC Trading and Avoid Getting Lured into Long Positions by a Fakeout!

In BTC trading, breakouts often signal new trading opportunities, but they’re also when it’s easiest to misread the market. When the price suddenly breaks above a previous resistance level, many traders worry about missing out on a rally and immediately chase the price higher. However, some breakouts are just brief price moves, after which the price quickly pulls back, leaving those who chased the rally in a difficult position.

So how can you tell whether a breakout is worth paying att
post-image
BTC-0.67%
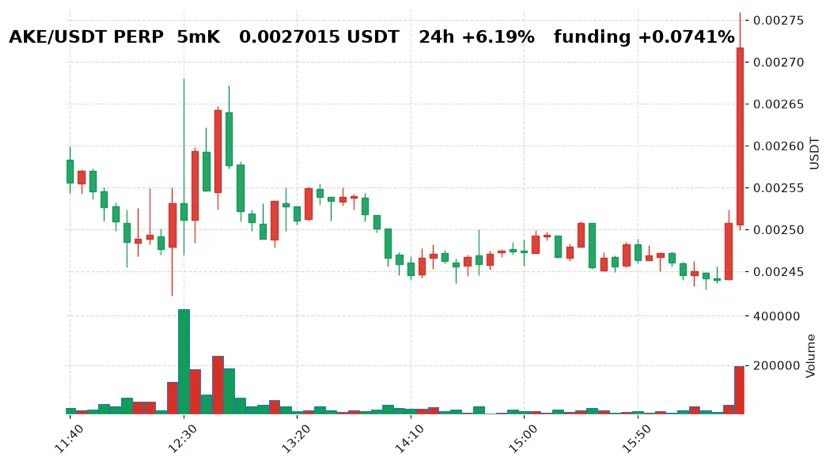
While killing time scrolling, I came across $AKE and saw it jump +10.94% in five minutes. It’s now at 0.0027015 U, with just 9.8M in 24h trading volume. I’ll probably just watch again as 😅 funding rate is +0.0741%, with both longs and shorts looking a bit crowded. First resistance above is at 0.0027906. Perpetuals move fast, and I really don’t dare touch leverage, so I’ll just make a note and not chase. #摸鱼看盘 #AKE
post-image
AKE+6.39%
Last night, I said to watch 3930 for gold. It’s now only a dozen or so points away, very close to that level. But looking at the current trend, there are no bottoming or reversal candles on any timeframe. This isn’t a point to try going long. Wait for now, until a signal appears. Ideally, it gets close to 3870 without breaking below it $XAUUSD
XAUUSD-1.13%
market updates on gate
live-cover
LIVE1,910
$NVDA They just caught Jensen Huang having a second affair with a female employee.
Michael Burry knew all this, which is why he was bearish.
Now it all makes sense: we were looking in the wrong place; capex didn’t matter.
post-image
NVDA+2.99%
Why does the price quickly fall back after breaking through a key level?

In the cryptocurrency market, breakouts are often seen as signals that a trend is starting.

When the price breaks through resistance, some traders immediately chase the rally; when it falls below support, others quickly go short.

But sometimes, just after the price breaks through a key level, it suddenly reverses and returns to its previous trading range.

This phenomenon is commonly called a “false breakout.”

The real question is not whether the price broke through, but whether the market can hold in the new price ra
post-image
$AGT — Sellers are pushing the price further down 🔻AGT is showing weakness around $0.0678. If sellers continue to dominate and the price breaks below nearby support, we may see further downside toward the next support area. Trading plan: Short 📉 Entry: 0.06750 – 0.06800 Take Profit 1: 0.06600 Take Profit 2: 0.06450 Take Profit 3: 0.06250 Stop Loss: 0.07050
post-image
AGT-26.77%
Fewer and fewer opportunities are emerging, but good ones are worth waiting patiently for
The market has been increasingly choppy lately, and there are few opportunities truly worth taking

The longer you trade, the more you understand: when opportunities are scarce, it’s even more important to stay composed. Make a plan in advance, wait for the market to reach your expected level, then execute decisively
$BTC $ETH #美国就业数据今晚公布
BTC-0.67%
ETH-1.26%
For an ecosystem to grow sustainably, it cannot focus only on the progress it has made. It also needs to carefully consider: What do users really need? Have existing problems been solved? What else is worth improving next?

For ONEA, continuously listening and constantly improving are important approaches to driving ecosystem development. Technical development can provide a foundation, product applications can create value, and genuine feedback from users and the community can help the project identify problems, adjust its direction, and make future development better aligned with real needs.
post-image
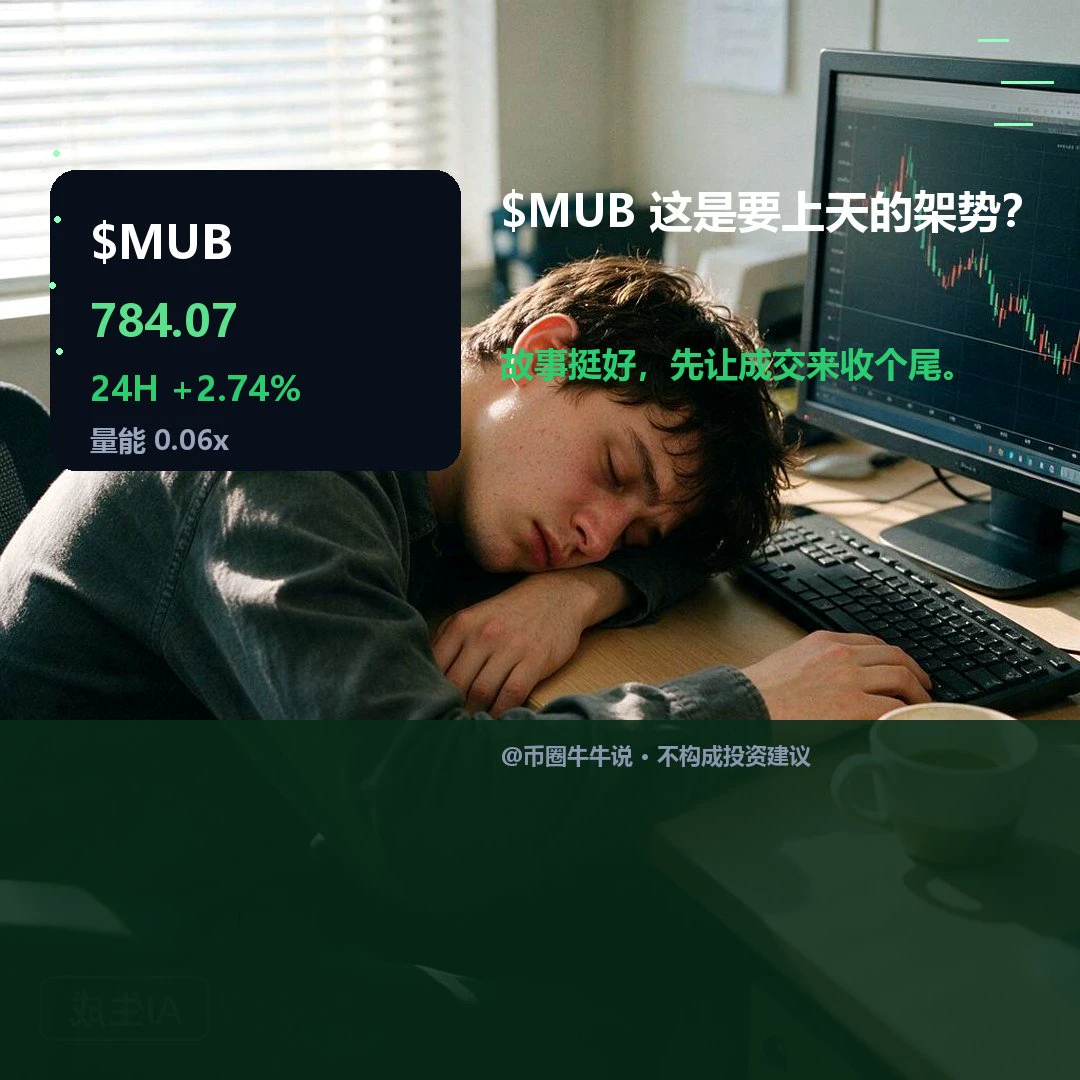
$MUB Currently at 784.07, up 2.74% over 24H. The 1H trend is weak (RSI 27.74), while the 4H trend is strong (RSI 66.03), showing a clear divergence between the two timeframes, with subdued 1H volume. If it holds above the resistance at 827.91, a short-term recovery may be worth watching. If it breaks below the support at 763.85 and fails to reclaim it, the short-term outlook may weaken. Going forward, focus on whether it can hold above 827.91; if it breaks below 763.85 and fails to recover, the thesis is invalidated. Markets are volatile; for observation only.
post-image
$BERA — Short entry: 0.1010 TP1: 0.0975 TP2: 0.0935 Stop-loss: 0.1065 Consecutive candlesticks have made progressively lower highs, while rebounds remain limited. Around 0.1000 is the key test level for now; if it gives way, there is still room for further downside.
post-image
BERA-2.60%
Load More

Join 40 M users in our growing community

⚡️ Join 40 M users in the crypto craze discussion

💬 Engage with your favorite top creators

👍 See what interests you

Trending Topics

GateIPOAccessAnthropic

252.9K Views2.3K Discussing

Gate IPO Access Phase 3 features Anthropic (ANT), with USDT subscription interest starting from 100 USDT. Successful allocations will be delivered as real shares to Gate Stock Accounts. Indicative price: $70–$78/share Subscription: Nov 12–17 (UTC+8) Allocation is not guaranteed. Please manage risk accordingly.

USJoblessClaimsTonight

168.5K Views32.9K Discussing

GateOctoberTransparencyReport

239.5K Views1.9K Discussing

View More