


Square
Following
Hot
News
Profile
Share your thoughts
placeholder
Article
$NIL NIL as a upward coin
1D
Nilion in the daily time frame has broken its resistance and is now resting and shaping a pullback at 0.08263.
4H
It has had a strong upward move, then shaped a lower high and lower low, so it now has a downtrend line. Volume also confirms the trend: when price increases, volume increases too, and when it rests, volume decreases.
If it breaks the trend line and shapes a higher high and higher low, it can be suitable for a long position. Volume must confirm the trend.
15m
In this time frame, it has a range box. If volume moves upward when the ceiling of the box brea
post-image
NIL-5.73%
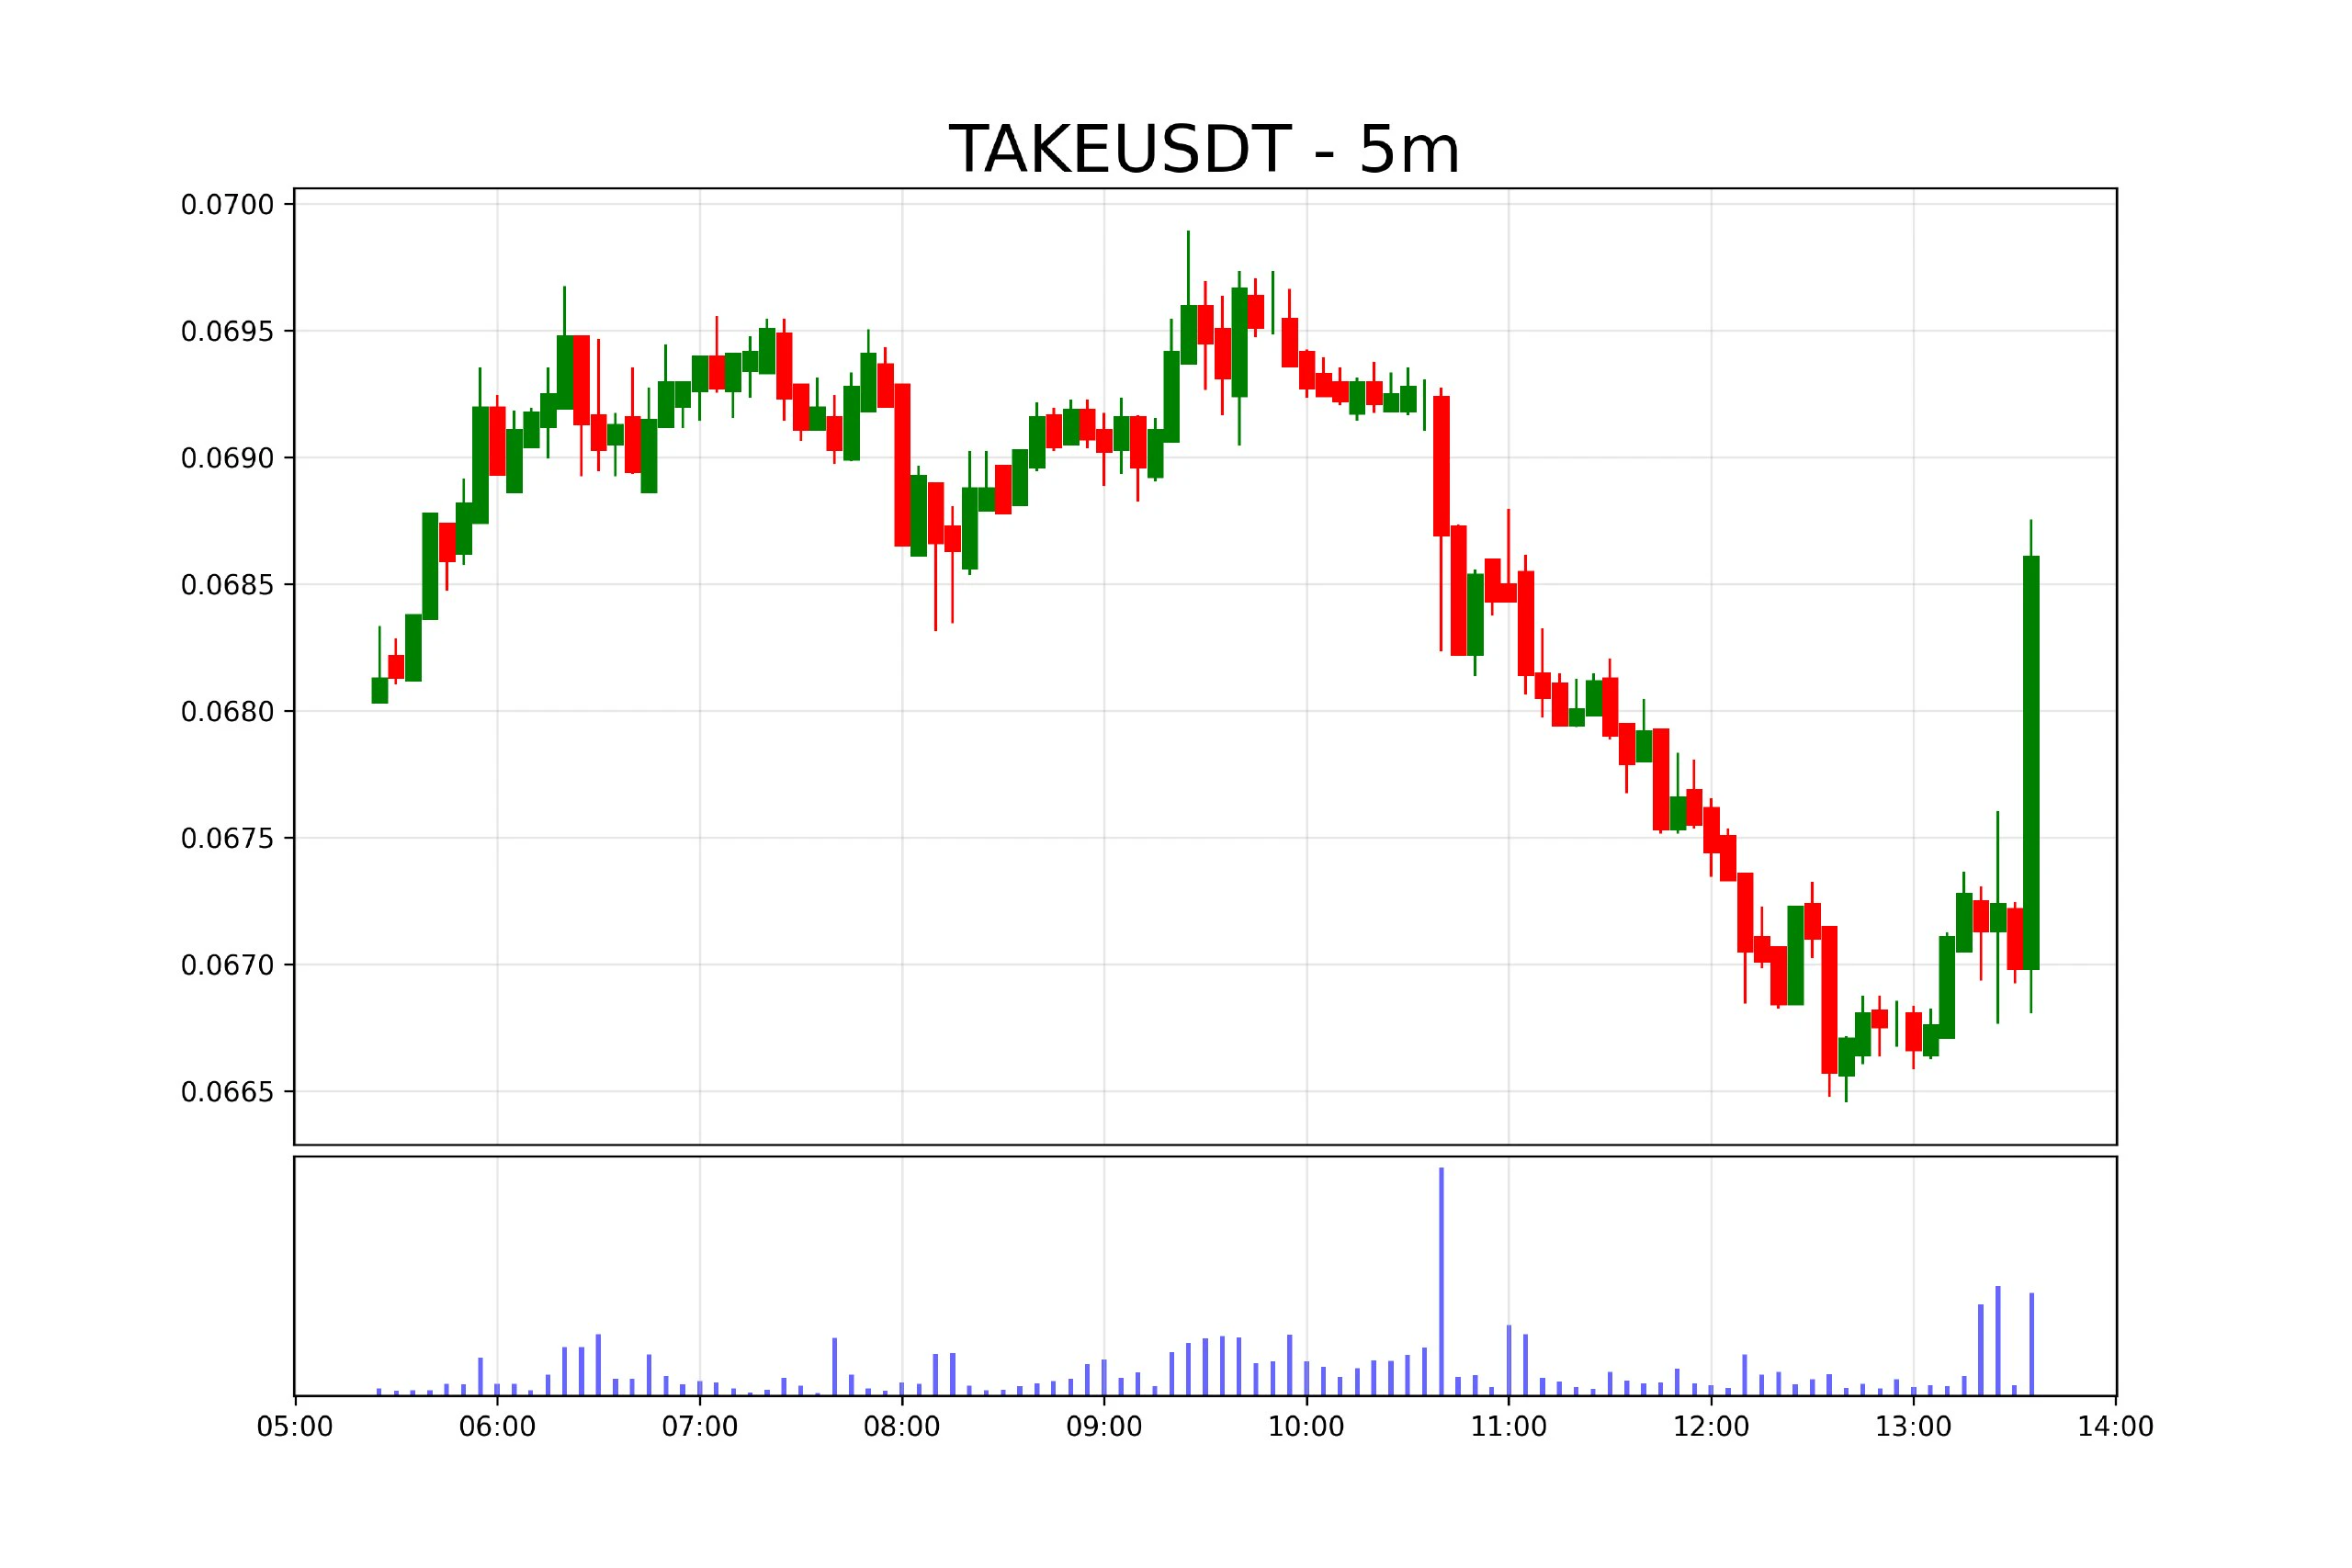
The bot is drawing a candlestick chart—what a beautiful arch. Now we just sit back and watch the show, and see whether the market maker paints the motherland’s mountains and rivers red, with the splendid landscape covered in fluttering maple leaves!
post-image
crypto market update
live-cover
LIVE2,145
ethereum:0x56a3ba04e95d34268a19b2a4474dc979babdaf76 long 🟢. I have high conviction for this one. More a swing trade.Eta Weekend. Scalable trade.
Stop: $0.0199
Target: $0.02755
7.2R planned · 10/10 checks
P. Acct risk: 10.00%
— DTT
post-image
ETH+0.71%
If you haven't seen the uncut version of this film, I highly recommend it.
post-image
According to Jin10 Futures on October 16, overnight crude oil prices remained volatile in a high range, while fuel oil costs improved amid steady demand from refineries for secondary raw materials. Processors showed reluctance to sell at lower prices, indicating firm market support for fuel oil
post-image
$ZK Up 40% in seven days, with open interest more than doubling as longs piled in and pushed prices higher. It surged to the 75th percentile of the seven-day upper range—the more people pile in, the more dangerous it gets. This kind of rally is a bull trap, with nothing but bagholders waiting above. The more longs push, the more precarious it becomes. Don’t wait for the waterfall to arrive before running—the shorts are closing in😤
post-image
ZK+6.84%
$HYPE HYPE: Bullish Structure Faces Another Important Test
HYPE has pulled back sharply from its September all-time high at $97.99, with the subsequent rally failing at $95.22. Price has retraced almost 50% of its August–September advance, weakening short-term momentum.
The 100/50-day EMAs remain bullishly crossed, suggesting the broader recovery has not broken down. However, price is below the 100-day EMA and trading between the two averages.
HYPE is approaching the significant $75–$77 support zone, which has attracted buyers several times over the last four months. The 50-day EMA and 0.5 Fib
post-image
HYPE+1.54%
$NOK
It still has a chance to form a double bottom consolidation in this zone 🤞
post-image
NOK+1.75%
$NEAR Current price: 5.305, up 8.84% in 24h, with a trading volume of 224.4M USDT; funding rate +0.0100%, with longs paying shorts, indicating that leveraged longs have become overcrowded. Technicals: MA5=5.3346 above MA20=4.94675, MACD histogram +0.05829 maintaining a bullish bias, but RSI=65.7 approaching the overbought zone, while the Bollinger upper band at 5.58677 presents short-term resistance. The 17.19% range over 30 candles shows frequent wick spikes. The Fear & Greed Index is 53, neutral with a warm bias, not yet at extreme greed, indicating that sentiment still has room to run. Over
post-image
MARSCOIN-5.77%
To be honest, people’s heads can be pretty hard sometimes. Even getting hit on the head by a white ball this hard doesn’t do anything.
By July, XRP holders had created nearly 24,000 Flare Smart Accounts, which let them use Flare DeFi with one XRP Ledger signature and no FLR. More than 40M XRP was earning through Xaman and D'CENT alone.
@FlareNetworks
XRP+0.38%
FLR-0.34%
Good morning, $DOGE family! ☕️
Gm C X 👊📉
Happy Friday! 🙌🌞
Dogecoin to the moon! 🐕🚀🌙
post-image
DOGE-0.84%
$EBAY
The bigger picture is actually a massive cup+handle. It also played out the cup+handle it formed between 2021-2026 🔥
post-image
EBAY+5.15%
Gold on 10/16:
On the daily chart, the price stabilized and rebounded from the low around 4066. It is currently trading between the lower and middle Bollinger Bands, consolidating and repairing at low levels, with resistance from the middle Bollinger Band above.
KDJ: K=53.57, D=48.02, J=64.66. The golden cross is expanding upward, and short-term rebound momentum is continuing, but the larger-cycle downward structure has not yet changed.

Trading strategy: low-level consolidation and repair, with a short-term bias toward a rebound. Focus on whether the price can effectively break above the mid
post-image
GLDX+1.02%
PAXG+0.15%
If you lost money in this token, you probably deserved it.
post-image
TOKEN+1.18%
$ADA A slight pullback is likely to be followed by a rise
Buy 0.2285–0.2255; targets 0.2310, 0.2335, 0.2360; stop loss 0.2210
post-image
ADA+0.01%
Layout: Bitcoin, Ethereum, Dogecoin
live-cover
LIVE880
  • 4
According to Jin10 Futures on October 16, overnight crude oil prices remained volatile in a high range, while fuel oil costs improved amid steady demand from refineries for secondary raw materials. Processors showed reluctance to sell at lower prices, indicating firm market support for fuel oil
post-image
$STBL Doubled in one day, surging from a 24h low of 0.0201 to a high of 0.0542, and now at 0.0432. With this kind of move, I only do one thing: wait for it to fall thoroughly, not chase the rally.
First, the plan. $STBL Currently at 0.0432, with a 24h range exceeding 160% and a trading volume of 18.8M, this is a typical hot-money trading market, not an area for value accumulation. I will place limit orders and wait for a pullback rather than chase it.
Entry plan: two levels. The first is around 0.0350, corresponding to a pullback of approximately 35% from the 24h high and serving as the first
STBL+60.25%
Load More

Join 40 M users in our growing community

⚡️ Join 40 M users in the crypto craze discussion

💬 Engage with your favorite top creators

👍 See what interests you

Trending Topics

USSeptemberPPIBeatsExpectations

91.35k Views1.89k Discussing

US September PPI came in at 6.3% YoY, well above the 5.3% market expectation, pointing to renewed producer-side inflation pressure. Weekly jobless claims were 199K, broadly in line with forecasts. Could hotter inflation further reduce room for rate cuts, and what does it mean for $BTC, US stocks, and gold?

DrLinHanSpeaksAtOxfordUnion

135.63k Views1.86k Discussing

JapanAndKoreaStocksPlunge

47.27k Views1.76k Discussing

View More