
Square
Following
Hot
News
Notifications
Profile
Share your thoughts
placeholder
Article
$IDOL recorded a $5.14K short liquidation around $0.03178, suggesting buyers are starting to pressure short positions. If price maintains its demand zone, another push higher could target liquidity resting above recent swing highs. Watch for a clean breakout supported by volume.
Support: $0.0305 – $0.0295
Resistance: $0.0325 – $0.0340
Next Target: $0.0360
Confirmation: Holding above $0.0325 could strengthen bullish momentum and open the door to a short squeeze.
Let's go $IDOL 🚀
post-image
IDOL-6.71%
Taking it easy and watching the market this weekend
Last week’s pace was great, and today I’m adjusting ake and ain while continuing to hold long positions. Waiting for an opportunity in Ethereum
post-image
AKE+6.39%
AIN+3.35%
ETH-1.26%
  • 2
Trenches
ZIG
Z
bade
b
ZIG
0x8c...1145
Market Cap
$.
Change
.
24h Vol
$.
Holders
.
STONK
S
bade
b
STONK
6GmA...UNgx
Market Cap
$.
Change
.
24h Vol
$.
Holders
.
IDOL
I
bade
b
IDOL
0x3b...ab07
Market Cap
$.
Change
.
24h Vol
$.
Holders
.
MAGGIE
M
bade
b
MAGGIE
8rHo...PmZV
Market Cap
$.
Change
.
24h Vol
$.
Holders
.
FLOAT
F
bade
b
FLOAT
Bv1a...BMmr
Market Cap
$.
Change
.
24h Vol
$.
Holders
.
new stimers
live-cover
LIVE2,156
I came to the seaside to take in the beauty, yet my eyes remained fixed on the beautiful person I hold so dear! ❤️🌊
Is BTC suitable for dollar-cost averaging? Use time to create a more measured investment pace!

In the cryptocurrency market, many people hope to buy at the lowest point and sell at the highest. But in reality, even experienced investors find it difficult to accurately predict every market turn. Some make a lump-sum purchase only to face a sharp drawdown, while others keep waiting for lower prices and ultimately miss a long-term rally.

So, is BTC suitable for dollar-cost averaging?

First, it makes market timing less difficult. The biggest advantage of dollar-cost averaging is investing in in
post-image
BTC-0.67%
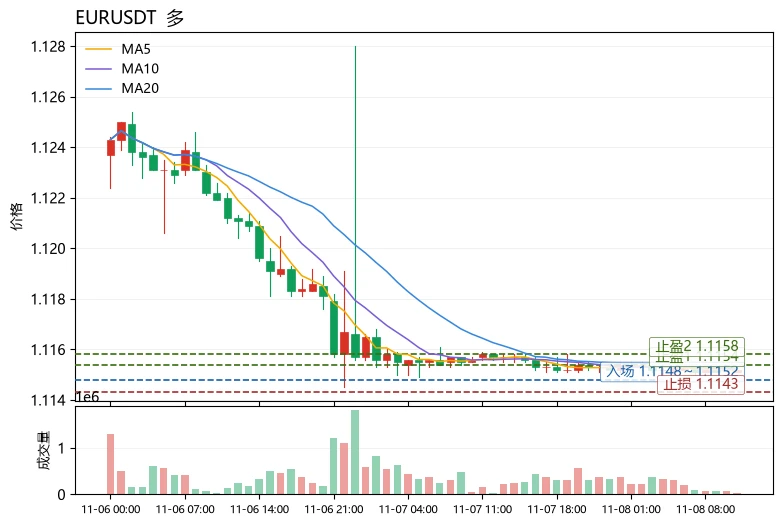
$EUR Current price 1.1152, 24h -0.04%. The range across 30 candlesticks is only about 0.1%, with volatility extremely compressed. On the moving-average front, MA5=1.11516 is slightly below MA20=1.11526; the short- and medium-term moving averages are converging and flat, with no clear direction. RSI=37.6 is in the weak zone but not oversold. The MACD histogram=+0.0001182 remains slightly bullish, but momentum is insufficient. The Bollinger Bands [1.11508,1.11544] are extremely narrow, and the price is trading near the lower band. The Fear & Greed Index is 28, indicating fearful market sentiment
post-image
eur
eureur
Gate.Fun
MC:$5.55KHolders:3
0.06%
LTC-0.07%
UNI+3.05%
Crypto Market Updates
live-cover
LIVE989
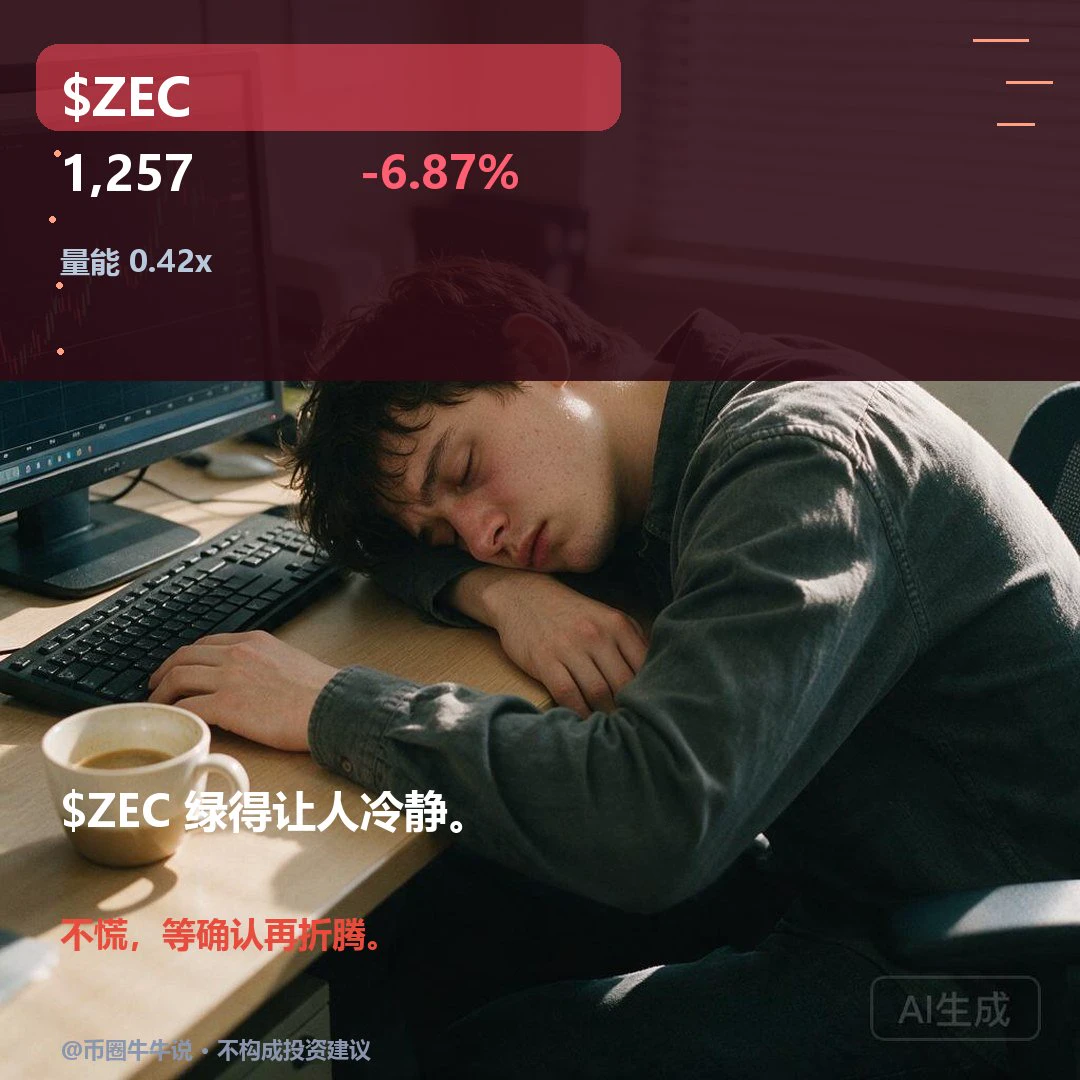
$ZEC Current price: 1257.38, 24H -6.87% (1235.00–1350.19). 1H is weak: RSI 40.10, EMA20 1270.54, support 1235.00/resistance 1334.33; 4H is weak: RSI 51.71, EMA20 1281.78, support 1183.38/resistance 1387.89. A move higher only matters if price reclaims and holds above the 1334.33 resistance; a break below the 1235.00 support would signal further weakness. Review whether price holds above 1334.33 and recovers after losing 1235.00; volume is only 0.42x. Without volume or a recovery, the setup is invalidated. The market is volatile; for observation only.
post-image
ZEC+1.16%
How can you quickly reset your trading mindset after consecutive losses in BTC?
In BTC contract trading, consecutive losses are a phase many traders go through. The real danger is not the losses themselves, but the chain reaction that follows: rushing to break even, opening positions too frequently, continually increasing leverage, or even starting to violate your original trading plan. In the end, an ordinary loss can escalate into a greater risk to your account.
So, how should you reset after consecutive losses?
First, stop impulsive trading. If you’ve had several losing trades in a row, don
post-image
BTC-0.65%
Is Goldman Sachs Not Afraid of an AI Selloff? $125 Billion Construction Plan Revealed—Is the AI Bull Market Not Over Yet?

As AI tech stocks plunge across the board, many investors have begun questioning everything, but Goldman Sachs is moving in the opposite direction, continuing to raise its forecast for U.S. data center construction spending and expecting it to reach $125 billion in 2028.
What does that mean? While the stock market is still debating whether AI is a bubble, the data center industry is already discussing where to build the next batch of facilities!
The main reason Goldman Sac
GS-0.30%
#GateLaunchesPoSECProofOfSecurity

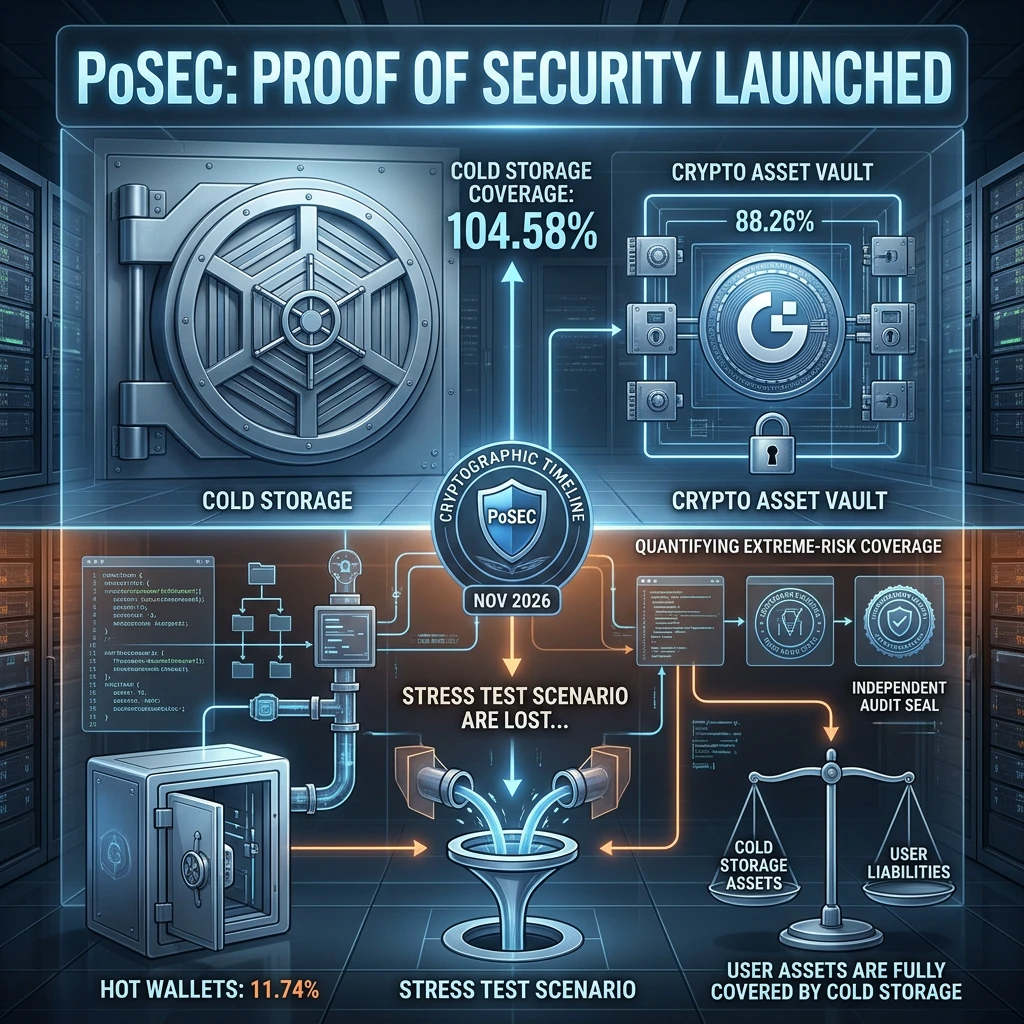
Gate Launches PoSEC: A New Standard for Measuring Crypto Exchange Security

Imagine an exchange suddenly loses access to every asset held in its online wallets. Would the funds stored offline be enough to cover all customer balances? This is an important question that traditional reserve reports do not fully answer.

Gate has introduced a new framework called Proof of Security (PoSEC), designed to bring greater transparency to how exchange assets are stored and how well they can withstand extreme security incidents. The launch adds another important dimensio
post-image
GT-2.41%
$CLAUDIA One quote tweet pushed it back to a 7 million market cap, $JOSE and riding the same person's meme sent it soaring to 1.8 million. That's the entire logic of meme coins: money goes wherever the attention is. Don't ask why. Before the halving, while the market is trading sideways, we'll see even more of this kind of thing. Decide for yourself whether to follow along. What do you think? $BTC If you're watching, follow along.
post-image
MEME-0.94%
BTC-0.67%
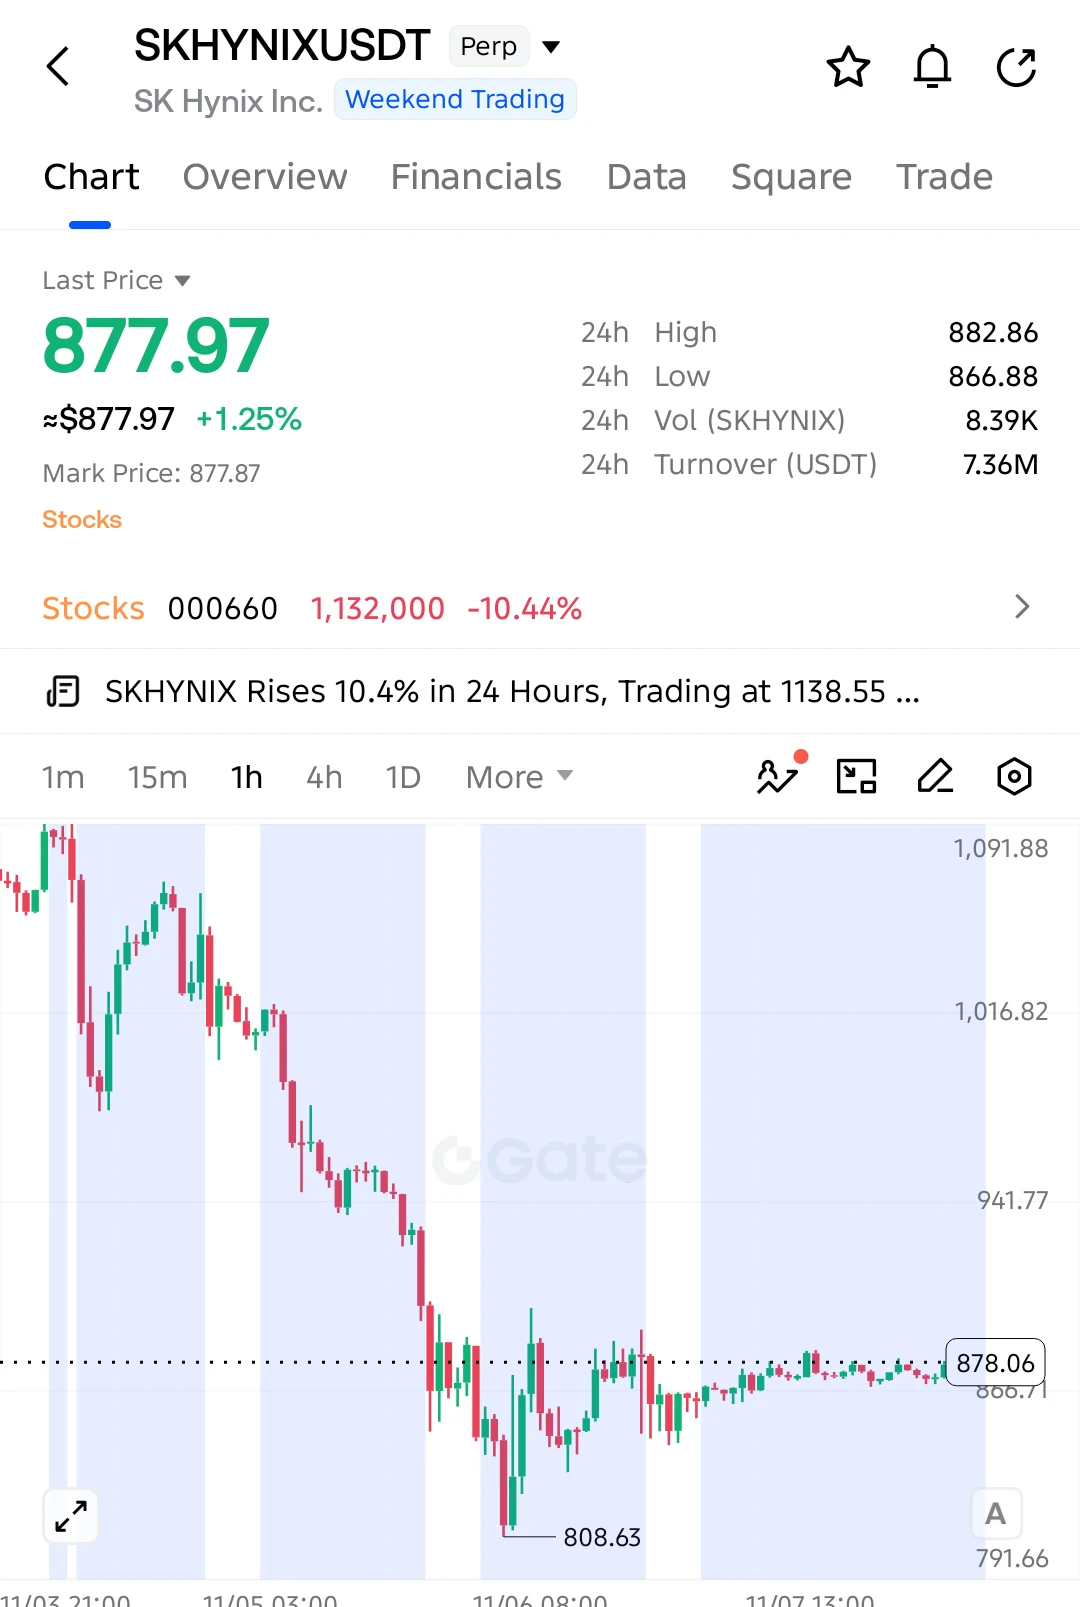
$SKHYNIX LONG SETUP — BIG RECOVERY AHEAD?

$SKHYNIX is showing signs of stabilization after a massive sell-off. Buyers are defending the 866 support area, with a potential recovery developing!

Entry: 877.97
SL: 865.00

TP1: 892.50
TP2: 905.00
TP3: 920.00
Final Target: 938.86

Selling pressure has eased as price consolidates near 878. Buyers are gradually rebuilding strength, and a breakout above 882.86 could open the door toward 905 and higher.

Invalidation: A sustained break below 865.00 weakens the bullish setup.

Keep your eyes on $SKHYNIX!
post-image
SKHYNIX+1.41%
Couldn't sleep this morning, so I bought 5000u worth of $koma to play with
post-image
KOMA-3.91%
How to Identify a False Breakout and Avoid Getting Trapped in a Bull Trap!
One of the market moves most likely to fool traders in BTC trading is a false breakout. When the price suddenly breaks through an important resistance level, many people see the candlesticks rise sharply and assume a new rally has begun, rushing to go long. However, the price soon falls back into its previous range, leaving those who bought at the top at a disadvantage.
So, how can you identify a false breakout?
First, check whether trading volume confirms it. A strong breakout usually needs volume support. If the price
post-image
#StakeOnLaunchpoolToShare450KVLX Stake on Launchpool to Share 450K VLX

The latest Launchpool opportunity is attracting attention from the crypto community, with a total reward pool of 450,000 VLX available for eligible participants. This campaign gives users an opportunity to participate in a token distribution event while learning more about the project and its ecosystem. Launchpool campaigns have become an important part of the cryptocurrency market because they connect new projects with users and give communities a chance to participate in early ecosystem growth.

The idea behind Stake on
VLX+0.00%
🔥 $ZEC /USDT – Bears Are Losing Control or Is This Just a Trap?

I'm watching $ZEC closely because the 15-minute chart is showing an important battle around the $1,250–$1,265 zone.

After getting rejected from the $1,387 high, ZEC has experienced a clear downside move, forming lower highs and lower lows. However, buyers are now attempting to defend the $1,247 support area. A successful recovery could trigger a short-term bullish reaction, but confirmation is still needed.

🎯 Entry Level: $1,255 – $1,267

🥇 TP1: $1,280

🥈 TP2: $1,300

🥉 TP3: $1,325

🛑 STOP LOSS: $1,242

⚡ Key Level to Wat
ZEC+1.16%
$UAI ‌
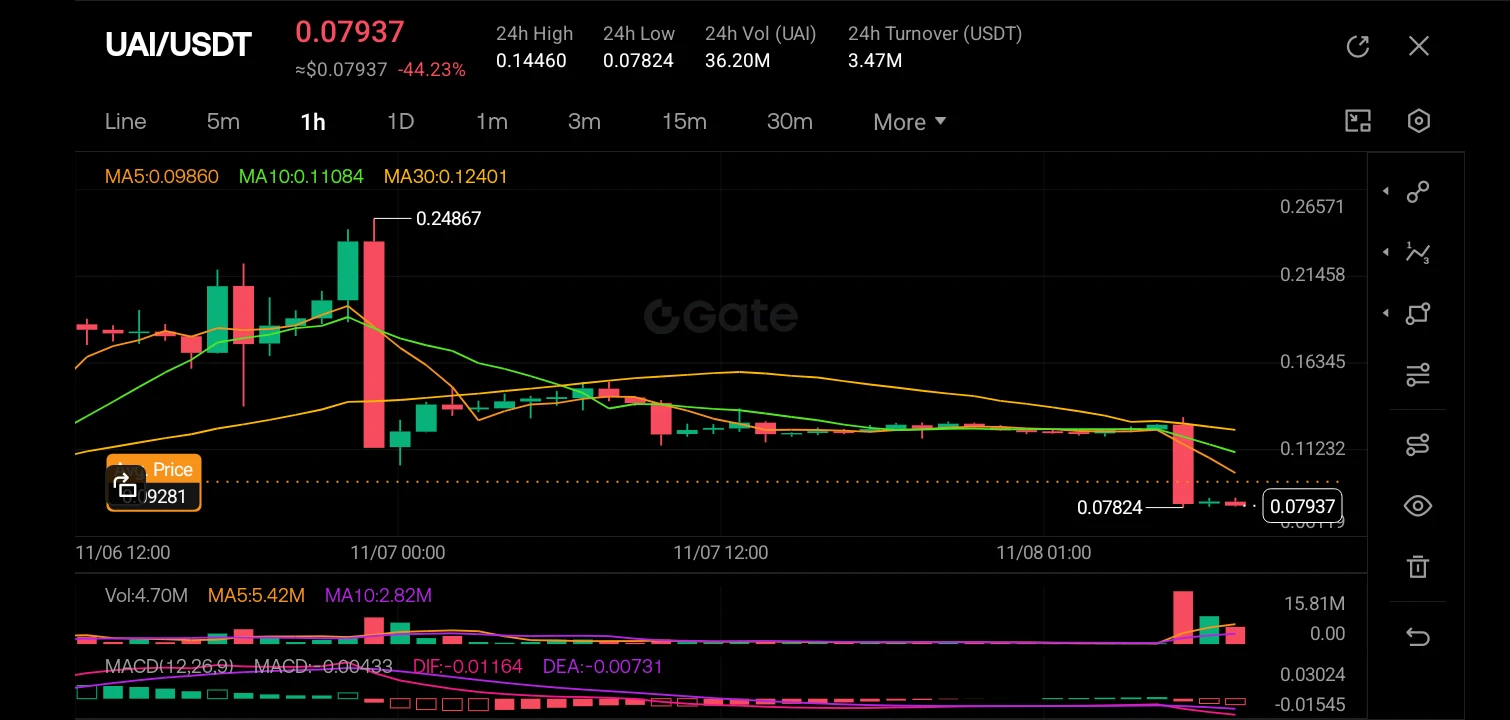
The 1-hour chart for UAI/USDT is showing a severe bearish breakdown, with the price currently sitting at 0.07937, representing a massive 44.23% drop over the 24-hour period. The chart clearly displays a steep waterfall decline from the recent high of 0.24867, completely obliterating the short and medium-term moving averages (MA5, MA10, MA30), which are now fanning out downwards in a classic bearish alignment. The most recent candle is a massive, long-bodied red marubozu that has crashed through any nearby support levels, accompanied by a significant volume spike (15.81M), indicating in
post-image
UAI-7.58%
  • 3
Goldman Sachs, however, is betting $125 billion! Who on Wall Street is really playing dumb this time?

AI stocks just plunged, and talk of a bubble bursting is heating up again. Some say AI has been overhyped; others say tech stock valuations need a reset.
But just as everyone is busy looking for the next stock to avoid, Goldman Sachs has offered a thought-provoking forecast: U.S. data center construction spending is expected to reach $125 billion by 2028.
On one side, stocks are falling; on the other, infrastructure investment keeps growing. It’s a bit like a restaurant with fewer customers w
GS-0.30%
Load More

Join 40 M users in our growing community

⚡️ Join 40 M users in the crypto craze discussion

💬 Engage with your favorite top creators

👍 See what interests you

Trending Topics

USCPIDataIncoming

1.88k Views1.49k Discussing

The U.S. October CPI report will be released on November 10 at 8:30 a.m. ET. September CPI came in at 3.7% year over year, and markets will be watching closely for signs that inflation is cooling, especially in core CPI. A softer-than-expected reading could strengthen rate-cut expectations, while hotter inflation may pressure risk assets through higher Treasury yields and a stronger dollar. How do you think this CPI print will move $BTC, U.S. stocks and gold?

USAIStocksHitHard

24.01k Views3.7k Discussing

USNonfarmPayrolls

41.49k Views4.4k Discussing

View More