Square
Following
Hot
News
Notifications
Profile
Share your thoughts
placeholder
Article
A coin down 20% with over 200 million in trading volume is more worth watching than the drop itself. $MUU is now at 9.80, down from 12.68 over the past 24 hours, after hitting a low of 9.33, with 227.9M in trading volume. A high-volume decline means people are actively trading—not that nobody cares anymore.
I'm not watching this red candle, but the ripple effects behind it. When big money moves, it often doesn't move the coin price first, but the liquid assets around it. When liquidity tightens there, money flows back first, draining high-volatility assets. $MUU is on the receiving end of th
  • 1
On the Nature of Marriage
After reading this, do you still want to get married?
Trenches
FIONA
F
bade
b
FIONA
B34n...pump
Market Cap
$.
Change
.
24h Vol
$.
Holders
.
PIEVERSE
P
bade
b
PIEVERSE
0x0e...25a9
Market Cap
$.
Change
.
24h Vol
$.
Holders
.
mihao
m
bade
b
mihao
4Cxj...pump
Market Cap
$.
Change
.
24h Vol
$.
Holders
.
CLAUDIA
C
bade
b
CLAUDIA
2j5S...W2ZM
Market Cap
$.
Change
.
24h Vol
$.
Holders
.
IDOL
I
bade
b
IDOL
0x3b...ab07
Market Cap
$.
Change
.
24h Vol
$.
Holders
.
🩸 Stocks are CRASHING.
🩸 Crypto is CRASHING.
🩸 Gold is CRASHING.
🩸 Silver is CRASHING.
🩸 Copper is CRASHING.
🩸 Oil is CRASHING.

when was the LAST time everything fell together, and what happened NEXT? Is a BIGGER CRASH coming?

#ShareWeekly
#BTCBreaksBelow60K

$BTC ‌$ETH ‌$XRP ‌
BTC-0.67%
ETH-1.26%
XRP-1.12%
Just after 5 p.m. on Saturday, the market wasted no time in tumbling. BTC fell below the $60,000 mark and continued searching for a bottom, while ETH plunged in tandem. Market sentiment clearly turned to fear, and capital is accelerating its exit.
There has been no letup in macro pressure, and risk appetite continues to decline. Total market capitalization briefly fell below the $2 trillion mark. Institutional funds remain on the sidelines, and ETF outflow pressure has yet to fully ease.
$BT : $57,600–$58,000, down 6%–7%. The long-short ratio favors bears, and selling pressure is clear. $59,00
post-image
ETH-1.26%
SOL-0.77%
Long $IDOL price has broken above the consolidation range (BOS), is above all EMAs, and remains in an uptrend. Prioritize going long when price pulls back to the support area. Entry 1: 0.02320 – 0.02380 Entry 2: 0.02240 – 0.02320 Entry 3: 0.02170 – 0.02240 Take profit 1: 0.02688 Take profit 2: 0.02913 Take profit 3: 0.03098 Stop loss: 0.02145 Note: This is a reference plan based on the chart provided. If the price breaks below the 0.02145 support level, Entry 3 may become invalid; all three orders should not be opened simultaneously without managing the total risk.
post-image
IDOL-6.71%
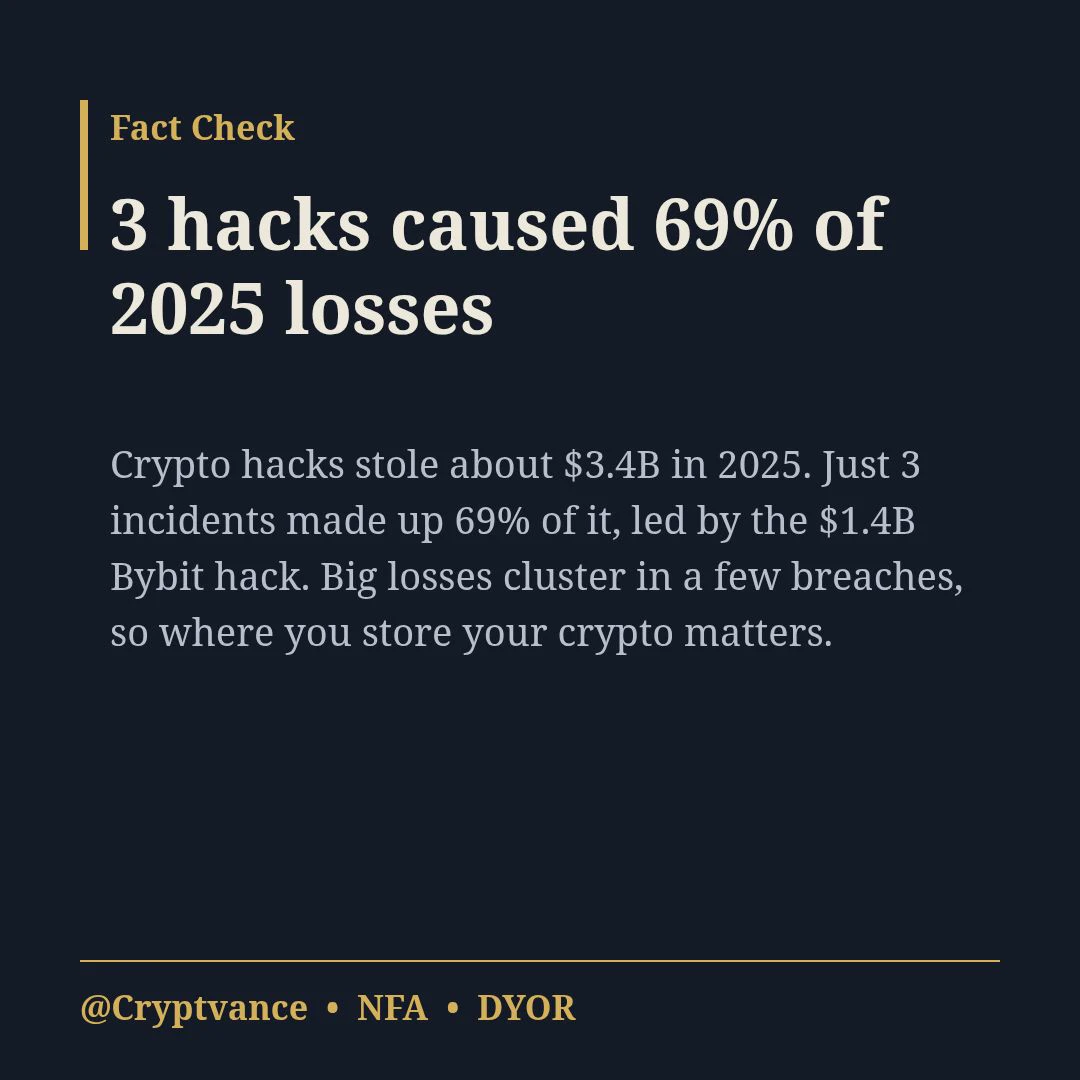
3 hacks caused 69% of crypto losses in 2025.
#Crypto #CryptoSecurity
post-image
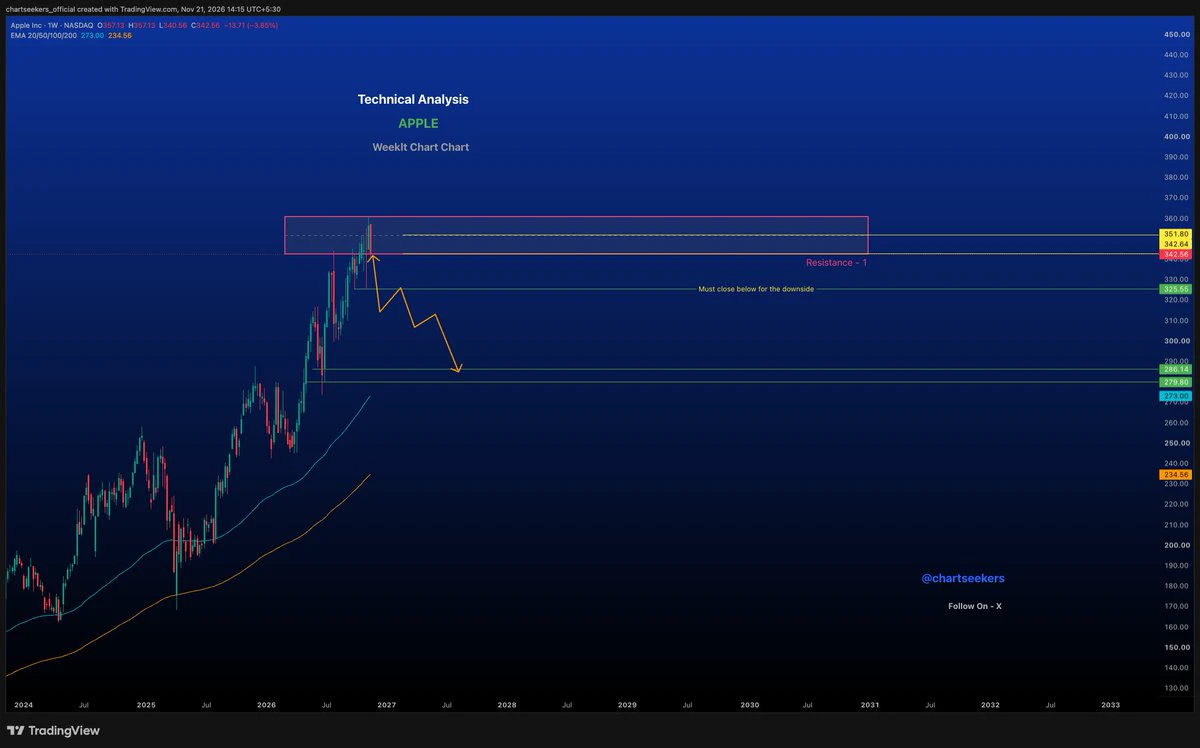
$AAPL 🍎
Time to take a bite out of Apple profits! 📉
A healthy correction may be brewing. Sometimes, booking profits is the healthiest decision in the market.
Let’s see how the structure unfolds.
post-image
AAPL-1.83%
EVAA | Long 🟢 | Bullish | 15m | 24-hour change: +21.09% | Volume: 451.7M USDT. Long rationale: Price is above EMA200; EMA20/50/200 are in bullish alignment; RSI14 is 69.0; MACD histogram is positive; ADX14 is 19.9; volume is 1.21 times the 20-candle average; breakout from the 20-candle range. Entry price: 6.5932. Stop-loss: 5.93801. Take-profit 1: 7.41218 | Take-profit 2: 7.90357 | Take-profit 3: 8.55876. Entry price is for reference only; do not chase the rally. The strategy is invalidated if the stop-loss level is hit. Technical analysis only; this is not investment advice. $EVAA
post-image
EVAA-0.49%
#weeklyshare
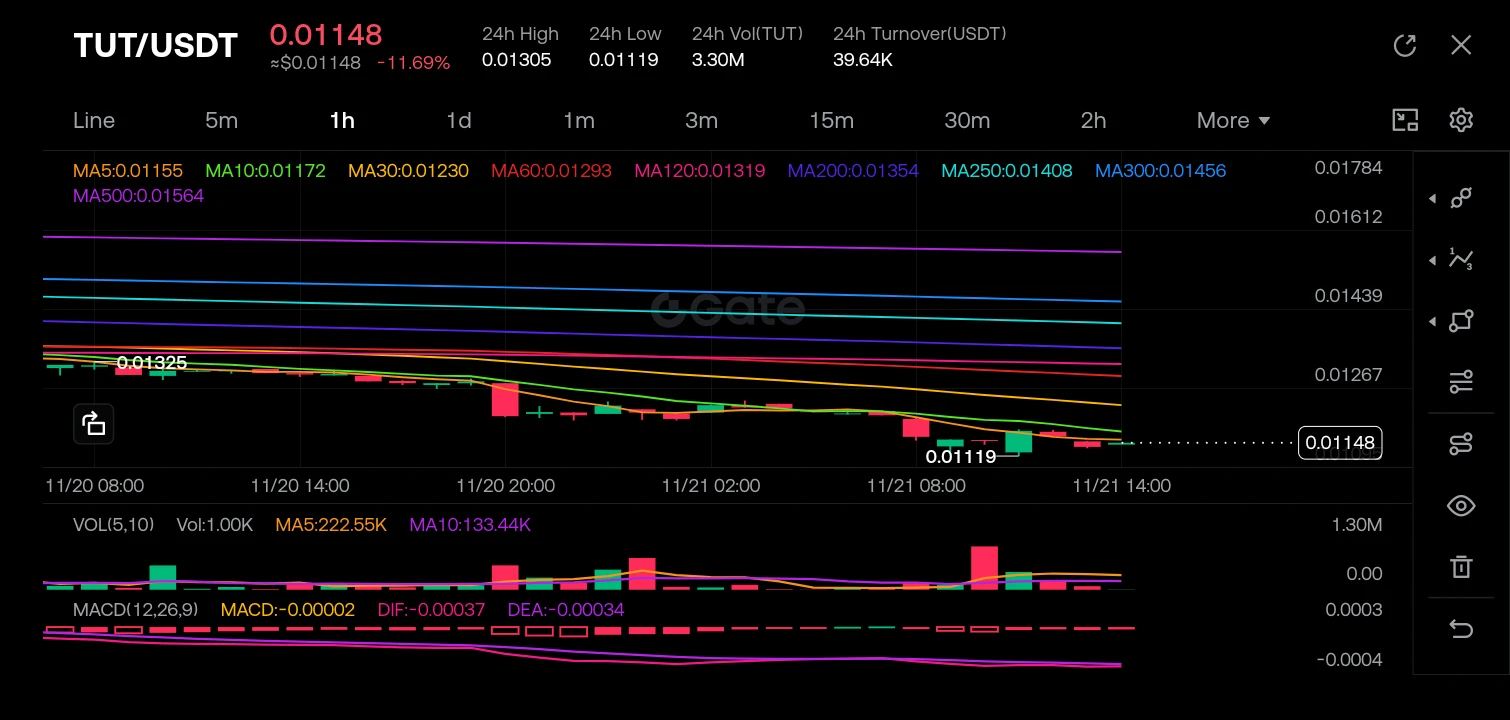
$TUT ‌

The Liquidity Trap: Decoding the TUT/USDT Downtrend from Macro Distribution to Micro Capitulation.

In the realm of cryptocurrency trading, price is merely the shadow of liquidity. We do not trade the red and green candles; we trade the flow of capital and the emotional extremes of the crowd. The TUT/USDT chart currently presents a textbook example of a bearish structural breakdown. By aligning the macro flow of whale distribution with the micro flow of liquidation cascades, we can identify why the market is overextended and where the next high-probability entry lies.

E
post-image
TUT-2.02%
  • 1
$KOR Those who were too slow to sell will regret it, mlb
post-image
  • 3
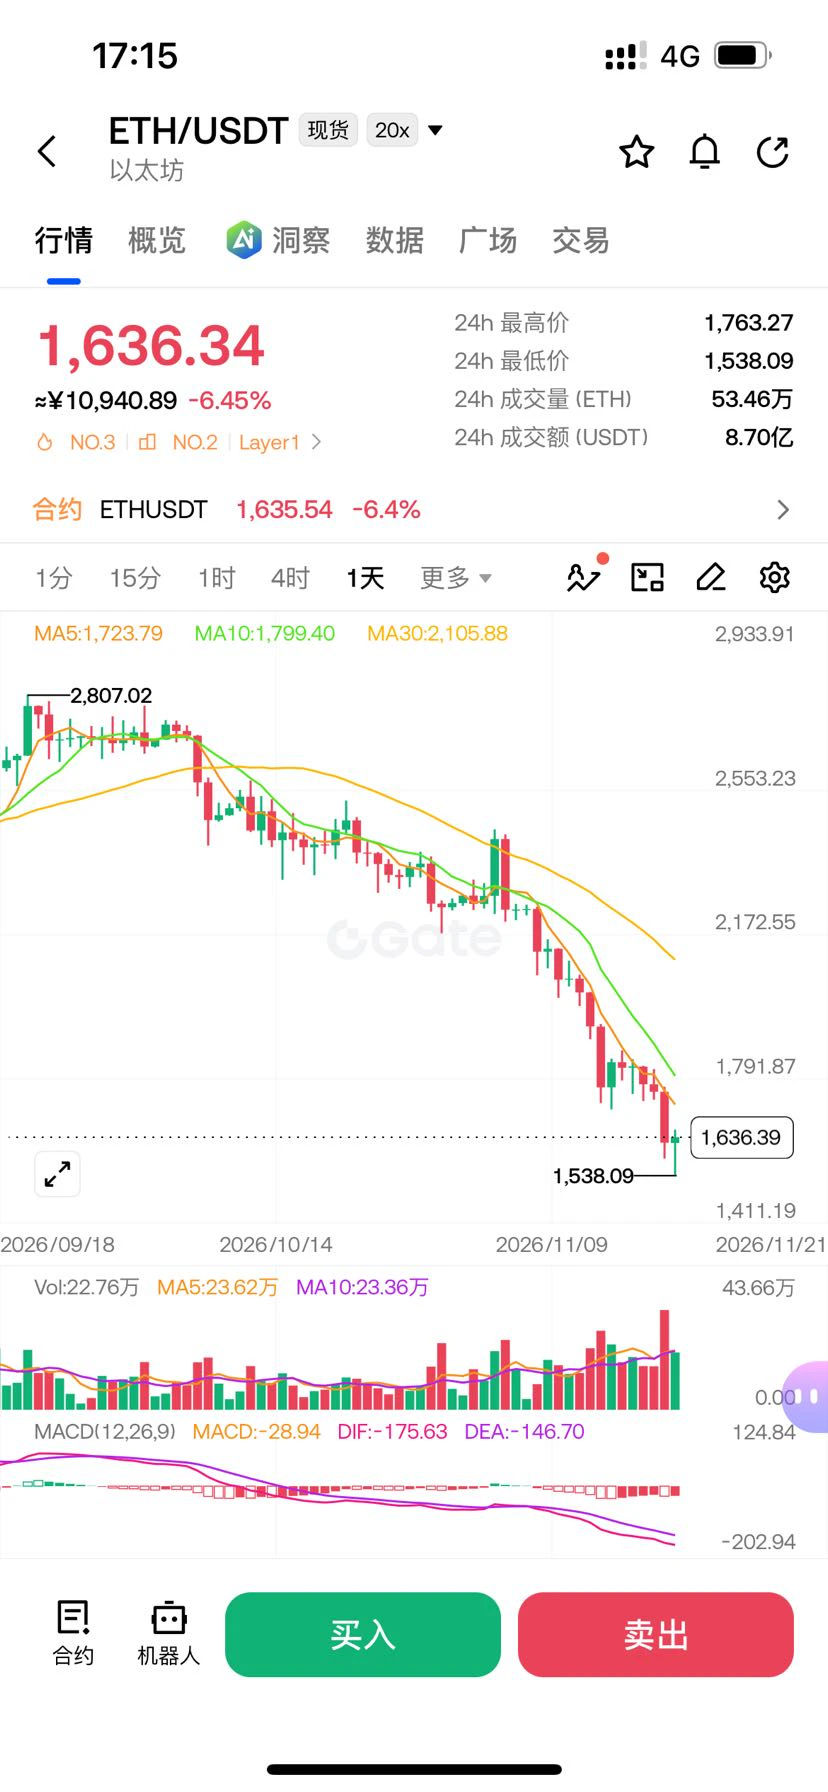
At noon, I was watching that line on $ETH , talking about volume doubling and people selling into the rebound. Looking again now, from a different angle—not the market, but the people.

The feed is full of stories like these: turning tens of thousands in starting capital into millions, shorting from 80,000 without missing a step, riding the entire trend from start to finish. It makes my teeth itch. Do they really think they’re the chosen ones? The ones posting are the survivors; the 50,000 who blew up don’t post. You’ll never see them.

The price is now 1,634, down more than 30% from 30 days a
post-image
ETH-1.26%
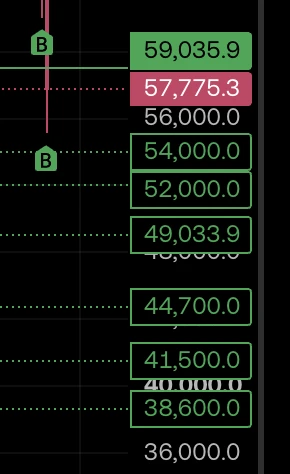
Just opened some more limit orders for the remaining 2026 Bitcoin bear market. Average cost basis is now $59k, I hope I get more opportunities for the long term.
post-image
BTC-0.67%
  • 1
NEAR market prediction update
live-cover
LIVE1,778
BTC-0.67%
ETH-1.26%
CRYPTO MARKET UPDATE
live-cover
LIVE1,719
BTC-0.67%
#GoldNears3500 #ShareWeekly
Gold stands at a pivotal psychological and technical juncture near the $3,500 per ounce level as of late November 2026, with the spot price hovering in the $3,530 to $3,540 range after a sharp multi-week decline. This area has become the focal point of intense market discussion, as the metal has already shed roughly 8.9 percent over the past week and approximately 12 percent over the past month, while sitting nearly 19 percent lower year-to-date and more than 34 percent below its all-time closing high near $5,405 recorded in late January 2026. The question dominati
  • 2
Jensen Huang’s unassuming appearance can’t hide just how lavishly he actually lives.
I never expected it to be like this. I really was fooled by appearances before.
  • 2
  • 1
JCT is rallying strongly, with bulls fully in control—let’s ride the momentum toward new highs! Test a long on $JCT . Execution: Entry 0.00164 - 0.00165; take profit 0.001724 | 0.001787; stop loss 0.001591. Note: RSI on both the 1-hour and 15-minute timeframes is overextended, which could trigger a sharp mean reversion. Don’t go all-in, guys. Position size should suit your own account.
post-image
JCT-3.26%
  • 1
Load More

Join 40 M users in our growing community

⚡️ Join 40 M users in the crypto craze discussion

💬 Engage with your favorite top creators

👍 See what interests you

Trending Topics

BTCBreaksBelow60K

2.1M Views29.4K Discussing

BTC fell below $60,000 on November 20 for the first time since July, alongside a tech stock selloff and broader pressure on risk assets. Will $60K become resistance, or can BTC quickly reclaim it? What price or volume signals would convince you that selling pressure is easing?

GateDirectIPOPhase3ANTAllocates92100Shares

750.8K Views4.8K Discussing

NvidiaDropsNearly14Percent

315.2K Views7.5K Discussing

View More