Square
Following
Hot
News
Notifications
Profile
Share your thoughts
placeholder
Article
📡 Signal card · reposting without taking sides
Source: Shu Qin live trading (captured by BTCSOS) Asset: $BTC Short entry: 83900 Stop-loss: 85000 Targets: 82900 / 81900 / 80800 Time: not specified
I only repost this as-is; judge its authenticity and quality for yourself. Whether to follow and how large a position to take are entirely your decision. Don’t get carried away, and don’t go all in on a single trade. 😅
Shared for personal record-keeping; not investment advice. #US 10-year Treasury yield falls to 4.845%
BTC-0.65%
☀️ GM! Markets hit the brakes. What's the next signal? 🚦
Nasdaq fell 5.52%, BTC traded near $76K, and the US jobs report drops at 8:30 AM ET.

📌 Today's topic: What's your game plan before NFP?
🔴 Red: More downside ahead?
🟡 Yellow: Wait for the jobs data?
🟢 Green: Looking for opportunities?

🎁 Share your outlook on Gate Square. Post to claim a red packet, with bigger rewards dropping at random.
👇 Share your take: https://www.gate.com/post
post-image
NDAQ-2.63%
BTC-0.67%
  • 13
  • 5
Trenches
ZIG
Z
bade
b
ZIG
0x8c...1145
Market Cap
$.
Change
.
24h Vol
$.
Holders
.
BTC
B
bade
b
BTC
C5xp...pump
Market Cap
$.
Change
.
24h Vol
$.
Holders
.
CORLA
C
bade
b
CORLA
0xba...7777
Market Cap
$.
Change
.
24h Vol
$.
Holders
.
STONK
S
bade
b
STONK
6GmA...UNgx
Market Cap
$.
Change
.
24h Vol
$.
Holders
.
DESSA
D
bade
b
DESSA
npz2...pump
Market Cap
$.
Change
.
24h Vol
$.
Holders
.
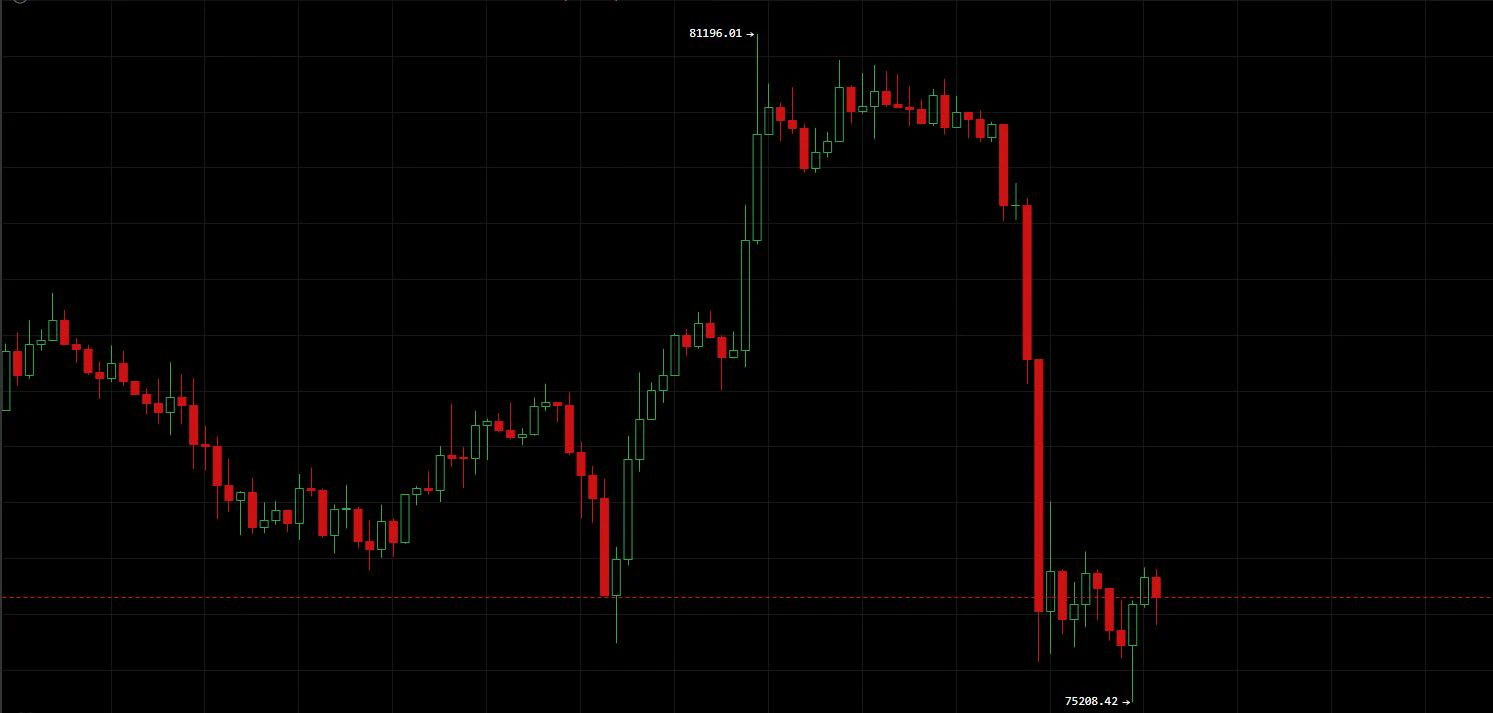
November 6 $BTC The U.S. election outcome triggered a “buy the rumor, sell the fact” move, as concentrated profit-taking from the earlier rebound sparked a futures liquidation cascade.
【Today's Strategy】
Short entry range: Position on a rebound to 76800-77300
Long entry range: Position after a stable retest of 75500-75700
Stop-loss settings: Short stop-loss above 77600; long stop-loss below 75100
Take-profit settings:
Short targets: 76200-75800
Long targets: 76800-77000
【Core Logic】
The hourly chart saw a sharp, one-way drop on heavy volume, with bears dominating the short-term market. 76800-
post-image
BTC-0.65%
GTA VI launches in 2026; the U.S. stock market AI bubble bursts
post-image
The shift from green to red numbers on stock market screens is not the real news; the true story lies in the fundamental mental shift behind that red.

What unfolded in the U.S. markets on Thursday was not merely an ordinary sell-off, but a profound rupture in how the "artificial intelligence trade" is valued and how its risks are perceived. As the Nasdaq closed the day down 5.5%, the semiconductor index suffered its worst performance since 2020, plunging as much as 12% in a single session. Nvidia fell 9%, AMD and Micron dropped 17% each, and Qualcomm slid 12%—altogether, approximately $2.5 tr
US30-0.26%
NAS100+1.43%
AMD-17.64%
MU-17.23%
NVDA-9.33%
  • 13
  • 6
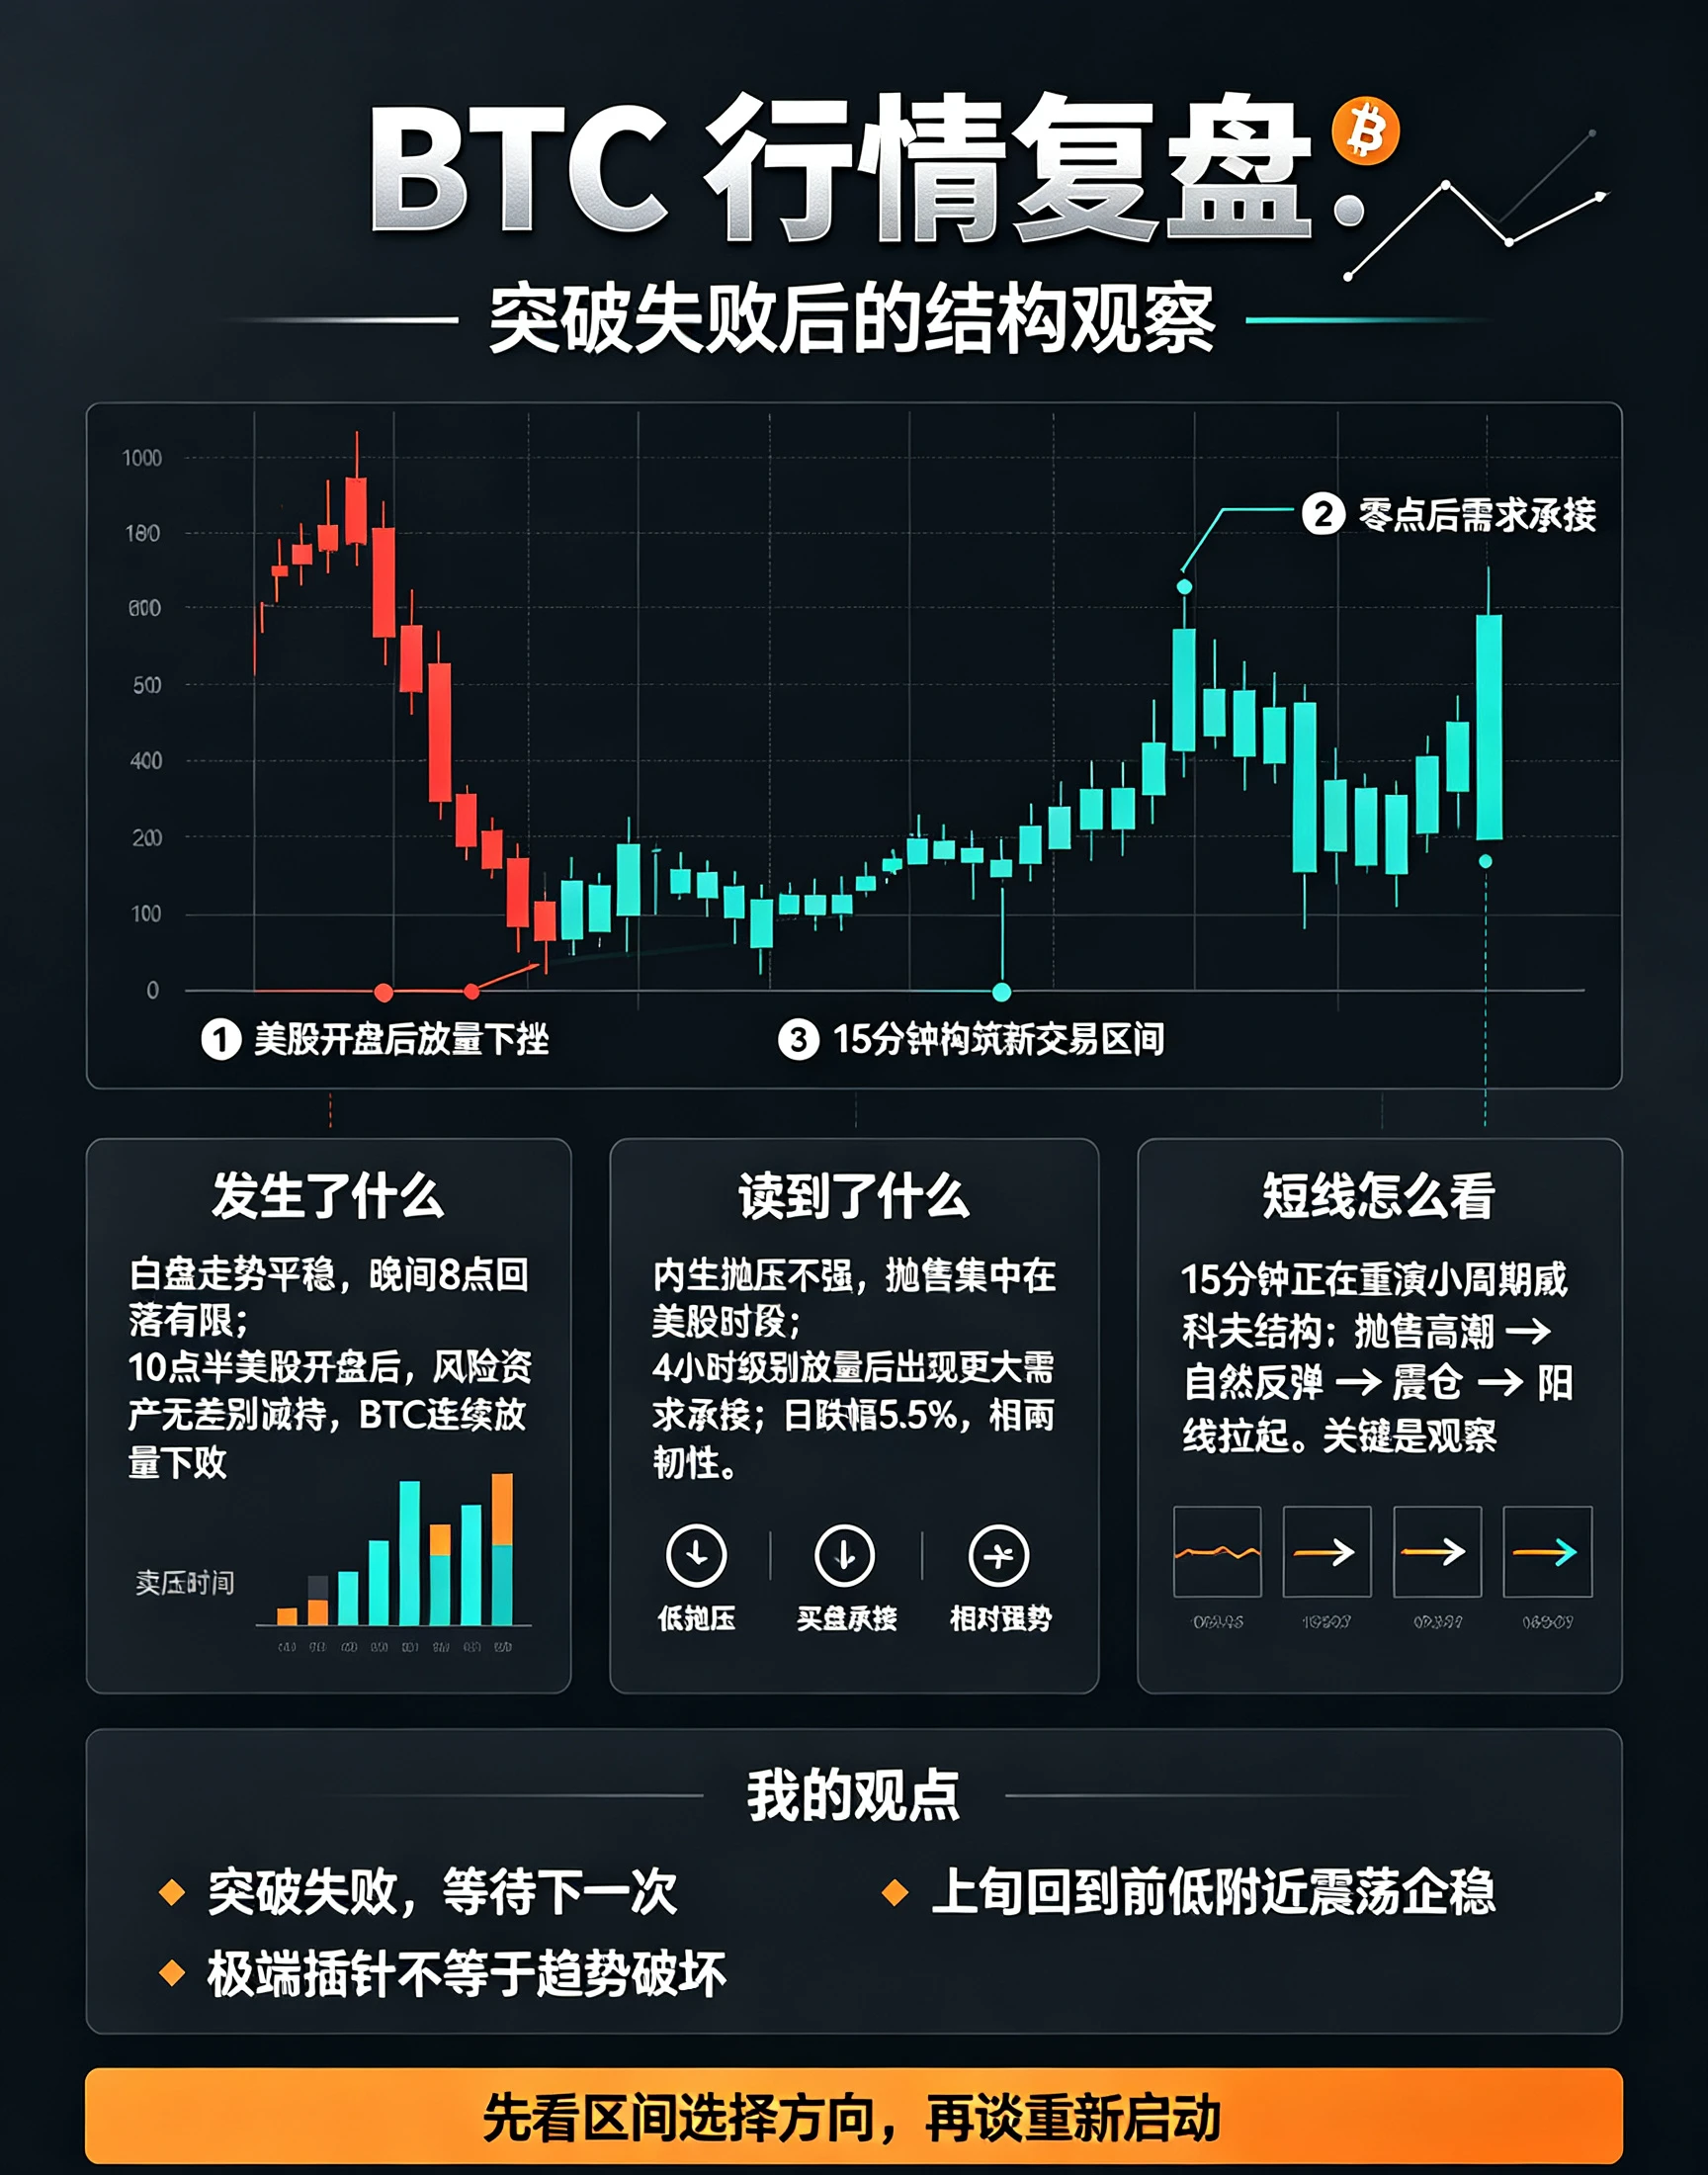
BTC traded steadily during the day yesterday, then saw a sharp pullback at 8 pm, though volume was limited. It was not until U.S. stocks opened at 10:30 pm that the market turned sharply lower, with successive high-volume declines and a concentrated wave of selling. The price fell through the two support levels previously anticipated, one after the other, signaling the failure of this breakout attempt.
The decline also sent several clear signals. First, endogenous selling pressure within crypto was not significant: the market was largely unaffected during non-U.S. trading hours, with selling c
post-image
BTC-0.65%
How can you quickly reset your trading mindset after consecutive BTC losses?

In BTC futures trading, consecutive losses are a phase many traders experience. The real danger is not the losses themselves, but the chain reaction that follows: rushing to recoup losses, opening positions frequently, continually increasing leverage, and even starting to go against the original trading plan. In the end, an ordinary loss can turn into a greater risk to the account.

So how should you adjust after consecutive losses?

First, stop impulsive trading. If you lose on several consecutive trades, don't rush
post-image
BTC-0.65%
Gate Live’s daily Red Packet Rain is here! Have you grabbed yours today?
🎙 Catch the latest market moves with pro streamers watching the charts live. Join the conversation, hop on mic, and talk trends & trading opportunities together~

Look for livestreams with the 🧧 icon on the cover, jump in, and grab your red packets!
⚡ Get your fingers ready: https://www.gate.com/live
post-image
  • 4
  • 2
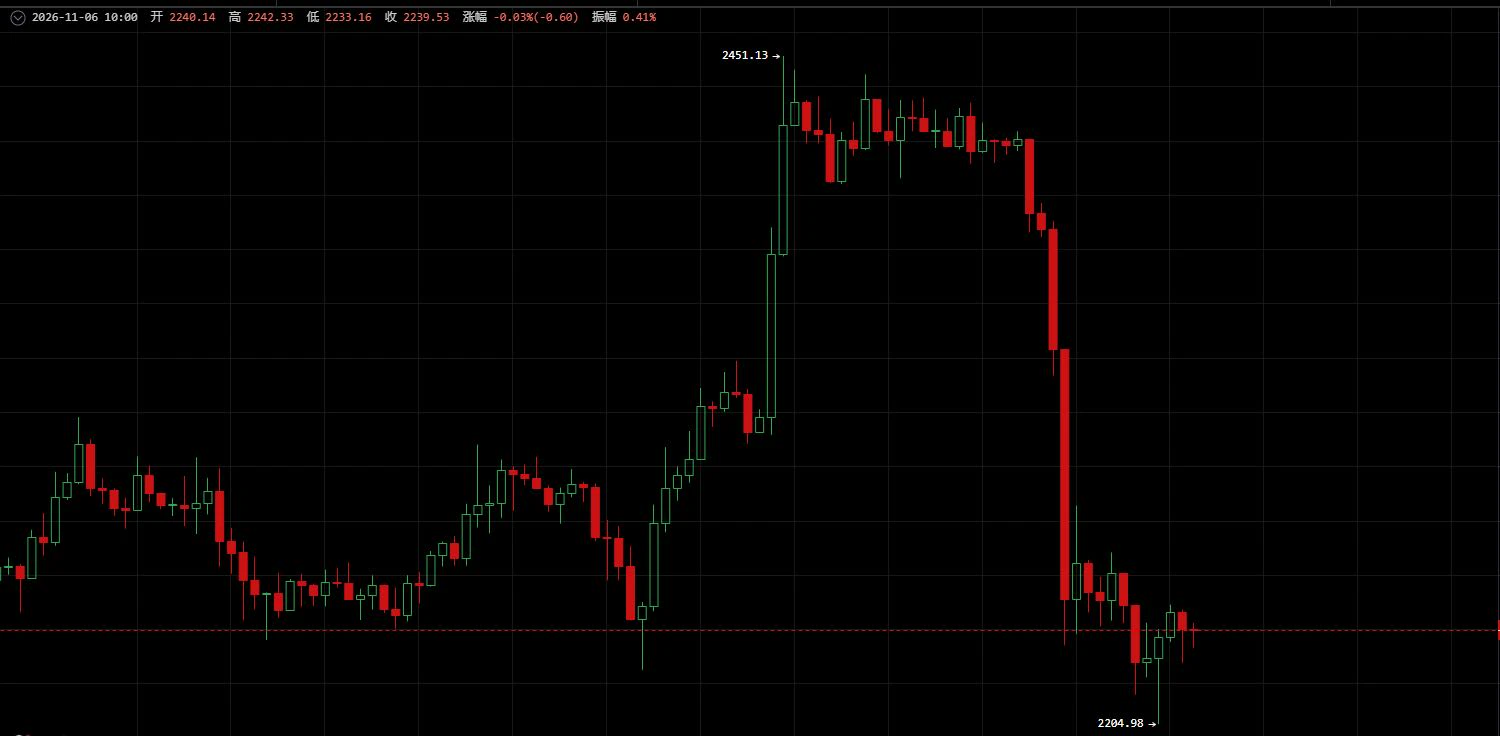
#ETHDrops5.5% Ethereum just gave back a week of gains in a single session, and the damage is concentrated in one place. From the $2,424.82 close on 4 November to the $2,238 close on 5 November, ETH shed roughly 7.7%, and the intraday low of $2,206 tested a level that had held through most of October. At around $2,242 this morning, the question is no longer whether ETH is weak, but whether the $2,200 zone can hold on a closing basis.

The move in numbers
The 4 November candle opened at $2,274.75, rallied to $2,450, and closed at $2,424.82. The 5 November session opened at $2,424.82, touched $2,
ETH-1.26%
BTC-0.67%
  • 6
  • 2
November 6 $ETH After the U.S. election results were finalized, the market shifted to pricing in expectations of fiscal expansion, triggering concentrated selling pressure. After plunging, prices recovered from their lows; short into the rebound.
【Today's Trading Plan】
Short entry range: Position on a rebound to 2260–2280
Take-profit: 2220–2205
【Core Logic】
A surge in hourly trading volume accompanied a sharp breakdown, with bears in control in the short term. The 2260–2280 range is a dense resistance zone formed after the breakdown, with heavy selling pressure on rebounds. A technical recover
post-image
ETH-1.26%
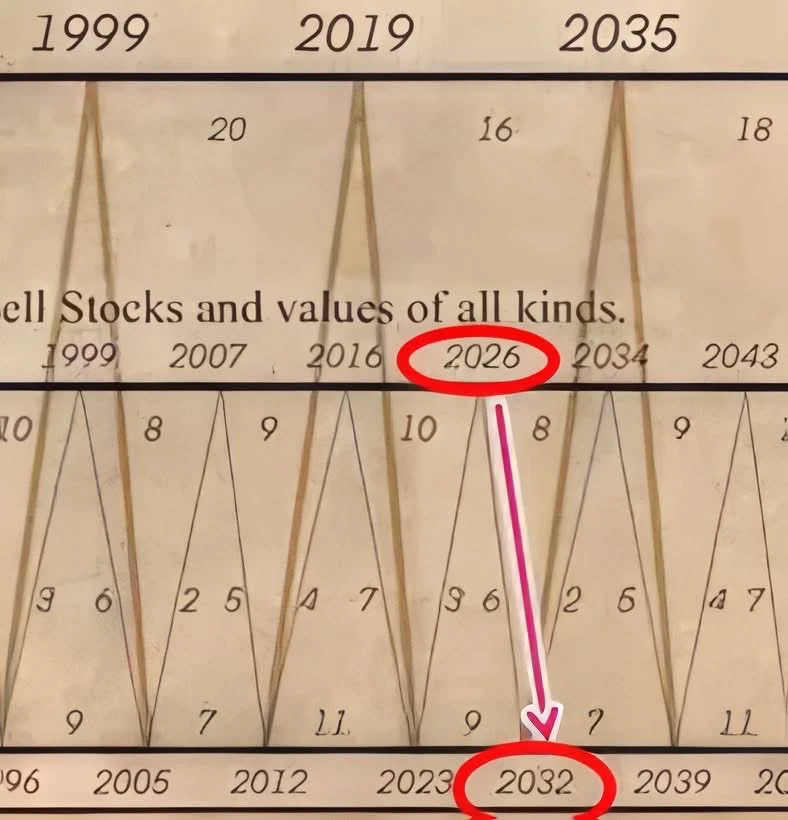
I originally thought this image was bullshit,
but now it seems like it might make a little sense.
But I still think this image is bullshit.
post-image
The AI Stock Crash Brings Back Memories of
live-cover
LIVE1,844
How Does Crypto Lending Work? From Deposit Interest to Liquidation Risks, Explained
In the DeFi world, some people earn interest by depositing crypto assets, while others borrow different tokens by using assets as collateral. The mechanism may seem simple, but it’s worth understanding how interest rates are set, how collateral ratios change, and what can trigger liquidation.
First, where does deposit interest come from?
After users deposit assets into a lending protocol, other users can borrow funds according to the protocol’s rules and pay interest. Depositors’ returns are typically tied to b
post-image
ETH-1.26%
  • 1
261106 Bitcoin on the weekly chart, market is weak. BTC/ETH on the 12-hour chart; use stop-losses for short-term trades! BTC resistance levels: 77458/78827/79892 BTC support levels: 74718/73349/72284 ETH resistance levels: 2278/2319/2350 ETH support levels: 2198/2157/2126 Place the stop-loss slightly beyond the third price. Intraday trades should not exceed 5% of your position. Livestreams are held in the afternoon and evening; follow my homepage to find me. #Gate安全卫士免费开通
post-image
BTC-0.67%
ETH-1.26%
【Yunxiang Research Institute · Guanlan | Nov. 6 Intraday A-Share Market Commentary】
Major indexes weakened in tandem, with the Shanghai Composite testing the 3,600 support level.
Shanghai Composite 3633.79 (-1.52%), ChiNext Index -3.57%; 229 advancers and 2109 decliners, a decline-to-advance ratio of approximately 9.2:1, indicating a marked contraction in risk appetite.
Shanghai Composite: 3600–3610 is the first support zone. A close below this range on higher volume would put 3574 in focus as the next area to watch. 3680–3700 is resistance on a rebound; a return above this range would signal
post-image
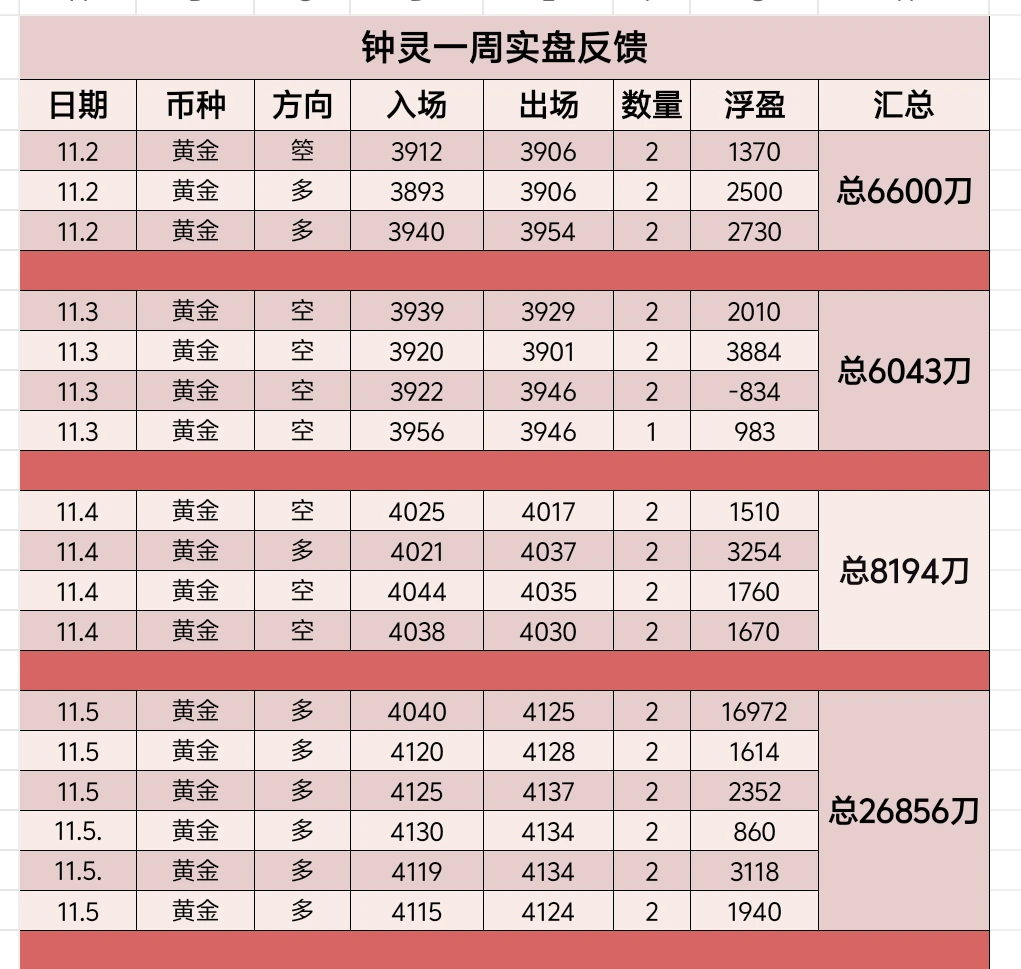
Market orders! Short-term trades! Swing trades! Yesterday, all three strategies were deployed together! All 6 trades hit take-profit!! Smoothly banked $26,856
$XAU $BTC #美股史诗级抛售 #10月非农数据聚焦 #ETH跌5.5% #亚太股市集体重挫
post-image
XAU+0.38%
BTC-0.65%
Gold has formed an upward structure. How much farther can this rebound go?🔹 BTC is approaching $82,
live-cover
LIVE1,269
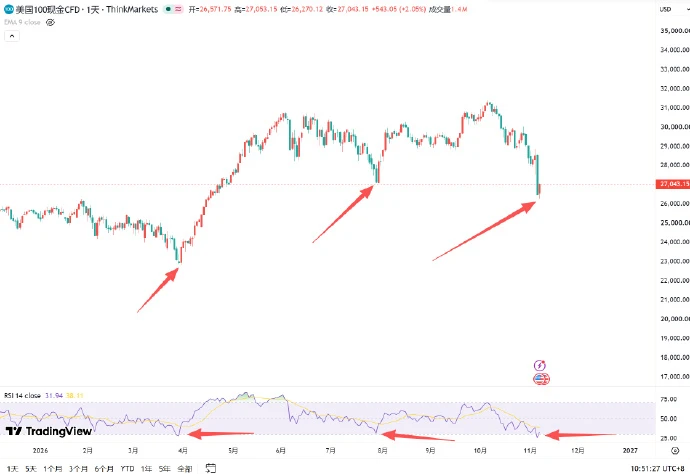
#纳指# Add to the position. An 80% chance of buying the bottom, and a 20% chance of buying halfway up.
post-image
NAS100-0.07%
AI Bubble Bursting? Nasdaq Falls More Than 5% in a Day

The U.S. stock market is best at making you feel like an investing genius one day, then making you question your life choices the next.
On Thursday, the Nasdaq fell more than 5%, and the Philadelphia Semiconductor Index dropped more than 12%, as AI and chip stocks faced a brutal sell-off. In the face of such a sharp correction, one question quickly became the market’s focus: Is the AI bubble about to burst?
Don’t rush to conclusions.
The AI industry has not stopped developing just because stocks have fallen, and companies’ demand for comp
MU-17.23%
Load More

Join 40 M users in our growing community

⚡️ Join 40 M users in the crypto craze discussion

💬 Engage with your favorite top creators

👍 See what interests you

Trending Topics

USStocksFaceHistoricSelloff

586 Views3.46k Discussing

U.S. stocks suffered a sharp selloff on Thursday, with the Nasdaq closing down more than 5% and the Philadelphia Semiconductor Index falling over 12%. AI and chip stocks including $NVDA and $AMD were hit especially hard. Markets are reassessing AI valuations, data-center spending and future returns. Is this just short-term deleveraging, or the start of a deeper correction in the AI trade? Which sectors are you watching next?

GateLaunchesPoSECProofOfSecurity

11.51k Views563 Discussing

USNonfarmPayrolls

8.95k Views3.97k Discussing

View More