Share crypto content and earn up to 60% commissions through content mining.
placeholder
gatefun
July CPI has just been released, but the real showdown comes in September.
July CPI: A Strong Start, but Just an Appetizer
Overall, the July CPI data was broadly in line with expectations: year-on-year growth slowed across the board (headline 3.4%, versus 3.5% previously; core 2.5%, versus 2.6% previously), while month-on-month growth rebounded moderately (headline +0.1%, versus -0.4% previously; core +0.2%, versus unchanged previously).
Three key takeaways:
1. Inflation slowed for the second consecutive month. Core CPI rose 2.5% year on year, its slowest growth since March 2021.
Housing costs
GLDX-0.39%
PAXG-0.70%
View Original
post-image
  • Reward
  • Comment
  • Repost
  • Share
JUST IN: Nomura says June is just the start, ECB likely to follow with a 25bp hike in Sept. Market consensus tilting toward higher for longer rates amid oil-price risk. $ECB
  • Reward
  • Comment
  • Repost
  • Share
#JulyCPIInLineAsInflationCools
US July CPI: No Shock, No Breakout — The Fed Is Still the Real Catalyst
July’s U.S. inflation report delivered exactly what markets were prepared for: cooling inflation, but no dramatic surprise.
Headline CPI eased to 3.4% year over year from 3.5% in June, while monthly inflation increased just 0.1%. Core CPI, excluding food and energy, rose 0.2% month over month, bringing the annual core rate down to 2.5% from 2.6%.
At first glance, this looks bullish for risk assets.
But markets are rarely driven by whether data is simply “good.” They are driven by the gap be
BTC-1.17%
ETH-1.86%
post-image
  • Reward
  • Comment
  • Repost
  • Share
🚨 INSANE $BTC LEVERAGE BET
This is the kind of position that makes you stop scrolling.
One trader is reportedly sitting on a 40x leveraged BTC short worth around $136.03M — and instead of reducing the position, they’ve continued adding to it.
The liquidation price is sitting near $64,595.
That’s the part that really stands out.
At 40x, there’s basically no room for mistakes. A sharp BTC move against the position can turn into a massive loss extremely fast, especially when the position is this large.
And adding more size while already heavily leveraged only increases the pressure.
For everyon
BTC-1.16%
  • Reward
  • Comment
  • Repost
  • Share
Gold's seven-win intraday streak ends!
Short at 4386, stop-loss at 4390, -4 points, -627🔪$XAUT
XAUT-0.63%
View Original
post-image
  • Reward
  • Comment
  • Repost
  • Share
At 13:00 on Aug. 13, Myth Mars once again showed the Ruyi Jingu Bang on the 30-minute chart, indicating that the Wall Street dog market makers again pumped the price before dumping and fleeing on the 30-minute timeframe; on the daily timeframe, Mercury is yellow while Myth institutions’ main force remains green, indicating that there is no main force on the daily timeframe. The main force has already pumped and dumped repeatedly through the 30-minute timeframe and fled. Technically, this level needs a sharp plunge to wash out the market, and bearish news is very likely on the way. Once the bea
View Original
post-image
  • Reward
  • Comment
  • Repost
  • Share
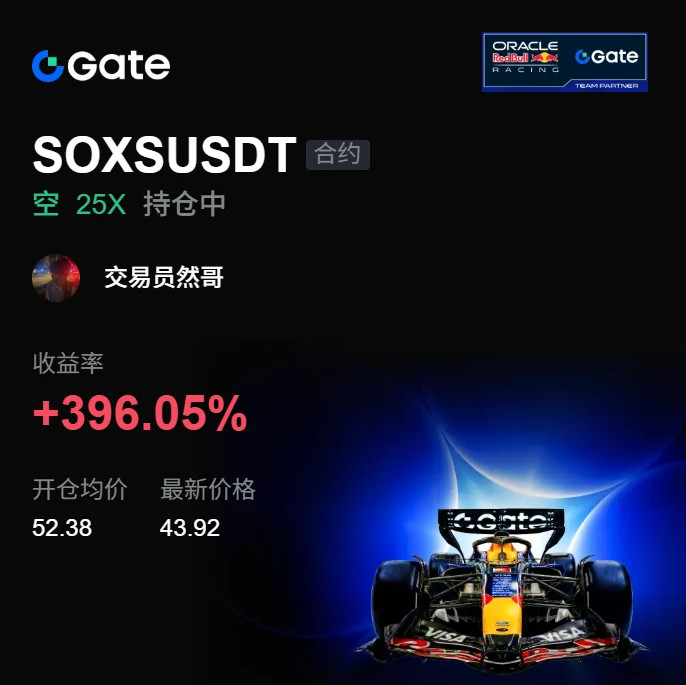
🧐 How to Share Your Stock Trades on Gate Square? 3 Easy Steps!
How to participate:
1️⃣ Enter Gate Square from the 【Home】 page or 【TradFi】
2️⃣ Tap the Post button and select 【Post】
3️⃣ Add a stock ticker tag or trading card and share your trading insights
A $150,000+ prize pool is up for grabs!
Post with #StockTradingShareChallenge for a chance to win up to $3,000!
👉 Share your P&L now: https://www.gate.com/post
Event details: https://www.gate.com/announcements/article/101038
post-image
  • Reward
  • 2
  • Repost
  • Share
CryptoChampion:
To The Moon 🌕
View More
Altcoins vs Bitcoin, the ratio is coiling.
History says: when this breaks, altseason explodes.
#Altcoins #Altseason #BTC #Crypto #LUNC
BTC-1.17%
LUNC-4.07%
post-image
  • Reward
  • Comment
  • Repost
  • Share
The initial jobless claims data will be released at 8:30 p.m.!
Whether the data is good or bad will directly affect gold’s direction. The key is how far the data deviates from expectations. The market will be highly volatile tonight, so trade with caution. #黄金
GLDX-0.39%
PAXG-0.70%
XAU-0.61%
View Original
post-image
  • Reward
  • Comment
  • Repost
  • Share
#GateLaunchpool141MDOS
Gate Launchpool Issue 370 1,410,000 $DOS Rewards, Up to 245.07% Estimated Annualized Yield
Gate Launchpool Issue 370 is attracting attention with a total reward pool of 1,410,000 $DOS, giving eligible users the opportunity to stake $GUSD , $USDT, or $DOS and earn $DOS rewards throughout the campaign. The event runs from August 10, 19:00 to August 24, 19:00 (UTC+8), creating a two-week window for participants to evaluate the pools, choose their preferred asset, and monitor their rewards.
The headline number is an estimated annualized yield of up to 245.07%. This is an an
DOS-21.48%
GUSD0.01%
post-image
post-image
  • Reward
  • Comment
  • Repost
  • Share
#GateLaunchpool141MDOS : MDOS – Everything You Need to Know About the New Mining Opportunity
Gate.io has just launched its 141st Launchpool event, featuring MDOS as the reward token. If you’ve missed previous mining pools, here’s how Gate provides early access opportunities without an ICO: stake, mine, and earn rewards before new tokens hit the public market.
What Is the MDOS Launchpool?
The Gate Launchpool 141: MDOS is now live. The concept is simple — deposit eligible assets, hold them, and receive distributed MDOS rewards over time. In most cases, there is no lock-up period, so you can main
DOS-21.48%
GUSD0.01%
GT0.59%
DYOR4.62%
post-image
  • Reward
  • Comment
  • Repost
  • Share
Goldman warns! Core PCE could come in above expectations, will a rebound in inflation affect the Fed
gate liveLIVE
1,846
live-coin
  • Reward
  • Comment
  • Repost
  • Share
# ‌$SNDK All take profit ‌
1. The Glamsterdam upgrade goes live at the end of August, with gas fees expected to fall by 78%, reducing on-chain transaction costs and benefiting ecosystem activity.
2. Net staking inflows, with over 740k ETH awaiting staking, while the circulating supply remains deflationary; whales continue withdrawing tokens from exchanges to accumulate, locking up long-term holdings.
3. Institutional ETF capital continues to flow in, with institutional core holdings steadily accumulating, substantially limiting the room for a deep decline.
SNDK2.53%
View Original
post-image
post-image
  • Reward
  • 1
  • Repost
  • Share
InternetCelebrityMiMiLao:
Just send it 👊
#GateRankedTop4Globally
GATE IS NO LONGER JUST COMPETING FOR ATTENTION — IT IS COMPETING AT GLOBAL SCALE
The crypto exchange race is becoming less about who can attract the loudest headlines and more about who can consistently deliver liquidity, volume, product depth, security and global reach.
By median daily trading activity, Gate now stands among the top four cryptocurrency exchanges globally, putting it in a league where scale is measured in billions of dollars of daily market activity rather than marketing claims.
The bigger story is how Gate reached this position.
Founded in 2013, the
post-image
post-image
  • Reward
  • Comment
  • Repost
  • Share
#InstitutionsSold21.6BNasdaqFuturesInAWeek
Nasdaq Futures: The $21.6 Billion Institutional Short That Nobody Expected
The week ending August 4th, 2026, will go down as one of the most aggressive institutional repositioning events in the history of the Nasdaq futures market. According to Goldman Sachs, hedge funds, asset managers and other institutional investors collectively sold a staggering 21.6 billion dollars worth of Nasdaq futures in a single week, marking the largest weekly liquidation on record. To put this into perspective, this single-week outflow exceeded every prior weekly selloff
NAS1000.19%
post-image
HighAmbition
#InstitutionsSold21.6BNasdaqFuturesInAWeek
Nasdaq Futures: The $21.6 Billion Institutional Short That Nobody Expected
The week ending August 4th, 2026, will go down as one of the most aggressive institutional repositioning events in the history of the Nasdaq futures market. According to Goldman Sachs, hedge funds, asset managers and other institutional investors collectively sold a staggering 21.6 billion dollars worth of Nasdaq futures in a single week, marking the largest weekly liquidation on record. To put this into perspective, this single-week outflow exceeded every prior weekly selloff ever tracked, dwarfing even the turbulent episodes of 2024 and 2025. The scale of the selling was not spread evenly. A remarkable 72 percent of the total sales were executed through outright short positions, which means institutions were not merely trimming existing longs but actively building bearish exposure into the market.
The breakdown of who was selling reveals exactly where the bearish conviction is concentrated. Hedge funds, which are typically the most tactical and aggressive group in the futures complex, offloaded 11.9 billion dollars in Nasdaq futures during that week. Asset managers, the large pension funds, mutual funds and institutional allocators that generally prefer to lean long over the long term, sold 7.4 billion dollars of their own. Combined, the two groups brought total institutional net positioning in Nasdaq futures down to negative 5 billion dollars, which is a significant milestone because it marks the first time since May 2025 that the combined institutional book has turned net short. Even more striking is the comparison with where this positioning stood just ten months earlier. In October 2025, the same institutional cohort held a net long position in Nasdaq futures of roughly positive 54 billion dollars. The swing from that peak to the current negative 5 billion represents a reversal of nearly 59 billion dollars in net exposure, or approximately a 109 percent swing in positioning relative to the previous high, in less than a year.
The official Commitments of Traders data published by the Commodity Futures Trading Commission confirms the same picture from a different angle. In the weekly COT report covering the same August 4th period, large speculators in Nasdaq 100 futures increased their short positions by an enormous 22,622 contracts week over week. To give that number context, total short contracts ballooned to roughly 100,463, rising more than 29 percent in a single week, while long contracts actually declined. The net speculative position collapsed to negative 35,006 contracts, a one-week deterioration of more than 25,000 contracts that stands as one of the sharpest weekly flips in the entire history of the COT data. Meanwhile the Nasdaq 100 index itself closed the week near the 29,683 level, up about 6.8 percent from its early July close near 27,796, which makes the aggressive shorting even more notable because institutions were selling into market strength at historically elevated price levels.
The sheer size of the move becomes clearer when converted into percentage terms. From its March 2026 low near 23,000, the Nasdaq 100 had recovered with extraordinary speed, rallying more than 33 percent in roughly ten weeks to reach record highs above 30,660 before pulling back toward the 29,500 to 29,800 range. The current index level around 29,762 represents a gain of approximately 23.8 percent over the trailing twelve months, and the 52-week range shows the index trading between a low near 22,841 and a high near 30,762. At current levels the index has retraced 7.1 percent from its record high, a meaningful pullback from the peak that is precisely the kind of environment in which professional shorts tend to accelerate. The fact that institutional positioning flipped to negative for the first time in fifteen months, at a price level still within roughly 3 percent of its all-time high, suggests a profound shift in the risk appetite of the world's largest asset allocators.
This kind of concentrated institutional shorting rarely happens in isolation, and it typically carries a specific message about the market's trajectory over the coming months. When hedge funds and asset managers simultaneously reduce long exposure and build short positions, it generally signals that these sophisticated players are bracing for a correction, managing risk defensively, or protecting existing capital against a potential drawdown. The extremely one-sided nature of the positioning, with shorts dominating 72 percent of the activity, also raises the risk of a short squeeze should any positive catalyst arrive. If a headline-driven rally were to push the Nasdaq 100 toward its recent highs near 30,660, a rebound of just over 3 percent from current levels could force shorts to cover, which historically amplifies upside moves. Conversely, if the broader market continues its softness and the index breaks below key support near the 29,100 to 29,500 zone, a decline of roughly 1 to 3 percent from here could trigger a cascading liquidation of the weakest hands among institutional sellers.
The context behind this bearish wave is not difficult to understand. Rising geopolitical tensions have been deteriorating risk appetite across all equity classes, and hedge funds posted their largest net short positioning in global equities in thirteen years during the past month, according to Goldman Sachs data. Institutional investors dumped 4.2 billion dollars in US equities in a single recent week, bringing the seven-week cumulative outflow to a negative 17.7 billion dollars, with individual stocks alone accounting for 5.9 billion dollars of the selling. Technology and semiconductor names have been under particular pressure as the artificial intelligence trade, which powered the meteoric rally of the past year, has begun to lose some of its speculative sparkle. The index's historic run, which delivered roughly a 33 percent gain in just ten weeks off the March low, left valuations stretched, and the combination of elevated prices, hawkish signals from the Federal Reserve and fading AI enthusiasm has given institutional investors ample reason to lock in profits and build defensive short positions.
For the average investor, the message embedded in this data is one of caution rather than panic. Record institutional shorts are a contrarian signal that can sometimes mark a near-term bottom, because the sheer volume of bearish positioning leaves less fuel for further downside and creates the potential for a squeeze. But the speed and scale of the reversal, cutting roughly 59 billion dollars of net positioning in under a year and turning a once heavily long institutional book negative for the first time since May 2025, is a serious warning that the smartest money in the market is no longer betting on uninterrupted upside. The Nasdaq 100 now trades around 29,762, within 3 percent of its record high of roughly 30,762, yet institutional positioning has swung from 54 billion dollars net long to 5 billion dollars net short. When the street's most sophisticated players are selling 21.6 billion dollars in a single week, with nearly three quarters of that activity in outright shorts, the prudent interpretation is that they are expecting turbulence ahead. Whether that proves to be a temporary hedge or the beginning of a deeper correction will only become clear in the weeks ahead, but the positioning data is unambiguous in its message of institutional caution.@Gate_Square
repost-content-media
  • Reward
  • 1
  • Repost
  • Share
Venüs_:
2026 GOGOGO 👊
$ETH 2H Market View: Still Stuck in the Range
ETH is sitting around $1,882 right now, and honestly, the 2H chart doesn’t look like a clean trend yet. It looks more like a range where both sides are waiting for liquidity to get taken.
The bigger structure on this chart is pretty clear:
$1,852 → $1,930
That’s roughly the battlefield ETH has been trading inside. We got the sharp rejection from around $1,930, then the drop toward $1,852, followed by a recovery. But the recovery hasn’t produced a convincing higher high yet.
What caught my attention is what’s happening around the moving averages.
$
ETH-1.87%
  • Reward
  • 1
  • Repost
  • Share
RustySteps:
I strongly agree with this conclusion. It’s a stalemate now: if 1895 cannot be reclaimed, the bias is bearish; a break below 1869 will most likely lead to a test of 1852. Rather than guessing the direction, it’s better to wait until that liquidity is taken out.
Layout for Bitcoin, Ethereum, and Dogecoin
gate liveLIVE
1,973
  • Reward
  • 3
  • Repost
  • Share
TalkingAboutMemeAsTheCoinMakes:
May the bull market return soon 🐂
View More
#MemoryChipsRally
The memory chip rally is becoming one of the most closely watched themes in the semiconductor market, with AI infrastructure emerging as a major force behind demand for DRAM, HBM, and NAND.
Memory stocks have recently moved sharply higher as investors focus on tight supply, strong AI-related demand, and expectations that the industry could remain constrained well into 2027. Recent market coverage highlighted strong moves across major memory names, reflecting growing confidence in the sector.
The biggest structural driver is artificial intelligence. Modern AI data centers req
DRAM7.38%
post-image
  • Reward
  • Comment
  • Repost
  • Share
4u is my daily living expenses, and I can’t even spend it all
What the market gives me
View Original
post-image
  • Reward
  • Comment
  • Repost
  • Share
📊🔥 My Trading Journey Through P&L — Strategy, Discipline & Market Awareness
#股票交易分享挑战
Trading is not simply about watching prices move up and down. It is about understanding the market, building a clear plan, managing every position carefully, and most importantly, staying disciplined when the market becomes uncertain. 📈🧠
Today, I’m sharing my trading experience as part of the #股票交易分享挑战, with a focus on my P&L, market observations, and the strategy behind my decisions.
💰 Today’s P&L Snapshot
📌 Trading Pair / Ticker: [Add Ticker]
📌 Entry Price: [Add Entry]
📌 Exit Price: [Add Exit]
📌 Da
post-image
post-image
  • Reward
  • Comment
  • Repost
  • Share
Load More

Join 40 M users in our growing community

⚡️ Join 40 M users in the crypto craze discussion
💬 Engage with your favorite top creators
👍 See what interests you
  • Pinned