

Share your thoughts
placeholder
Article
Two crypto billionaires push £72m into Reform UK, setting a UK political donation record; funds aimed at “fair and competitive” election governance. $BTC exposure? none explicit, but crypto politics heat could ripple markets. $REX?
post-image
BTC+0.10%
#8月CPI数据出炉
#每周来晒
August US CPI landed on September 11 and looked like a non-event: headline inflation up 0.4 percent month over month and 3.4 percent year over year, both in line with consensus. The detail underneath is what matters, and I think most people are reading this print backwards.
The question here is whether the data changes the Fed's rate cut path. My answer is blunt. There is no cut path to change. The market is pricing a hike, and that is the story of this week.
Question one, will CPI change the Fed's path
Yes, but not in the direction the question implies. August core CPI came
BTC Bold Moves
live-cover
LIVE335
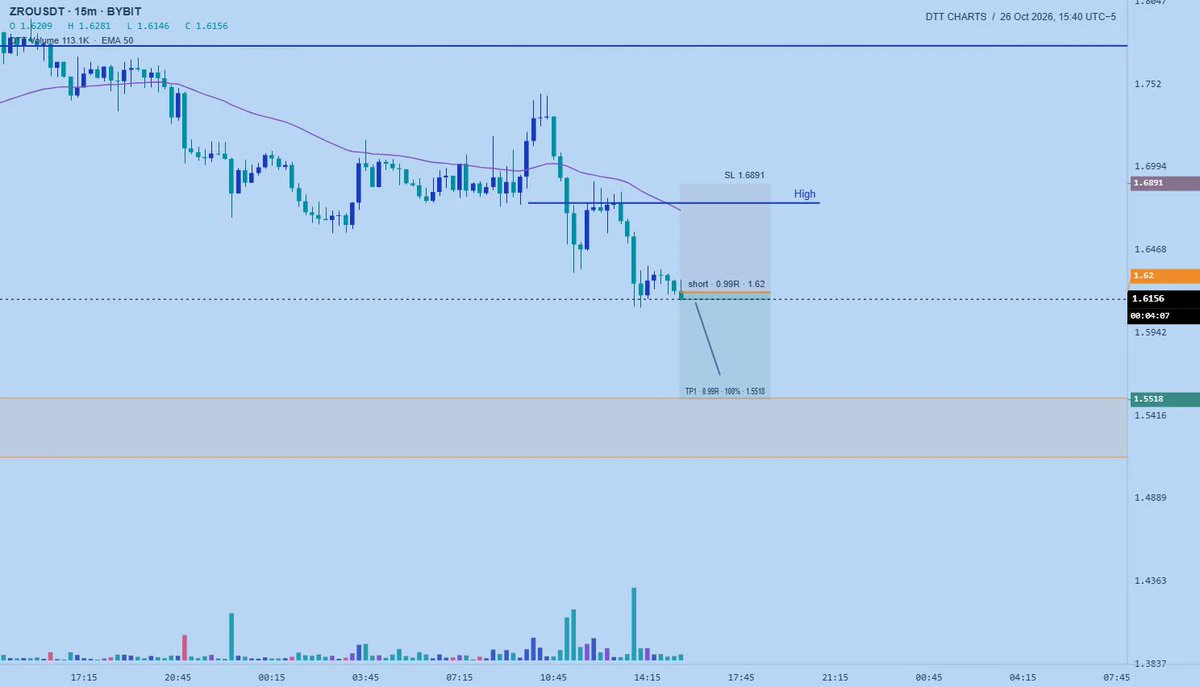
This isn’t a pullback—it’s CPR for my empty account. While the whole screen was glowing green and everyone else was running, I was thinking $PIPPIN was showing weak upward momentum, with clear resistance overhead and no surge in volume. It reeks of a bull trap. This kind of rebound is meant to be shorted. I entered right when the market opened and dumped, shorting at 0.01950. It’s now at 0.01794, and I opened my account to see +157.51%. Feels good, brothers—what a satisfying meal. Take profits when it’s time: pocket the bulk first, set the rest at breakeven, and let it fall. Don’t give the pr
post-image
PIPPIN+0.45%
LAB-14.10%
DOGE+0.80%
$BTC Signal】Short setup + 4H moving-average suppression/order-book sell pressure buildup
$BTC The 1H rebound is weak, with the buy-side ratio slipping from 0.56 to 0.45 over four candles. Sell orders are densely stacked above 77384, and order-book depth is imbalanced by -35.5%, with sell-side thickness outweighing buy orders below. Price is oscillating around the 1H Bollinger middle band at 77260, while the upper band at 77424 remains unbroken. The 4H EMA20 is at 77580; the rebound fell back without reaching it, and the short-term moving-average system is still suppressing price. The 1H MACD
post-image
BTC+0.15%
I wasn't watching the charts or thinking about it—it just kept falling on its own, like it was working overtime for me. 😌

When I checked the charts after lunch, $SKYAI 's rebound was weak and the bull-trap smell was too strong, so I opened a short at 0.06198 in advance.

When I woke up, 0.05125 and +424.52% were already sitting there. Staying up wasn't in vain. I took 80% off the table first, with the remaining 20% protected at the entry price.

Don't lose your patience in the chop, then try to win back your dignity in a one-way move. The market never lacks opportunities; what it lacks is
post-image
SKYAI-1.79%
ADA+1.62%
BTC+0.15%
$GRIFFAIN Signal】Long + order-book support + moderate funding rate
$GRIFFAIN Intraday gain of 43.98%, current price 0.01588. The order-book buy/sell ratio is 1.18, with depth imbalance at +8.05%; bids below are active, and selling pressure is being quickly absorbed.
The funding rate is 0.0266%, indicating that long sentiment is not overcrowded. OI remains stable, and no distribution-style position increase at the highs has appeared. 1H and 4H indicator data is unavailable, making price action the only anchor. The risk-reward ratio is 1.50, with 0.85% stop-loss room and a clear tolerance bou
post-image
GRIFFAIN+47.29%
What do they know? 😲
For this $AKE long position, I entered around 0.0129703. The idea was simple: after the previous high was broken, the pullback held, so I followed the structure for a move. During the holding period, there were false breakouts and stop-loss sweeps, but the key level held throughout.

I’m currently up +598.64%. I’ve taken profit on 70% first and remain bullish. I’ll watch whether the remaining position can reclaim and hold above the key level. If it holds, I’ll continue holding; if not, I’ll exit.

My biggest takeaway after entering is: don’t let short-term wicks push you around. If the struc
post-image
AKE+15.08%
XRP+0.72%
ADA+1.62%
Insiders are already shorting $XAUT /USDT while retail still chases the highs.

$XAUT /USDT - SHORT

Trade Plan:
Entry: 4350.3 – 4353.1
SL: 4362.7
TP1: 4343.4
TP2: 4337.9
TP3: 4329.6

Why this setup?
Why now? The daily trend is bearish with a 95% confidence short bias, and the 1h price sits at 4351.7 right inside the entry zone of 4350.3 to 4353.1. The 15m RSI at 66.69 shows momentum is still elevated, meaning a mean reversion toward the daily short bias is overdue. The 1h ATR of 5.516696 confirms enough volatility to push through the first target at 4343.4 and reach the second target at 43
XAUT+0.09%
MARKET ANALYSIS - ZEC
Technical Analysis
15 Minutes: Selling pressure dominates after price failed to hold at the 1,165.56 peak. Capped by the EMA20 (1,143.54) and EMA50 (1,145.82) resistance levels. Nearest support is at 1,120.95.
30 Minutes: Market structure is forming a lower-high pattern. EMA20–EMA200 resistance confluence is in the 1,145.15–1,152.73 area, with major support at 1,086.76.
Trading Opportunities
Short Position (Trend-Following)
Entry Area: Pullback in the 1,143–1,146 range (near EMA20/EMA50).
Take Profit: 1,121 (TP1) and 1,087 (TP2).
Stop Loss: 1,154 (above EMA200).
Long Posi
GreatTraderOG
GIVEAWAY FOR MY SUBSCRIBERS🥳
PART 1
ZEC-3.42%
ETH-0.63%
GT+0.72%
BTC+0.15%
SOL+0.39%
  • 2
robinhood:0x8ff92566f2e81bdd68edfaa8cde73942a723796b
post-image
Gold Holds Elevated Levels As Markets Reprice Rates, Could Defensive Demand Stay Strong?
live-cover
LIVE676
Why is everyone suddenly calling for a range breakout when the 1h price sits at 150.09?

$SPCX /USDT - SHORT

Trade Plan:
Entry: 149.98 – 150.20
SL: 151.11
TP1: 149.32
TP2: 148.81
TP3: 148.04

Why this setup?
Why now? The daily trend is a range, and the 15m RSI at 44.62 shows bearish momentum without being oversold, which means sellers are still in control. The 1h ATR of 0.42657 proves there is enough volatility to push the 1h price from the entry zone of 150.09 down to TP1 at 149.32 and further toward TP2 at 148.81. The entry range between 149.98 and 150.20 acts as the trigger, but the rea
SPCX-0.06%
Why is everyone suddenly calling XRP a range-bound trap when the 1h price sits at 1.365?

$XRP /USDT - SHORT

Trade Plan:
Entry: 1.363 – 1.367
SL: 1.385
TP1: 1.350
TP2: 1.341
TP3: 1.326

Why this setup?
Why now? The daily trend is range, which means the 1h price at 1.365 is acting as the entry_ref for a short setup with an entry zone between 1.363 and 1.367. The 15m RSI at 36.65 shows bearish momentum without being oversold, allowing room to run toward TP1 at 1.350 and TP2 at 1.341. The 1h ATR of 0.008164 tells us each candle moves roughly 0.8%, so the distance to TP1 is well within one ave
XRP+0.72%
Most traders are about to get blindsided by $HYPE /USDT.

$HYPE /USDT - LONG

Trade Plan:
Entry: 79.939 – 80.279
SL: 78.480
TP1: 81.331
TP2: 82.145
TP3: 83.367

Why this setup?
Why now? The daily trend is bullish and the 4h setup is screaming continuation, but the 1h RSI at 49.68 shows the asset is just neutral, not overbought, leaving room to run. The 1h ATR of 0.6788 confirms volatility is expanding enough to fuel a move from the entry zone at 80.109 toward TP1 at 81.331 and then TP2 at 82.145. The invalidation level at 81.621 is the hard line in the sand, because a close above it destroy
HYPE-0.41%
9/13
ETH Wealth Code
ETH late-night second signal: short entry at resistance. Close at 15:00.
post-image
ETH-0.63%
Caught this short move; $CAP has been steadily declining after coming under pressure from its highs. When I set up the position earlier, I was looking for a failed breakout followed by a recovery, with a clear upper wick at the previous high and a more favorable bearish structure. Once the return reached +189.78%, I took profit on 80% and placed a protection level for the remaining 20%.

There was a rebound in between, but each time it approached the moving average, it was pushed back down, failing to form an effective breakout. As long as this key level holds, I remain bearish; if it breaks
post-image
CAP+2.39%
SOL+0.39%
DOGE+0.80%
The breakout failed under pressure at the highs, so I opened a $SUE short as planned. I was looking for a low-volume rebound, with consecutive upper wicks at the previous high, and the structure was bearish. It rallied to around 0.004224, bringing the return to +85.97%, so I chose to close 80% first and continue trailing the rest with a protective level.
So far, the market has seen a rebound, but it failed to hold above the key moving averages, and the bearish momentum remains intact. As long as the key levels above are not decisively reclaimed, I still favor a bearish retest; if it breaks out
post-image
SUE-40.19%
SOL+0.39%
BTC+0.15%
70% of the position has already been realized above 0.01; $FLYBRAIN this long position's unrealized profit is +143.09%. I’ve left a protective level on the remaining 30% to let the profits run, so there’s no rush to close everything.

When I entered, I was looking for a retest that held above the previous low. The structure kept stepping higher, while volume did not expand, clearly not looking like distribution. The battle between bulls and bears was intense over those two days, but order book support never disappeared. Shakeout wicks can only flush out those chasing entries; those who held
post-image
FLYBRAIN-28.02%
ADA+1.62%
ETH-0.63%
Load More

Join 40 M users in our growing community

⚡️ Join 40 M users in the crypto craze discussion

💬 Engage with your favorite top creators

👍 See what interests you