Share crypto content and earn up to 60% commissions through content mining.
placeholder
gatefun
#StrategySharesBreak135ForFirstTimeIn12Weeks
Strategy shares cleared 135 for the first time in twelve weeks and the daily chart is now showing the full reaction to that break. The stock surged more than 10 percent intraday on the back of unrealized Bitcoin gains that reached 4 billion dollars. That move was the cleanest reclaim of the range high in months.
Price is currently sitting at 127.29 after printing a high of 135.97 and then giving back a large part of the gain. The 50-period EMA rests at 110.06 and the 200-period EMA remains overhead at 156.68. Bollinger Bands stretch from 78.79 on t
MSTR-7.40%
post-image
Crypto_Buzz_with_Alex
#StrategySharesBreak135ForFirstTimeIn12Weeks
Strategy shares cleared 135 for the first time in twelve weeks and the daily chart is now showing the full reaction to that break. The stock surged more than 10 percent intraday on the back of unrealized Bitcoin gains that reached 4 billion dollars. That move was the cleanest reclaim of the range high in months.
Price is currently sitting at 127.29 after printing a high of 135.97 and then giving back a large part of the gain. The 50-period EMA rests at 110.06 and the 200-period EMA remains overhead at 156.68. Bollinger Bands stretch from 78.79 on the downside to 134.13 on the upside, with the middle band near 106.46. The recent high tagged the upper band and the SRL resistance at 134.13 exactly. That level remains the key ceiling. Support now starts at the 50-period EMA near 110, followed by the middle band at 106.46 and the deeper 89.21–78.79 zone.
RSI has pulled back to 63.04 after the spike, still constructive but no longer stretched. MACD remains positive on the signal lines even as the histogram has cooled, which is normal after such a sharp impulse.
The bullish case requires a reclaim and hold of the 134–135 zone on rising volume. If Bitcoin continues to support the unrealized gain figure and buyers step in above 130, the path of least resistance still points toward a retest of the 156.68 EMA and potentially the higher 197 area. In that scenario the entire 110–106 region becomes the first support band on any further pullback.
The bearish case is a failure to regain 134. A daily close under the 50-period EMA at 110.06 would likely target the middle Bollinger Band at 106.46 and open the door toward 89.21. After a twelve-week range and a 10 percent breakout day, the sharp rejection we have already seen shows that supply is still active near the highs.
I am treating 134.13 as the immediate decision level and 110.06 as the short-term trend filter. Until price either accepts back above the breakout zone or loses the 110 area with conviction, size stays measured. The 4 billion unrealized gain is a powerful fundamental backdrop, but the chart still has to prove the 135 break was more than a one-day liquidity event.
Are you buying the current pullback toward 110, waiting for a clean reclaim of 134, or already reducing exposure after the rejection? Share your levels and framing.
#MSTR $MSTR
repost-content-media
  • Reward
  • Comment
  • Repost
  • Share
#NVIDIAEarnings
NVIDIA IS STILL AT THE CENTER OF THE AI BOOM
NVIDIA’s latest earnings once again showed why the company remains one of the most important names in global technology. Revenue reached approximately $96.2 billion, up 106% year over year, while Data Center revenue reached around $89 billion, rising 117% year over year.
The Data Center business remains the main growth engine. Hyperscalers, AI companies and enterprises continue investing heavily in accelerated computing, and NVIDIA’s GPUs, networking and software ecosystem are allowing the company to capture a major share of this spe
NVDA-4.58%
AMD-2.39%
post-image
post-image
  • Reward
  • Comment
  • Repost
  • Share
US electricity prices rose 4.2% over the past year.
Source: Federal Reserve Economic Data.
  • Reward
  • Comment
  • Repost
  • Share
$AVAX Signal】Long | 1H breakout + MACD golden cross confluence
$AVAX The 1H order-book buy-side ratio is 9.99%, with a Bid/Ask depth of 1.22, indicating solid support below. The 1H MACD histogram continues to expand, while the 4H has just completed a golden cross, creating multi-timeframe confluence. The current price of 7.366 is approaching the upper Bollinger Band, with acceleration expected upon breakout.
🎯Direction: Long
⚡Entry/Limit Order: 7.34390 - 7.36600
🛑Stop-loss: 7.29234
🚀Target 1: 7.47649
🚀Target 2: 7.53174
🛡️Trade Management:
- Execution strategy: Reduce the position by 50%
AVAX1.60%
BTC1.51%
ETH1.59%
SOL3.02%
View Original
post-image
  • Reward
  • Comment
  • Repost
  • Share
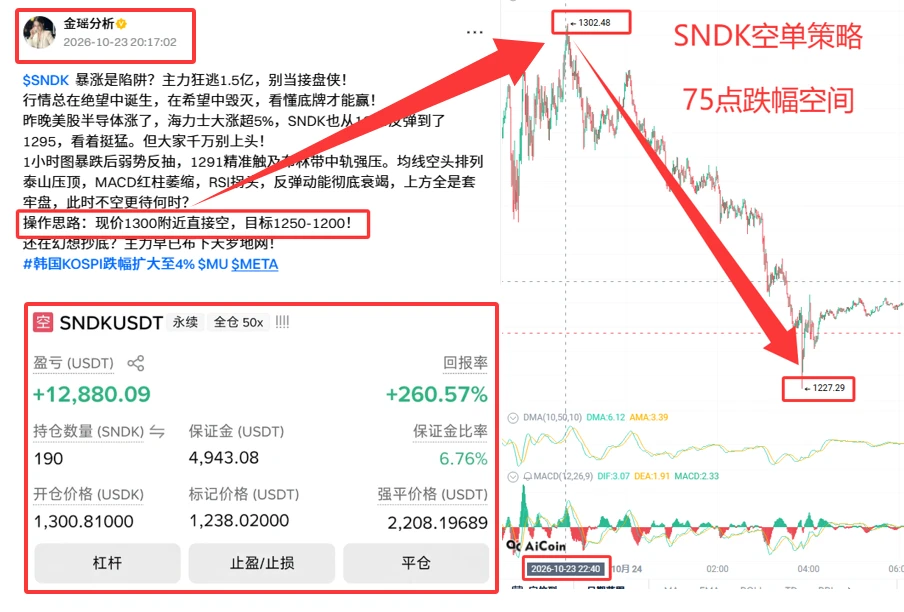
I wasn't watching the charts or using my brain—it was jumping on its own, like it was working overtime for me. With the screen glowing green, I saw $SNDK selling pressure was more aggressive than the buy orders, with clear resistance overhead. Every push upward fell just short, so I opened a short position at 1651.77.
The last thing I checked before bed was that 1494.89 had already pushed my return to +673.48%. It felt really good.
I pocketed the bulk of the profits first, closing 70% outright. I moved the stop-loss on the remaining 20% to the breakeven line and let the trade run for a while.
SNDK0.36%
SOL2.97%
XRP1.20%
View Original
post-image
  • Reward
  • Comment
  • Repost
  • Share
#StrategySharesBreak135ForFirstTimeIn12Weeks
Strategy Shares Slip Below $135 – What the Numbers Really Say
Strategy Inc. (NASDAQ: MSTR), the company formerly known as MicroStrategy and now the largest corporate Bitcoin treasury holder, just delivered a sharp down day. On Friday, August 28, 2026, the stock closed the regular session at $127.29, a drop of $10.10 or 7.34% from the previous close of $137.39. The session opened at $134.00, climbed as high as $135.97, then reversed hard to an intraday low of $126.38 before settling near the bottom of the range. In dollar terms, shareholders watched
MSTR-7.34%
BTC1.51%
STRC-0.57%
post-image
post-image
  • Reward
  • Comment
  • Repost
  • Share
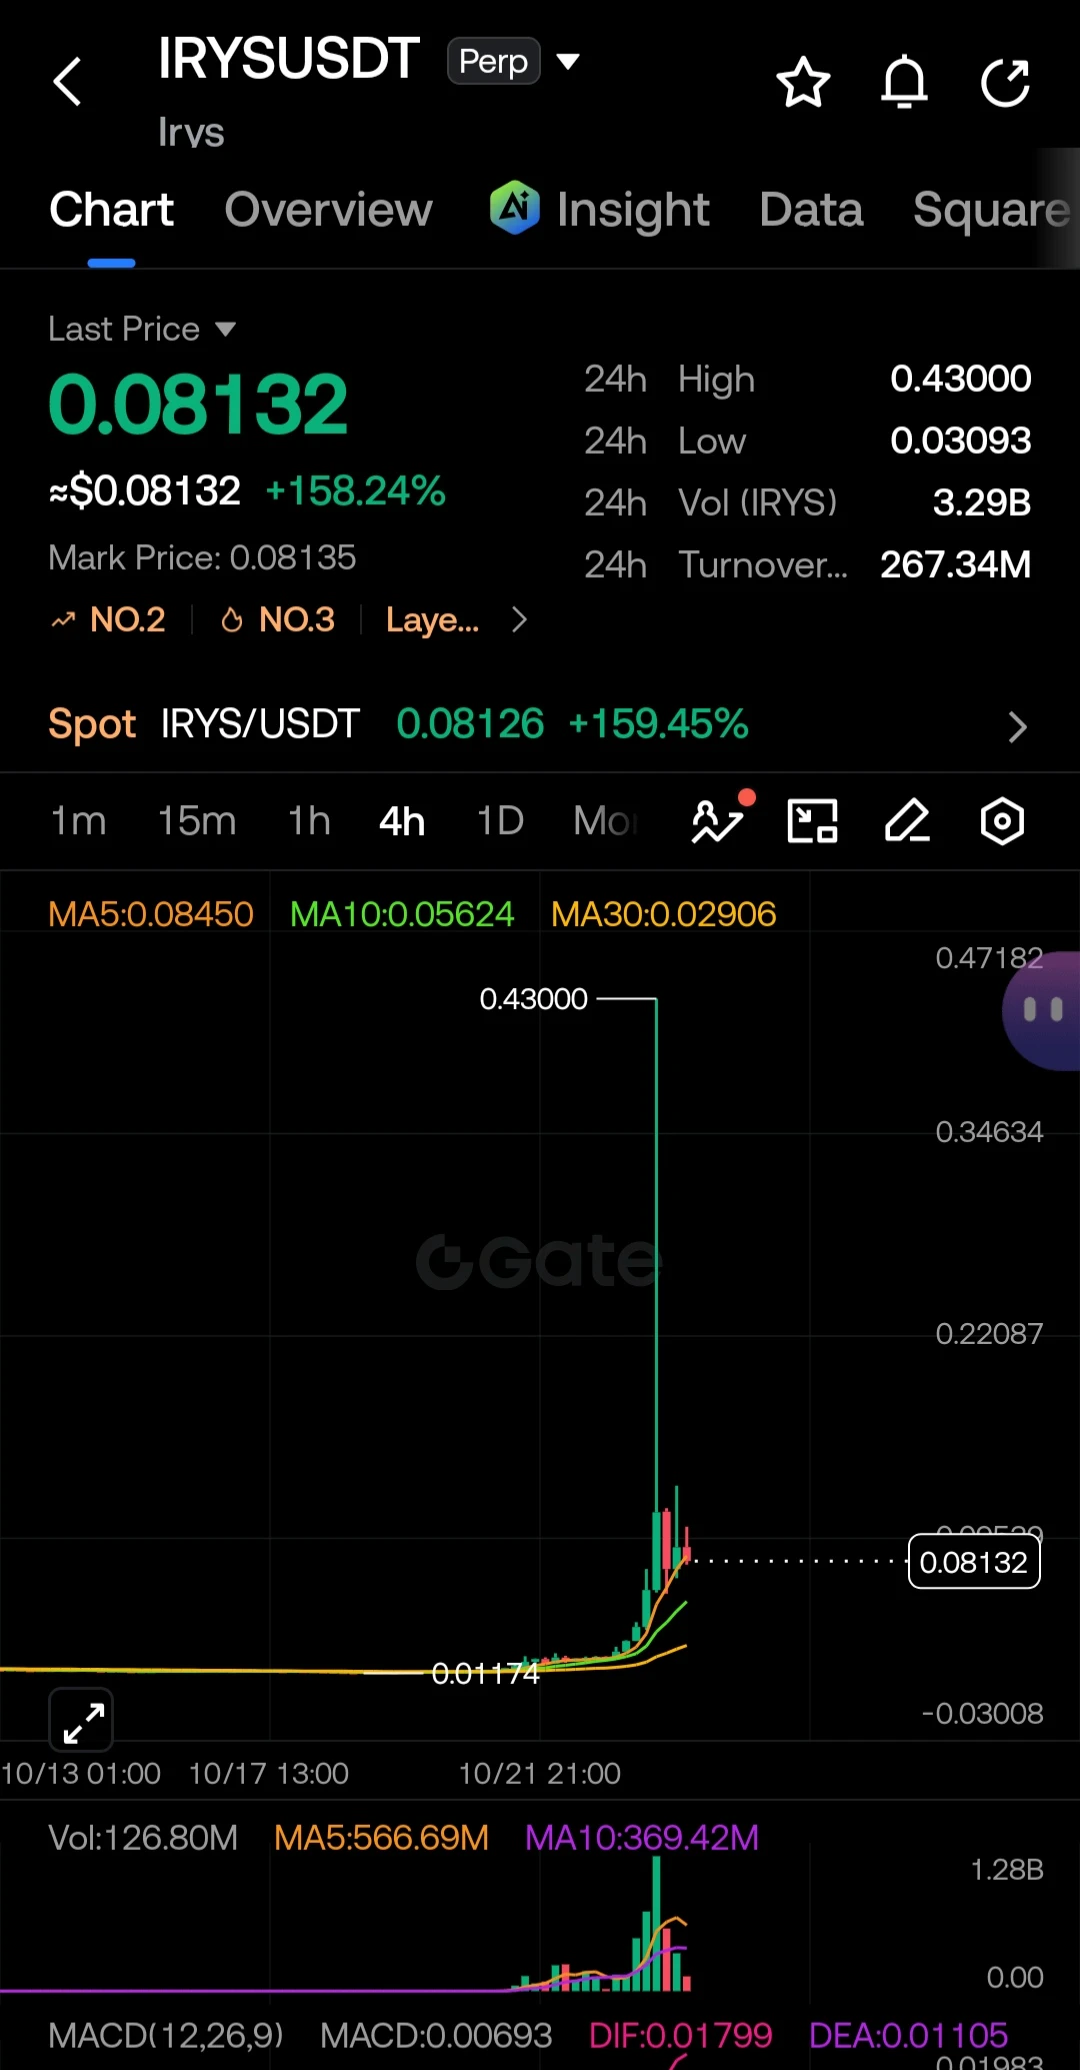
$牛来 NIULA/USDT 15m - Spot
CURRENT STATUS
- Price: $0.10696 +103.03% 24h
- 24H High: $0.11488
- 24H Low: $0.04849
- 24H Volume: 51.34M NIULA
- 24H Turnover: 4.69M USDT
- AI Insight: "Bull run: +9.53% in 15 minutes"
- Rank: #2 Meme on Gate
15m CHART ANALYSIS
1. Massive pump from $0.07700 low → +39% today
2. Pushed hard to $0.11488 24h high
3. Now consolidating around $0.10696
4. Next resistance: $0.11866
5. First support: $0.09593
Order Book: 51.49% BUYERS vs 48.51% SELLERS
Buyers slightly in control
WHAT HAPPENS NEXT?
SCENARIO 1: CONTINUES PUMPING - 60% chance
Break $0.11488 → $0.11866 → New
牛来126.03%
post-image
  • Reward
  • 3
  • Repost
  • Share
MİSSİNGCANDLES:
Take a realistic approach to profits.
View More
I originally just wanted to freeload a breakfast, but the market ended up treating me to six months of dumplings 😎 When the market first dumped in the morning, $DGAI every push upward was just short of breaking through, and the overhead pressure was obvious. I directly chose to short this low-volume rebound. Some people were still arguing with me that this was going to reverse, so I ignored them.

From 0.7675 down to 0.71, +157.79% secured. Feeling great, brothers—we can have a good meal today.

First close 70%, locking in the bulk of the profits; move the stop loss on the remaining 20% to
DGAI7.95%
DOGE0.62%
SNDK0.36%
View Original
post-image
  • Reward
  • Comment
  • Repost
  • Share
Crypto panic index falls back to 68, market still in ‘greed’.
gate liveLIVE
1,103
live-coin
  • Reward
  • Comment
  • 1
  • Share
$ETH : HTF STRUCTURE IS AT A DECISION POINT
Ethereum is compressing directly beneath a multi-month descending resistance line after reclaiming the $2,500 area. The structure remains constructive, but the next daily close is critical.
▶️ $2,500–$2,550: Major HTF resistance
▶️ Daily close above → Trendline breakout confirmation
▶️ $3,400: Primary upside objective
▶️ $1,840–$1,950: Structural demand zone
▶️ $1,550: Bullish structure invalidation
The setup is simple:
Acceptance above resistance = expansion
Rejection = rotation back into demand.
No breakout confirmation, no blind chasing.
ETH1.59%
post-image
  • Reward
  • Comment
  • Repost
  • Share
#NVIDIAEarnings: AI Demand Is Still Accelerating
NVIDIA has once again delivered a massive quarterly performance, highlighting just how powerful the global AI infrastructure boom has become.
For the second quarter of fiscal 2027, NVIDIA reported revenue of $96.2 billion, representing an extraordinary 106% increase year over year and an 18% increase compared with the previous quarter.
The numbers are remarkable, but the most important part of this earnings report is what they reveal about the broader AI industry: demand for accelerated computing, AI infrastructure, GPUs, networking, and data-c
post-image
  • Reward
  • 1
  • Repost
  • Share
HighAmbition:
To The Moon 🌕
I was just about to go to the forum and rant, but then I saw my balance and decided against it—the market is always right. 😤
A few days ago, I took one last look before bed. The rebound was weak, and every push upward fell just short. I warned then: opening a short here would be more comfortable than chasing longs; don't wait until the level breaks to regret it. Those who bought at the highs are still bragging. I won't argue—let the price do the talking. 👀
Then I opened the chart this morning: the short opened at 0.06851, with the current price at 0.04589 and +2342.74% already displayed on t
XRP1.20%
BNB1.50%
View Original
post-image
  • Reward
  • Comment
  • Repost
  • Share
Which #crypto project will do this?
post-image
  • Reward
  • Comment
  • Repost
  • Share
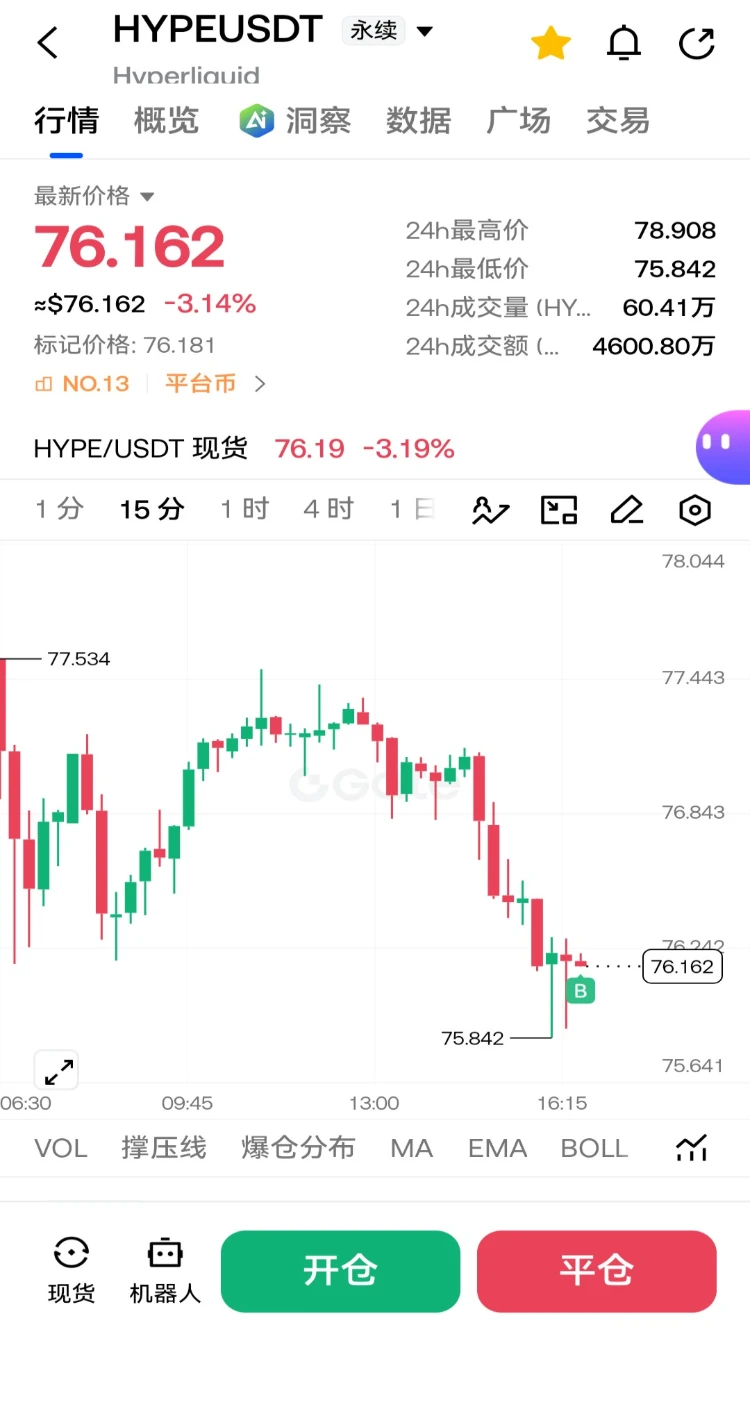
Why did 牛来 (Bull Comes) get so bullish? Because it charged straight into the pump — now it's gassed.
$牛来 ‌牛来/USDT is up huge, current price 0.10419, rejecting near 0.11478 high, with support at 0.0950 and 0.0840.
📉 Short (rejection from resistance)
Entry: 0.105 – 0.107
TP1: 0.098
TP2: 0.092
TP3: 0.086
SL: 0.112
📈 Long (pullback to support)
Entry: 0.085 – 0.088
TP1: 0.095
TP2: 0.102
TP3: 0.108
SL: 0.080
🔑 Key Levels
Resistance: 0.11478 (24h high) / 0.112
Support: 0.098 / 0.092 / 0.085 / 0.04852 (24h low)
⚠️ Not financial advice. DYOR and manage your risk.
牛来126.03%
post-image
  • Reward
  • Comment
  • Repost
  • Share
#牛来
NIULAI/USDT: A Meme Coin Explosion That Has Entered a High-Risk Price Discovery Phase
NIULAI/USDT has delivered an extraordinary momentum move, with spot price trading around 0.11939, up approximately 131.33%, while the perpetual contract is near 0.11912, gaining more than 127% on the day. The token has already printed a 24-hour high of 0.12125 against a low of 0.04849, producing an enormous trading range and confirming just how aggressively speculative this market has become. With roughly 59.33M NIULAI in 24-hour volume and about 5.60M USDT in turnover, the current move is clearly being
牛来126.03%
ZHIPU AI-6.03%
post-image
NIULAI
NIULAI牛来
MC:$0.1Holders:1
0.00%
  • Reward
  • Comment
  • Repost
  • Share
#Gate7DayNetInflowsTop3
Gate 7-Day Net Inflows: The Top 3 Assets Pulling Capital This Week
Net inflow is one of the most honest signals in crypto: it measures the funds that actually arrived on an exchange minus the funds that left, usually over a fixed window. On Gate, the past seven days (August 23 to August 30, 2026) have produced a clear and fascinating picture. When an asset shows a positive net inflow, money is landing on the platform and staying there, ready to trade, stake, or deploy. When it turns negative, coins are moving out, often to self-custody wallets, DeFi, or other venues. P
post-image
post-image
  • Reward
  • Comment
  • Repost
  • Share
Felipe Luís’s perfect start—can the new Monaco coach’s magic continue?
Guys, there’s a stat in this Ligue 1 clash that really caught my attention—Monaco’s new coach Felipe Luís has led the team to three wins in three official matches so far.
Since the Brazilian coach took over, Monaco have looked like a completely different team. They kicked off the new league season with a win over Le Havre last round. Monaco have won their league opener in each of the past five seasons. Their home win rate is 58.82%, compared with just 35.29% away—a typical “home powerhouse.”
What about Marseille? They demol
View Original
post-image
post-image
  • Reward
  • Comment
  • Repost
  • Share
#GateStockInsightsChallenge +#NVDA
NVIDIA (NVDA) Market Analysis — Current Price $217.40 | Bullish Recovery Setup With Key Resistance Ahead
NVIDIA is trading around $217.40, and the technical picture is currently mixed but still constructive on the medium-term trend. After the recent earnings catalyst, NVDA showed strong upside momentum, but the stock then faced heavy profit-taking as the broader technology sector reacted to higher Treasury yields and renewed expectations around interest rates.
Recent market data shows NVDA closing near $217.55, while technical indicators are pointing to a b
NVDA-4.58%
post-image
post-image
  • Reward
  • 3
  • Repost
  • Share
ThisIsTranslateContent::
Just go for it 👊
View More
#Gate7DayNetInflowsTop3: Where Smart Money Is Flowing
In crypto, price tells you what already happened. Net inflow tells you what’s about to happen.
Net inflow is simply total inflows minus total outflows. When a coin shows positive net inflow, real capital is choosing to park there — not just trading through, but staying. Price can be pushed on thin volume, but sustained net inflows reflect genuine conviction.
Gate.io has been crushing this metric. According to DeFiLlama data, Gate recorded approximately $273 million in 7-day net inflows, ranking among the top 3 centralized exchanges globall
BTC1.51%
ETH1.59%
SOL3.02%
XAUUSD-3.18%
post-image
  • Reward
  • Comment
  • Repost
  • Share
Load More

Join 40 M users in our growing community

⚡️ Join 40 M users in the crypto craze discussion
💬 Engage with your favorite top creators
👍 See what interests you
  • Pinned