
Square
Following
Hot
News
Profile
Share your thoughts
placeholder
Article
I Know People Are Tired Of Me Saying This But Today Was Another All Time High For Hunting!
post-image
🐋 WHALE WATCH : Ripple and DriveWealth partnered on RLUSD settlement via the $XRP Ledger covering cross border payments custody and prime brokerage.
One integration touching the full stack of how institutions move money globally.
post-image
RLUSD+0.01%
XRP-3.05%
$WAL A huge upper wick has formed! All I can say is: short without thinking! This trend is about to cascade! Target: 0.049. If you have no position, short at the current price! Just wait for the cascade and feast!
post-image
WAL+39.45%
$SKHY Long Fights a Failed Recovery Momentum Already Rolling Back Over
Pair: $SKHY /USDT
Direction: LONG
Entry Zone: 147.68
Take Profit:
- TP1: 151.98 +2.9%
- TP2: 154.84 +4.9%
- TP3: 159.14 +7.8%
Stop Loss: 141.95
Chart Structure:
- SKHY declined from ~172 to a low near 148, staged a recovery that peaked around 157 (reclaiming MA7/MA25 briefly), then rolled over and declined steadily back down to current price, right near the original low
- Price is now sitting below the failed recovery high, with MA7/MA25 both turning down again as resistance overhead
- RSI(14) climbed from the low-20s
SKHY-11.35%
For the first time, I am also investing in US stocks and doing analysis
Lets start with $NVDA
Growth is broadening beyond hyperscalers into sovereign AI, enterprises, and "physical AI" (robotics/AV via Jetson Thor, DRIVE Hyperion, GR00T). The Rubin platform roadmap and multiyear deals (Meta, AWS, Google Cloud) underpin the forward numbers.
Risks: customer concentration, custom ASIC competition, China export policy, and the financing-deal overhang.
Technical Analysis

Trend: Uptrend intact — price is +23% YTD and +27% over 1 year, and sits above the 50-day (222.9) and 200-day (202.2) averag
post-image
NVDA-1.58%
Try going long on $BTC
. Entry range: 81,135.4 - 81,543.1TP1: 83,163.8TP2: 84,623.4Stop-loss: 80,324.0 Buying surged as the price pulled back to the bottom—it's time for a rebound and a test of the moving averages! Please note: If the 81,401 support level fails to hold, it could trigger a continued downtrend. Don't go all-in, guys. Position size should suit your account. It's time to go long! 👇👇👇 Also monitor $NEAR and $ZEREBRO .
post-image
ZEREBRO+39.99%
ETH is currently at 2414, in the key 2400–2420 support zone. On the 4H timeframe, EMA8/21/50 are bearishly aligned, with RSI around 35. Short-term momentum is bearish but not extremely oversold. 2400 is a round-number level and a previous consolidation platform, while 2390 is the neckline of the daily head-and-shoulders pattern. The bulls will defend this area, but until ETH reclaims 2500, all rebounds should be treated as relief bounces.
On the macro front, U.S. Treasury yields have been relatively strong recently, weighing on risk assets. ETH ETF flows remain unstable, while low on-chain gas
ETH-3.37%
BTC-1.87%
Still long on $ETH To Be Clear
Just using another account to facilitate the trade.
Im not going to miss out on gains! 😉
Copy trading now available on AlphaX!
Will look into to this further tomorrow.
FN Everyone!
🔥🐶🔥
ETH-3.42%
Real-Time CPI Monitoring
live-cover
LIVE994
Good morning, $DOGE family! ☕️🤝🐕
Gm C X 🫡📈
Happy Thursday! ☀️✌️
Dogecoin to the moon! 🚀🌑🐪
post-image
DOGE-3.40%
You were probably all waiting for the CPI at 8.30 last night, right?🤭
I opened an ETH position at 2518 during the day and waited for it to fall📉until I closed it at 2411 this morning. The low was again above 2400, with this wave only dropping to 2402. Wow, this is the third wave to stop just above 2400. I have to say, ETH is still strong. If it rebounds here and breaks above 2550, the upward channel will open. Whether you’re trading spot or using low leverage, those who haven’t entered yet, hurry and enter at 2400! Let’s look forward to 3000 together.$ETH
post-image
ETH-3.37%
If the monthly chart touches the MA20, then I guess Koreans will really be flying 😂
post-image
TOTAL 3 I hope TOTAL 3 Surprises Bears .
5 Resistance TESTS on the trendline from 2021 to 2025.
2026: We've tested 200MA( Redline) ,Broken through 50MA and now retested (Greenline) 50MA.
I expect a Continuation to the trendline to test the RESISTANCE. By then ALTS SHOULD PUMP
#美国9月CPI即将公布
U.S. SEPTEMBER CPI: INFLATION SURPRISE, FED PRESSURE, AND WHAT COMES NEXT FOR CRYPTO
The U.S. September Consumer Price Index (CPI) has delivered a stronger inflation reading than markets expected. Instead of easing, inflation accelerated, raising fresh questions about the Federal Reserve’s next move and the direction of Bitcoin, Ethereum, stocks, gold, and the U.S. dollar.
For me, this is more than another economic headline. It is a reminder that one major economic release can change market expectations within minutes, especially when traders are already sensitive to interest rat
BTC-1.88%
ETH-3.42%
GAS-2.93%
FUEL-1.31%
  • 3
  • 1
Michael Saylor Says Bitcoin's Current Rally Is Just the Beginning
Michael Saylor, founder of Strategy, says Bitcoin has broken out of its downtrend and entered a new bull market. In a Bloomberg interview, Saylor explained that BTC dipped briefly below the 200-week moving average before recovering roughly 25%. He sees Bitcoin regaining support from long-term technical indicators as a sign the market is entering a new upward phase.
Saylor believes the recent rebound is more than a short-term bounce — it could be the early stage of a larger bullish cycle.
⚠️ Personal market analysis only. NFA — m
post-image
BTC-1.88%
$TTD look the market cap easy x10 🚀
post-image
TTD-65.57%
MARKET OVERVIEW
live-cover
LIVE1,186
Go long on $MU
. Entry range: 886.25 - 898.76Take-profit zone: 931.45 - 962.61Stop-loss: 859.66When a pullback appears at the slaughterhouse door, people buy in. MU has rebounded strongly from the low, textbook style! Please note: After the short-term rebound, the macro downtrend may continue. Don’t go all in, brothers. Position size should suit your account. Follow the uptrend. 👇👇👇 Trade together with $ZEREBRO and $NEAR .
post-image
NEAR-5.71%
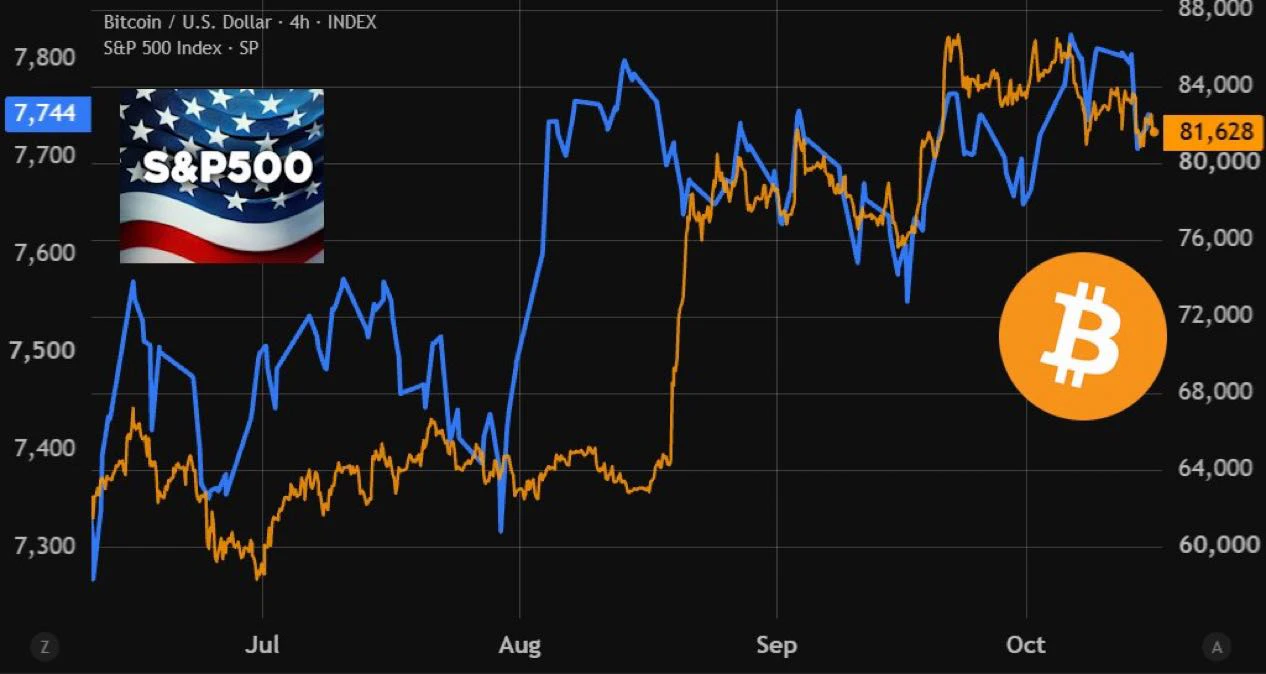
10.15 BTC intraday market
Last night, the market moved sharply downward following the release of the CPI data; overall, the market still favors shorting at high levels.
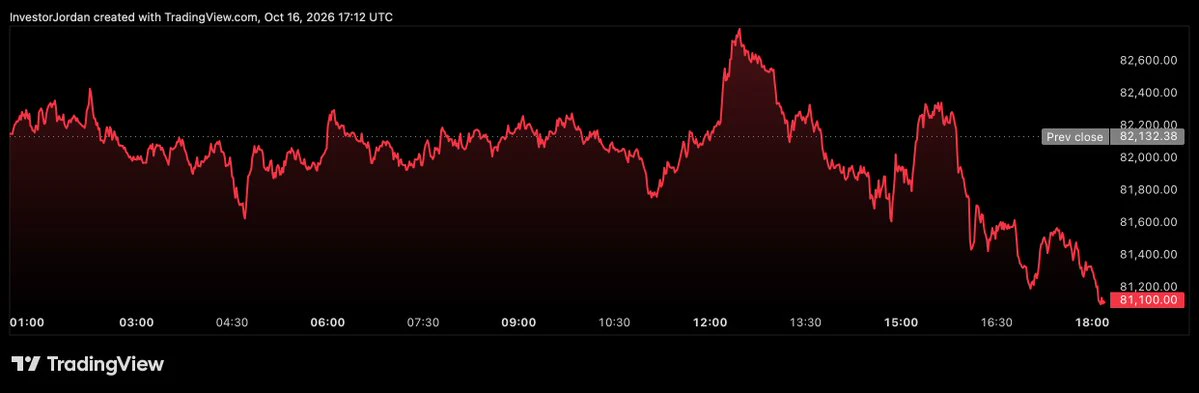
Bitcoin needs to complete its correction on the 2-day chart; a rebound is underway on the daily timeframe. The 81,200 level has already been retested three times; after the large bearish candle on the 12-hour chart; underwater rebounds on the 4/6/8-hour timeframes
The 15/30-minute timeframes are bottoming; pay attention to the strength of the intraday rebound
Upside resistance: 82578 83624 84433
Downside support: 81200-8080
post-image
BTC-1.87%
Load More

Join 40 M users in our growing community

⚡️ Join 40 M users in the crypto craze discussion

💬 Engage with your favorite top creators

👍 See what interests you

Trending Topics

USSeptemberCPITopsEstimates

36.18k Views2.51k Discussing

US September CPI rose 3.7% YoY, above the 3.6% estimate; core CPI rose 2.6%, also above the 2.5% estimate. With inflation topping forecasts across the board, how will rate hike expectations shift? How will BTC react? Share your view.

DrLinHanSpeaksAtOxfordUnion

135.19k Views1.85k Discussing

GateWCTCS9GlobalTradingCompetition

37.49k Views6.16k Discussing

View More