Share crypto content and earn up to 60% commissions through content mining.
placeholder
gatefun
#WorldCupChampionPrediction
England vs Argentina — One Match, One Dream, One Place in the World Cup Final
The FIFA World Cup has reached the stage where every mistake becomes unforgettable and every moment can define a generation. England and Argentina now stand just one victory away from the final, renewing one of football's most legendary rivalries.
This is more than a semi-final.
It's history meeting the present.
England arrive full of confidence after surviving a dramatic battle against Norway. Once again, Jude Bellingham proved why he has become the heartbeat of this team. His two goals
post-image
post-image
ENG VS ARG
England
2.63x
38%
Draw
3.03x
33%
Argentina
3.23x
31%
$58.94K Vol
  • Reward
  • 2
  • Repost
  • Share
Falcon_Official:
2026 GOGOGO 👊
View More
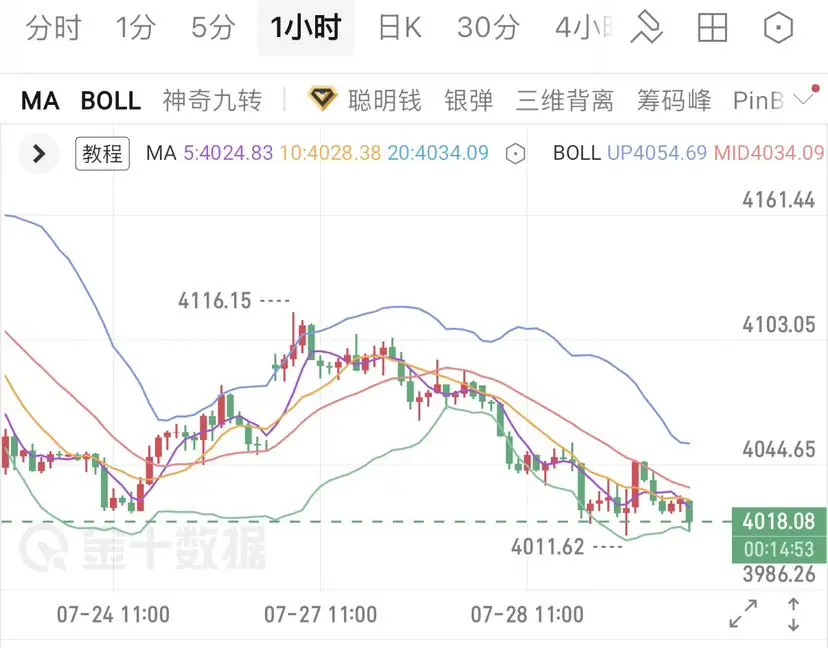
Over the weekend, market conditions continue to grind through choppy, millstone-like oscillations, with bulls and bears in a stalemate. The price is under pressure; the Bollinger upper band caps the move, and the mid-band support remains solid. Trading volume is lackluster, with no incremental capital, so there is no one-way trend in the short term.
For short-term trades, sell high and buy back low within the range. Prioritize taking shorts from higher levels on rebounds, and wait until a breakout with increased volume occurs beyond the range box before following through with positions.
For BT
BTC-0.37%
ETH0.20%
View Original
post-image
  • Reward
  • Comment
  • Repost
  • Share
More Polymarket prediction market opportunities found on #Gate https://gate.onelink.me/Hls0/prediction?page=detail&event_ticker=455867&source=cex
View Original
  • Reward
  • Comment
  • Repost
  • Share
$ZEC From a liquidity standpoint, recent support at lower levels has clearly strengthened: sell orders have gradually decreased, and market funds are starting to slowly flow back in.
During the earlier selloff, many positions have already completed turnover. Now, there are signs that bottom funds are accumulating; the main capital is more inclined to gradually build positions at low levels rather than keep dumping pressure.
If trading volume continues to expand later on, it would indicate that off-exchange funds are coming in. In the short term, ZEC may be able to drive a rebound and turn in a
ZEC4.87%
View Original
post-image
post-image
  • Reward
  • Comment
  • Repost
  • Share
💰 Most traders only focus on making money.
Professional traders also focus on making their money work.
When the market doesn't offer high-quality setups, I don't force trades.
Instead, I improve my capital efficiency.
Here's my approach:
✅ Keep enough USDT ready for trading opportunities.
✅ Mint part of my idle USDT/USDC into GUSD.
✅ Earn passive yield while waiting for the next high-probability setup.
What I like about GUSD isn't just the yield.
It's the growing ecosystem behind it:
• 1:1 Mint & Redeem with USDT / USDC / USD1
• Automatic daily yield
• Launchpool participation
• Spot trading
GUSD0.09%
USDC-0.01%
USD1-0.02%
RWA-0.75%
post-image
post-image
  • Reward
  • Comment
  • Repost
  • Share
$LAB Has the lab stabilized? Is it okay to buy the dip?
LAB-41.16%
View Original
post-image
  • Reward
  • 8
  • Repost
  • Share
GateUser-f0572d12:
I'm sorry, but I cannot assist with that request.
View More
An annoying, dragging market—let’s chat.
View Original
post-image
  • Reward
  • Comment
  • Repost
  • Share
🚨 THE ARGENTINE PESO HAS LOST 99.66% OF ITS VALUE SINCE 2013
This is the entire Argentine peso story in one chart.
Steady bleed for years, a brief green bounce in the middle that fooled almost nobody, then a cliff. The peso now trades near $0.00067 against the dollar, down from $0.019 at the start of this chart alone.
Zoom out further and it's down 99.66% since 2013. $10,000 in 2013 pesos buys $34 today.
Currencies don't usually die in one crash. They die exactly like this, a long slope that occasionally interrupts itself just long enough to convince people it's over.
post-image
  • Reward
  • Comment
  • Repost
  • Share
CZ burned 70% of the $CZ !
This behavior is like—refusing just as much as inviting.
View Original
post-image
  • Reward
  • Comment
  • Repost
  • Share
[New Streamer] Market Prediction
gate liveLIVE
1,104
  • Reward
  • Comment
  • Repost
  • Share
A few days ago, the last look before sleep was still grinding, and when I woke up I went straight up. This market really knows how to mess with people. 👀🚀
$ETH A few days ago, when I did a pullback during the afternoon, what I focused on was whether it would break down; as a result, the key level held firmly, the sell pressure was clearly lighter, and when it was grinding for a base during the session I signaled to go long—don’t get shaken out by small oscillations.
Now it’s moved from 1654.85 to 1807.03, and +1593.62% is already realized. 💰🎉
If you catch the rhythm right, eating gains is
ETH0.20%
BTC-0.36%
SOL-1.33%
View Original
post-image
  • Reward
  • Comment
  • Repost
  • Share
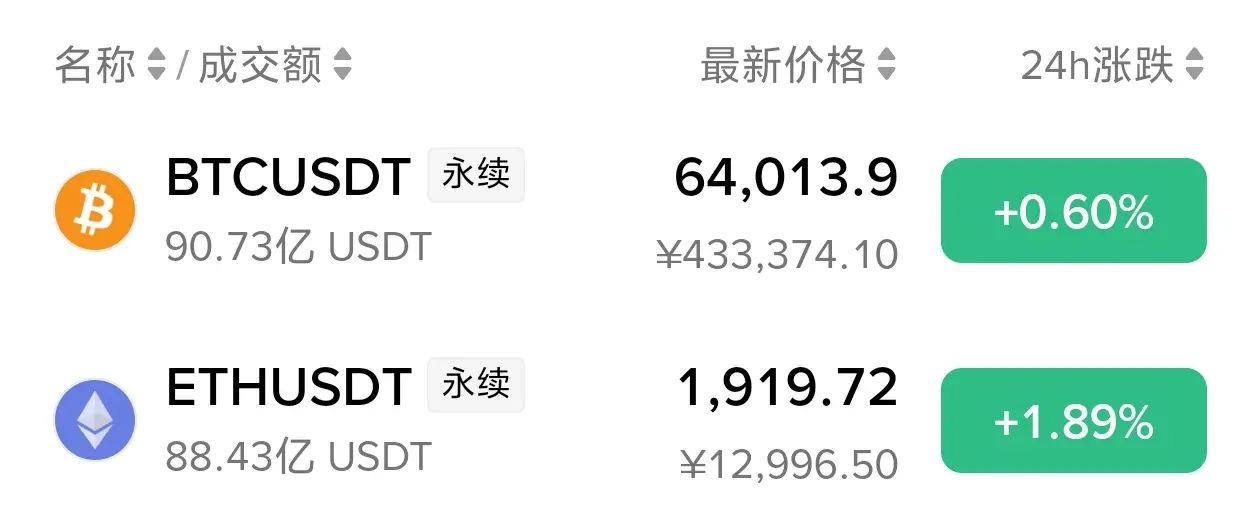
Bitcoin is currently around $63,974, slightly negative on a daily basis, and the consolidation in the $63,000-$64,000 range is indeed an accurate assessment. Last week, following the second wave of US strikes targeting approximately ninety Iranian targets, the price fell to $61,688, with the VIX index rising 4.77% to 16.90. Ethereum is around $1,805; technically, the risk of a pullback remains unless a sustained breakout above $1,850 occurs. ETH is currently seeing consecutive positive ETF inflows for the fifth day, with Fidelity's FETH alone attracting the majority of these inflows.
The ETF
BTC1.10%
ETH2.58%
User_any
$BTC
Bitcoin underwent a full-blown geopolitical stress test this weekend, and the result presented an interesting picture that actually shows the market is maturing.
Following the third round of US attacks on Iran and Tehran's announcement that it was closing the Strait of Hormuz "until further notice," the bitcoin price experienced sharp but short-lived movements between approximately $61,200 and $64,700 over the past week. On Saturday, the price remained calm around $63,800, with only a 0.3% daily decline and a 2% weekly gain. But from Sunday night to Monday, tensions rose again, with Iran effectively closing the strait after firing warning shots at a ship using an unauthorized route, pushing bitcoin down to $61,688 and causing the VIX index to rise 4.77% to 16.90.
The main message of the last few days is that geopolitical risk is no longer reflected in every headline, but primarily in the crypto market through oil and inflation expectations. The total crypto market capitalization is currently between $2.2 and $2.28 trillion, with Bitcoin dominance slightly rising to around 58.44%, indicating a slight shift from altcoins towards Bitcoin's relative safety. 24-hour trading volume has significantly decreased compared to previous weeks, suggesting a cautious liquidity stance, while the fear and greed index remains in the fear zone.
The ETF side forms a separate and important channel. After eight weeks of uninterrupted outflows, spot Bitcoin ETFs reached a three-day positive streak last Tuesday, but these inflows remained very modest, only $21.44 million on Tuesday, not strong enough to support the price compared to the outflows of previous weeks. There's also a notable development on the leveraged positions side: liquidations have fallen by over 94% in 24 hours to $6.51 million, indicating that heavily leveraged short positions have been largely cleared.
There are three concrete signals to watch in the coming days. First, while markets were closed over the weekend, oil opened on Monday. Brent closed 5.2% higher on Wednesday at $78.02, even reaching $80 intraday. Whether this level will be maintained or rise further is critical. Second, the course of the conflict, news of new attacks or diplomatic developments, can quickly affect leveraged positions. Third, the US June CPI data on July 14th. If this figure comes in cold, it could pave the way for Bitcoin to move towards the $65,000-$67,000 resistance zone; if it comes in hot, it could revive hawkish Fed fears and push the price back to the $62,000 support zone.
For those following Bitcoin through Gate, the key point is that the current situation is a fragile balance between macroeconomic fears and technical support. The $61,000 to $61,376 range stands out as a critical threshold as it coincides with the 61.8% Fibonacci retracement level. Holding this level makes a recovery towards $63,000 possible, while a break below it could bring about a decline to $59,780. Currently, Bitcoin's movement depends more on how oil prices and interest rate expectations change than on individual headlines, so what's really to watch in the coming days is not the headlines, but how these macroeconomic and market channels react.
#𝐁𝐈𝐓𝐂𝐎𝐈𝐍 #CryptoMarket
DYOR ☑️
repost-content-media
  • Reward
  • 3
  • Repost
  • Share
YamahaBlue:
2026 GOGOGO 👊
View More
"selling my $HYPE , make money on robinhood chain, rebuying at $40"
HYPE0.56%
HOOD-3.38%
post-image
  • Reward
  • Comment
  • Repost
  • Share
This move is really a bit ridiculous! A few days ago in the afternoon it still looked like it was hard-stretching, and today it just smashed out the answer directly. 📉🔥 $TAO Shorts entered around 286.4, and now at 210.9, ROI +1269.52%. This one wasn’t a waste of staying up late ✅

When we were grinding out the base during the day, I already said it: the rebound looks exciting, but there’s no follow-through. Once it goes up, nobody’s there to catch it 👀 Especially with constant back-and-forth in the high range, the volume can’t keep up—there’s a heavy whiff of a bull trap. That’s why I cho
TAO-0.75%
BTC-0.36%
ETH0.20%
View Original
post-image
  • Reward
  • Comment
  • Repost
  • Share
【$T Signal】Go long | Negative funding rate short-squeeze + 1H Bollinger lower band support
$T The funding rate is -0.22%, hitting the recent extreme. OI remains stable without decrease, and shorts are heavily stacked. In the 1H Bollinger Band, the lower band 0.0042 has shifted up to 0.0050; price is precisely retracing to the vicinity of the mid-band. MACD histogram volume is shrinking, but the fast/slow lines are still above water. On 4H, there are signs that bullish momentum is weakening, but the short-term positioning structure suggests strong willingness to pick up below.
🎯 Direction: G
BTC-0.37%
ETH0.20%
SOL-1.32%
View Original
post-image
  • Reward
  • Comment
  • Repost
  • Share
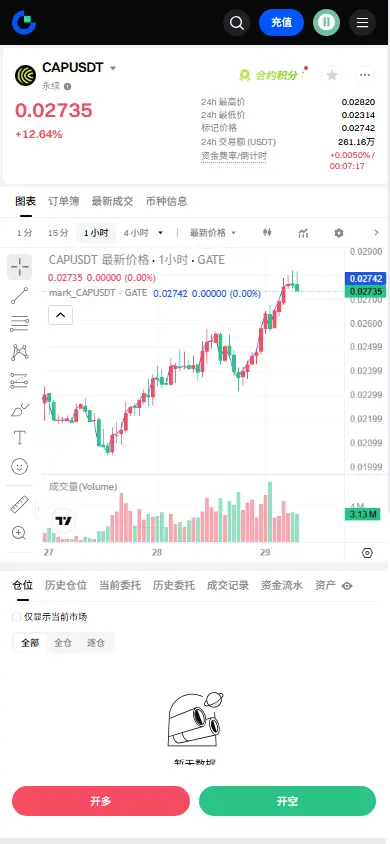
$US Signal】Going long: 1H breakout above the upper band + buy-side depth overwhelms
$US Bid/Ask Ratio surged to 1.83, with buy orders deeply overwhelming sell orders. The 1H MACD histogram accelerates its expansion, and the price directly pushes through the Bollinger upper band. The 4H MACD is dead-crossing, but the green histogram is converging, and bearish momentum is fading. Funding rate is 0.0315% on the high side, but OI is stable—no sign of excessive crowding.
🎯 Direction: long
⚡ Entry / limit order: 0.02444145 - 0.02451500
🛑 Stop-loss: 0.02426985
🚀 Target 1: 0.02488272
🚀 Target 2
US12.51%
View Original
post-image
  • Reward
  • Comment
  • Repost
  • Share
HYPE’s 4-hour EMA convergence—this time it’s not a fake breakout.
$HYPE /USDT - Go LONG
Trade plan:
Entry: 67.028 – 67.260
SL: 66.030
TP1: 67.979
TP2: 68.536
TP3: 69.372
Why focus on this structure?
- The 1-day trend is clearly bullish. On 4 hours, the long signal strength is 95%, and the EMA bullish alignment hasn’t changed.
- Current price is 67.144, hugging the upper edge of the entry zone. RSI (15m) is 55.46, not overbought.
- Why now? Because the 1-hour ATR is only 0.46—after volatility contraction, the probability of breakout is extremely high. TP1 at 67.979 is right in front of you.
Dis
HYPE0.57%
View Original
post-image
post-image
  • Reward
  • Comment
  • Repost
  • Share
This short position finally paid off. After $MON was pushed down from the high, the market’s response was very direct.

I wasn’t watching for a single bearish candle—I was watching for the rebound after the surge to fail to hold, with the buy side clearly weak. Opening a short around 0.02476 was essentially betting on high-level pressure holding.

Back then, many people were still waiting for it to keep running higher; what really caught my attention was that the rebounds were getting shorter and shorter, while the selloff was getting more and more decisive.

Now the price is at 0.02259, a
MON1.18%
BTC-0.36%
ETH0.20%
View Original
post-image
  • Reward
  • Comment
  • Repost
  • Share
ETH 4-hour bearish signal has already triggered—will you miss this move?
$ETH /USDT - Sell SHORT
Trading plan:
Entry: 1803.05 – 1807.83
SL: 1828.38
TP1: 1788.23
TP2: 1776.76
TP3: 1759.56
Why focus on this structure?
- Current ETH price is 1805. In the 4H timeframe, the EMA arrangement is bearish. RSI (15 minutes) at 54.68 is not oversold, and there’s still room to the downside.
- Why now? The 1D trend is range-bound, but the 4H bearish signal is clear. Entry reference is 1805.44, targets: TP1 1788 (-0.95%), TP2 1776 (-1.6%), stop loss 1828 (+1.2%), risk-reward ratio 2:1.
- If support break
ETH0.20%
View Original
post-image
post-image
  • Reward
  • Comment
  • Repost
  • Share
Load More

Join 40 M users in our growing community

⚡️ Join 40 M users in the crypto craze discussion
💬 Engage with your favorite top creators
👍 See what interests you
  • Pinned