
Square
Following
Hot
News
Notifications
Profile
Share your thoughts
placeholder
Article
$BTC
BTC View Update:
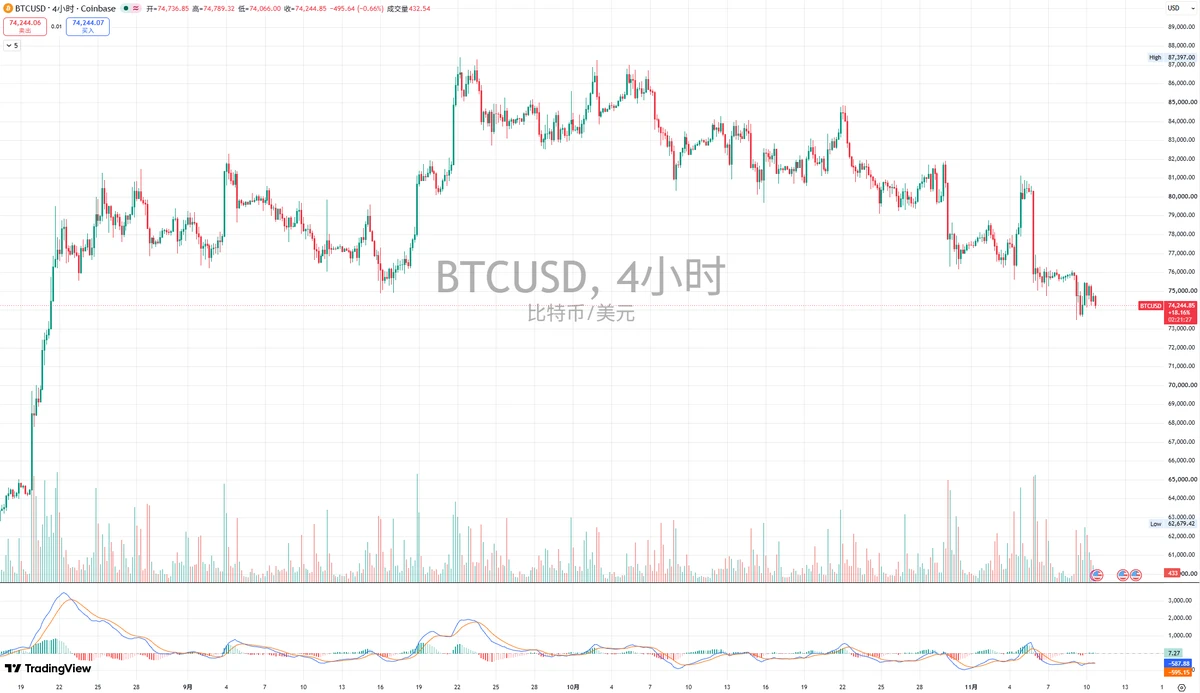
After the decline on the lower time frame, BTC has been consolidating. The rebound structure isn’t very strong, so there may still be downside risk. I’m also sticking with my previous outlook and will keep watching how price reacts at liquidity levels.
Trading plan: I opened an initial position at 72888. If it drops 2,000 points, I’ll add to the position. I plan to hold for the medium term and ride a major rebound or reversal!
post-image
BTC-0.67%
I can't make sense of gold, so I'll take some time to reflect. Taking a break for a while
post-image
GLDX-0.40%
PAXG+0.37%
Trenches
PIEVERSE
P
bade
b
PIEVERSE
0x0e...25a9
Market Cap
$.
Change
.
24h Vol
$.
Holders
.
牛逼
牛
bade
b
牛逼
0x96...7777
Market Cap
$.
Change
.
24h Vol
$.
Holders
.
ON
O
bade
b
ON
0x0e...1d48
Market Cap
$.
Change
.
24h Vol
$.
Holders
.
STONK
S
bade
b
STONK
6GmA...UNgx
Market Cap
$.
Change
.
24h Vol
$.
Holders
.
FLOAT
F
bade
b
FLOAT
Bv1a...BMmr
Market Cap
$.
Change
.
24h Vol
$.
Holders
.
Bulls Are Trapped: $ONDO USDT Short Setup Is Ready to Go

$ONDO /USDT

Direction: SHORT

Entry Zone: 0.3697000

Take-Profit Targets
🔹 TP1: 0.3594530
🔹 TP2: 0.3526217
🔹 TP3: 0.3423748

🛑 Stop-Loss: 0.3833626

$ONDO ‌
ONDO-0.30%
⏳ A moment that became crypto history! 🚀

On this day in 2021, Bitcoin reached an incredible new all-time high of $69,000 during the historic bull run. ₿

Five years later, that moment still reminds us why Bitcoin changed the financial world. From massive rallies to brutal corrections, BTC has given the crypto community a journey to remember.

Who remembers the excitement of the $69K milestone? 👀🔥

$BTC $GT $XRP ‌$INIT $ZEC #ShareWeekly #AnthropicLaunchesNasdaqIPORoadshow #StakeOnLaunchpoolToShare450KVLX #AVAXJumps6.4%OnNYSENews
post-image
BTC-0.65%
GT-2.24%
XRP-1.15%
INIT-1.74%
ZEC+1.29%
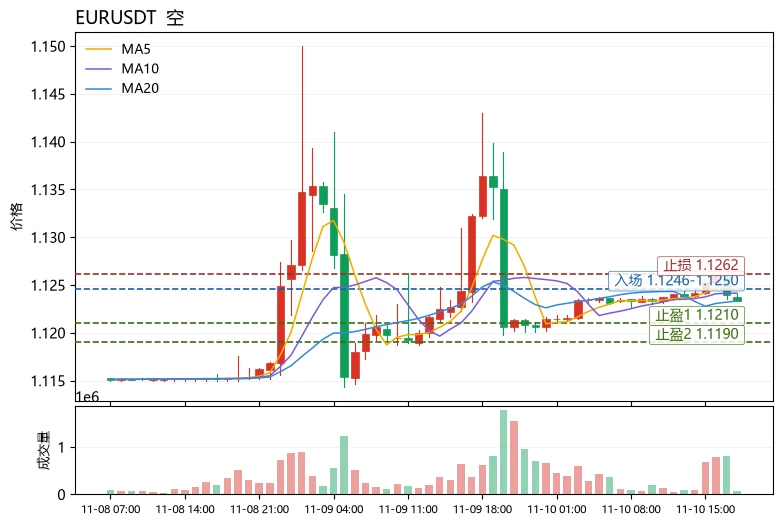
The most unusual detail in today's market is that $EUR 's MA5 (1.12464) is still above its MA20 (1.12333), yet the price has fallen to 1.1233, down 1.38% over 24h. The moving averages have not yet formed a death cross, but the price has already lost the MA20—a typical case of “structure lagging behind price,” with the bullish structure passively breaking down. The MACD histogram remains bearish at -7.58e-06, RSI is only 49.0 with no oversold cushion, and the Bollinger Bands have narrowed to [1.12075, 1.12592], with a range of about 2.08% over 30 candlesticks. After volatility compression, the
post-image
QNT+4.79%
NEAR+1.17%
#Gate股票畅聊季 AI Tech Stocks: The Exception and the Favorite—Why I’m Choosing AMD!

I’m bullish on AMD because it has had the strongest buying support in this rebound and has performance to back it up in its financial reports.
Data center business doubles: In the third quarter, the data center business grew about 2x, prompting Oppenheimer to upgrade its rating, with a price target of $600[6].
Lands a Google order: Google Cloud’s next-generation TPU 8tx uses AMD EPYC on the host side, giving AMD a visible and measurable share.
Nvidia leaves an opening: Capital is flowing out of Nvidia and into com
AMD+13.35%
  • 4
What Is SHAP? How Can We Explain Why a Machine Learning Model Gives a Bullish or Bearish Prediction?

In crypto quantitative trading, machine learning models may use features such as price momentum, trading volume, volatility, and funding rates to predict future movements. But when a model gives a bullish or bearish prediction, that does not mean traders know why it made that call. SHAP is a method for helping explain model predictions by analyzing how different features contribute to an individual prediction.

First, what is SHAP?

SHAP is based on the idea of Shapley values, which allocate c
post-image
BTC-0.67%
What Are ROC Curves and AUC? How Can You Tell Whether a Price-Movement Prediction Model Can Truly Discriminate?

In cryptocurrency quantitative trading, you cannot judge whether a model is effective by accuracy alone. Suppose BTC spends most of the time without a sharp rise: a model that always predicts a price drop could still achieve seemingly decent accuracy, yet fail to identify genuine opportunities to buy. ROC curves and AUC can help us evaluate a model’s ability to distinguish between different outcomes.

First, what is an ROC curve?

An ROC curve compares the true positive rate with th
post-image
BTC-0.67%
LIVE TA: Bitcoin Morning Price Discovery
RAW ORGANIC NO-PESTICIDES PURE HONEST & EFFECTIVE TA
In minutes LIVE for members
#liveta #bitcoin #livestream
post-image
BTC-0.67%
Everyone, the midday gold spot order has already taken profit. No need for all the twists and turns—you can feel how steady it is $XAUT #Gate全球合规版图扩展
XAUT+0.34%
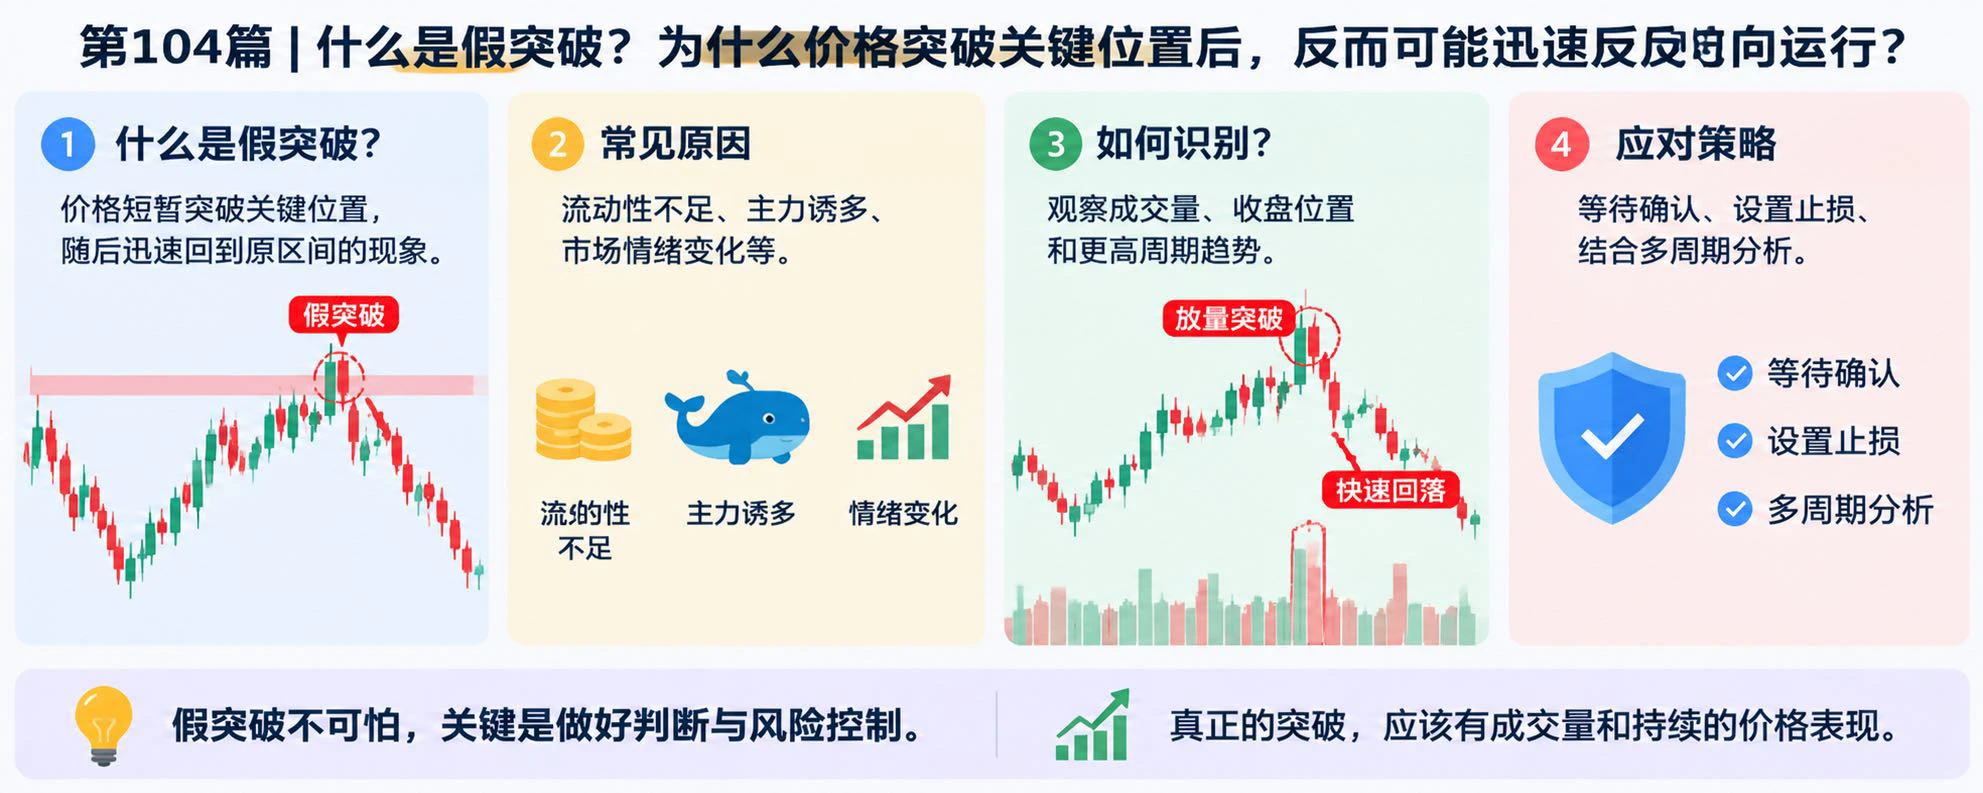
What is a retest confirmation? Why can a retest after a breakout sometimes be an opportunity and sometimes a reversal signal?

In cryptocurrency trading, after the price breaks through a key resistance level, it may pull back toward the former resistance area, find support again, and continue rising. But it may also quickly fall after the breakout and return to its previous trading range. That is why retest confirmation is an important aspect of breakout trading worth studying.

First, what is retest confirmation?

After the price breaks through a resistance level, if it returns to test the ar
post-image
market update
live-cover
LIVE4,856
What Is SHAP? How Can We Explain Why a Machine Learning Model Makes a Bullish or Bearish Prediction?

In crypto quantitative trading, machine learning models may predict future price movements based on features such as price momentum, trading volume, volatility, and funding rates. But when a model predicts a bullish or bearish outcome, that does not mean traders know why it made that prediction. SHAP is a method for explaining model predictions by analyzing how different features contribute to an individual prediction.

First, what is SHAP?

SHAP is based on the idea of Shapley values, which a
post-image
BTC-0.67%
What Is the Brier Score? How Can Mathematical Methods Evaluate the Quality of a Trading Model’s Probability Predictions?

In crypto quantitative trading, even if a model often correctly predicts whether prices will rise or fall, that does not mean the probabilities it gives are reliable. For example, if a model predicts a 90% chance that BTC will rise, but prices rise only 60% of the time after similar predictions, it may be overconfident. The Brier score can help us evaluate the error between probability predictions and actual outcomes.

First, what is the Brier score?

For binary predictions
post-image
BTC-0.67%
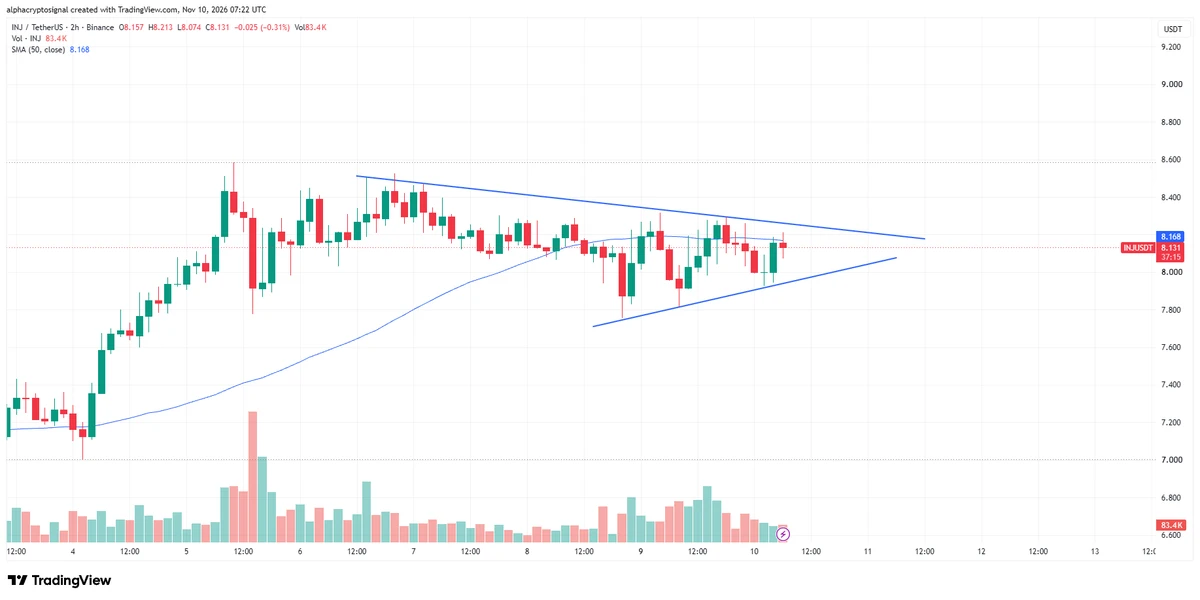
#INJ LTF Analysis:
$INJ is consolidating inside a symmetrical triangle on the 2H timeframe, with price getting squeezed between converging trendlines. The structure is approaching its apex, suggesting a potential breakout is getting closer.
Looking for an upside breakout with confirmation. A clean move above the upper trendline could open the door for further upside. Keeping $INJ on the radar.
post-image
INJ-1.67%
What Are Precision and Recall? Why Should Trading Models Not Simply Aim for More Bullish Signals?

In crypto quantitative trading, a model may generate a large number of bullish signals every day, but more signals do not necessarily mean more profitable opportunities. If a model frequently misclassifies downtrends as uptrends, traders may repeatedly hit their stop-losses. Precision and recall measure a model’s ability to identify bullish opportunities from different perspectives.

First, what is precision?

Precision is the proportion of samples actually followed by an upward move among all th
post-image
🚨 Bitcoin & Ethereum Lose Key Psychological Levels — Is More Downside Coming?

The crypto market is facing renewed selling pressure. BTC has dropped below $75,000, while ETH has slipped under $2,100 as expectations of further Fed rate hikes weigh on investor sentiment.

But here's what matters now: the reaction at these levels.

🔍 Key things I'm monitoring:

- BTC: Can buyers reclaim $75K, or will sellers push toward lower support?
- ETH: Losing $2,100 puts the next recovery attempt under pressure.
- Fed policy: Higher interest rates could keep liquidity conditions tight and limit demand for
BTC-0.67%
ETH-1.26%
The biggest enemy is not the candlestick chart, but the fear within you. $BTC
Absolute command of the trend and a precise grasp of market sentiment. $ETH
Many people lose money because they give up in the darkness before dawn, right before the main rally. $JCT
Weather the bull traps and wait patiently for the flowers to bloom; that is the composure of a top trader.
BTC-0.67%
ETH-1.26%
No more ads after scolding
Haha
Load More

Join 40 M users in our growing community

⚡️ Join 40 M users in the crypto craze discussion

💬 Engage with your favorite top creators

👍 See what interests you

Trending Topics

GateGlobalComplianceExpansion

167 Views196 Discussing

Gate continues to expand its global compliance footprint, now covering 81 regulated jurisdictions across Europe, North America, Asia, and Oceania. From MiCA and U.S. state-level MTLs to Japan’s FSA, Dubai, and Australia-related regulatory approvals, global exchanges are entering a new stage of compliance competition. Do you think regulatory strength will become as important as products and liquidity for exchanges in the future?

USCPIDataIncoming

55.02k Views2.29k Discussing

USIranTalksShowNewProgress

10.06k Views1.29k Discussing

View More