
Share your thoughts
placeholder
Article
#SenateReleasesNewCLARITYAct
A major moment for U.S. crypto regulation is unfolding in Washington.
The U.S. Senate has released a revised version of the CLARITY Act, a major piece of proposed legislation designed to establish a clearer regulatory framework for digital assets in the United States.
The updated text arrives at a critical moment for the crypto industry, with lawmakers preparing for a key procedural vote.
This is not simply another regulatory update.
The CLARITY Act could influence how digital assets, crypto exchanges, decentralized finance, token issuers, market participants, and
post-image
  • 1
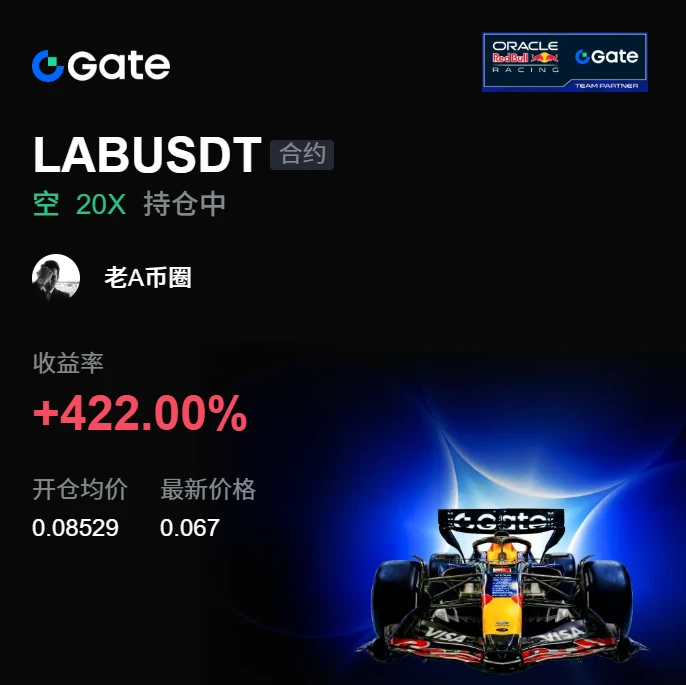
The stop-loss I nervously removed a few days ago looks like it saved me today. Before the market had fully started moving, I already felt something was off.
$LAB The rebound lacked strength and reeked of a bull trap, with each push upward weaker than the last. I directly called for shorting at the highs—don’t catch a falling knife.
It dropped from 0.08529 to 0.06701, and the short position delivered +422%. It was truly sluggish at first, but the result was truly sweet.
I’ve put most of the profit in my pocket and closed 80% first. The remaining 20% is protected at the entry price. Take profits
post-image
LAB+1.19%
BTC+0.15%
ZEC-2.46%
#BTC #ETH
#ShareWeekly
As of Sunday, September 13, 2026, Bitcoin is trading around the $77,200 area, while Ethereum is around $2,530. The total crypto market capitalization is approximately $2.71 trillion, with around $45.4 billion in 24-hour trading volume. Bitcoin dominance is around 57%, showing that BTC still controls a significant portion of market liquidity. These numbers tell me that the market is active, but it is also sitting at a decision point rather than presenting an obvious one-way trend.
BTC WEEKLY VIEW
Bitcoin has spent the recent period moving through a broad consolidation a
  • 2
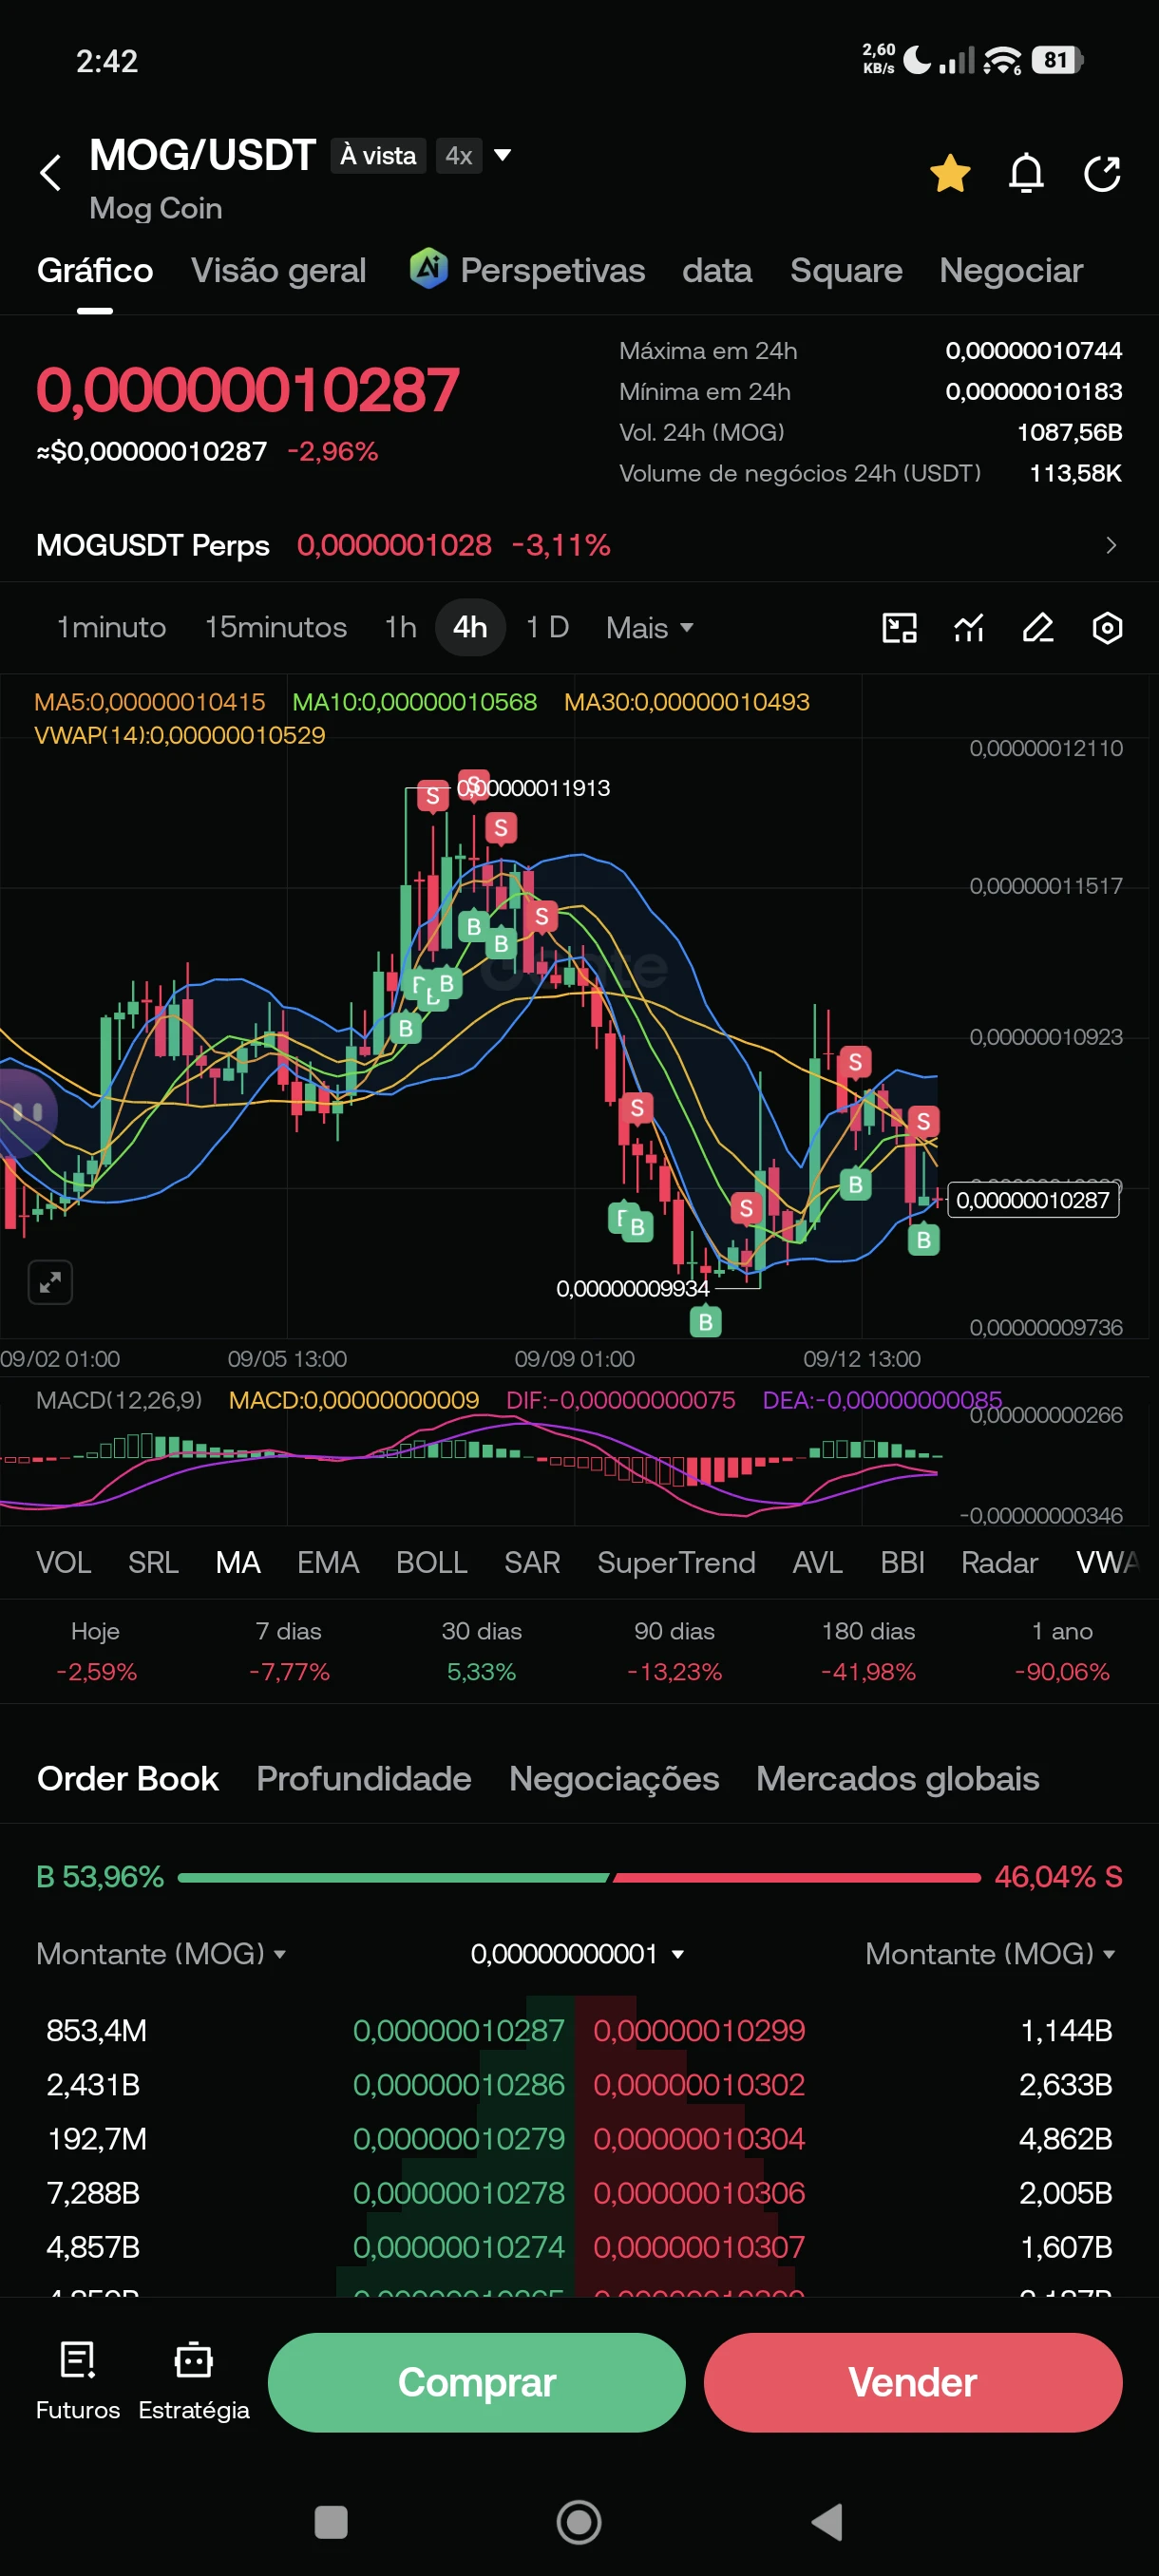
#mog wants to support it at least—pay decent interest on my billions of MOG that I have in Earn.
post-image
MOG-2.40%
#GateMeme PONS fell 40%—is it actually expensive?
Over the past few days, PONS has fallen from nearly $1 all the way to around $0.6.
If you only look at the candlestick chart, it is hard to say that it is strong.
But if you turn off the candlestick chart and only look at how much PONS is making now: over the past 24 hours, the platform generated more than $6 million in fees, while protocol revenue still exceeded $1 million; over the past 7 days, protocol revenue was close to $10 million.
Within the entire Launchpad sector, PONS is still in the top tier.
More importantly, PONS's revenue is not
ThisIsTranslateContent:
#GateMeme PONS dropped 40%—is it actually expensive?
Over the past few days, PONS has fallen from nearly $1 to around $0.6.
If you only look at the candlestick chart, it is hard to say that it is strong.
But if you turn off the chart and only look at how much PONS is currently earning: over the past 24 hours, the platform generated more than $6 million in fees, while actual protocol revenue still exceeded $1 million; over the past 7 days, protocol revenue approached $10 million.
Across the entire Launchpad sector, PONS remains in the top tier.
More importantly, PONS's revenue is not merely staying on paper.
Part of the protocol revenue is used to buy back and burn PONS. The cumulative revenue generated for PONS holders has now exceeded $10 million. So its underlying logic is actually different from that of many crypto public-chain projects that have only a story, no revenue, and rely purely on token sales and value extraction.
But recently, I have also been thinking about a question: Could PONS enter a negative spiral?
Meme hype declines → trading volume declines → PONS revenue declines → buybacks decrease → PONS price falls → market hype declines further.
This is PONS's biggest risk right now.
PONS's revenue has indeed started to decline from its peak recently, so we cannot simply take $1 million in daily revenue, multiply it by 365, and claim that it must be worth several billion dollars.
What really matters is how much revenue it can retain after the hype fades.
If PONS can continue to steadily earn $500,000–$1 million per day in the future, I believe its current market cap of more than $400 million is not high, and $1 billion will only be a matter of time.
But if its future revenue falls all the way from $1 million to $300,000, $100,000, or even tens of thousands of dollars, then PONS, which looks very cheap now, will not actually be cheap.
So when I look at PONS now, I am no longer too concerned about whether it will be at $0.5 or $0.7 tomorrow. I am more focused on whether PONS can continue making money after this Meme frenzy ends.
Robinhood Chain's daily DEX trading volume still exceeds $2.6 billion, its TVL is approximately $920 million, and its stablecoin supply exceeds $1 billion. This ecosystem has not disappeared because of PONS's price decline.
What PONS is truly worth looking forward to may not be making money from Memes forever.
If it can gradually evolve from a Meme Launchpad into an asset issuance and trading infrastructure on Robinhood Chain, its ceiling could be far higher than what we see today.
Conversely, if it ultimately turns out to be merely a money-printing machine in this Meme boom, its revenue will end when the boom ends.
So I don't think PONS is a price question right now.
Rather, it is a more interesting question: Is this $1 million in daily revenue merely a flash in the pan, or the starting point of a new “hype”?
Let's wait and see.$PONS

repost-content-media
PONS-3.06%
  • 2
#GateTop4MainstreamCEX
#Gate主流CEXTop4
Gate Holding the Global Top 4 — Is Top 3 the Next Target?
August 2026 delivered another strong signal about Gate’s growing position in the global centralized crypto exchange market. According to the latest BlockBeats data, Gate recorded approximately $40 billion in spot trading volume and approximately $285 billion in derivatives trading volume during August, keeping Gate firmly inside the global Top 4 mainstream CEX ranking. For me, this is much more than a simple ranking. It reflects the scale of activity, trader participation, product expansion and mar
  • 1
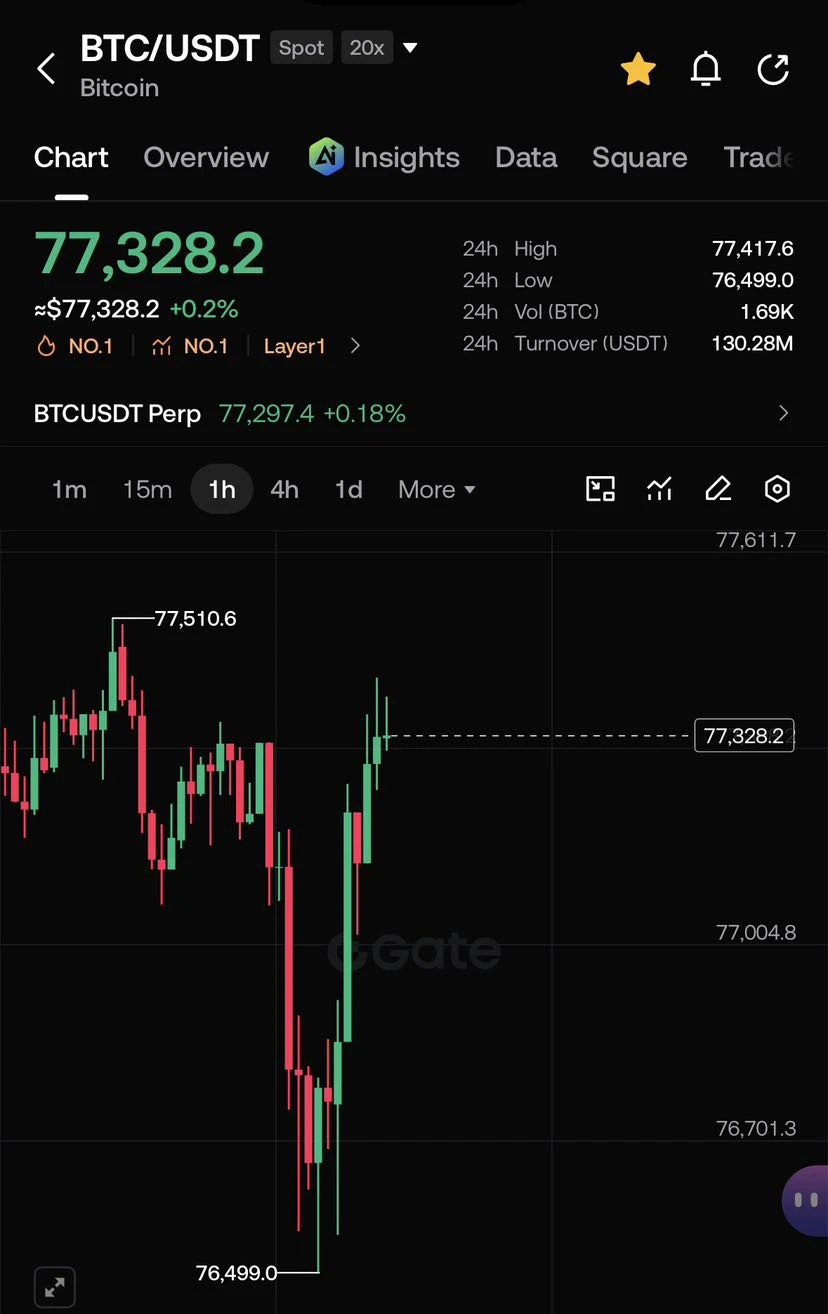
I’m watching $BTC for a short here.
BTC bounced hard from the $76.5K area, but now price is pushing back into the $77.3K–$77.5K resistance zone. The recovery is strong, so I’d rather wait for rejection instead of chasing the short blindly.
Entry: $77,300–$77,480
Targets:
TP1: $77,050
TP2: $76,800
TP3: $76,500
Stop: $77,650
For me, $77.5K is the key level. As long as BTC struggles below it, I’m watching for another pullback. A clean 1H reclaim above that zone would invalidate the short idea.
#CoinDeskRevealsGateRWAPerpetualsTop3Globally #AugustCoreCPIBeatsExpectations
post-image
BTC+0.15%
  • 5
  • 1
#AugustCoreCPIBeatsExpectations
August Core CPI Beat Expectations — But the Full Story Is More Complicated
Understanding this data matters because the direction it gives the market depends not on a single number but on the entire macro picture. Below I'm laying out my full analysis with my own opinion, including the numbers, percentages, liquidity, and volume.
1. What the August 2026 data actually said
The August Consumer Price Index was released on September 11 and it tells two different stories. Headline CPI came in at 3.4 percent year-over-year, exactly flat versus July's 3.4 percent, but
CL+1.41%
BTC+0.15%
ETH-0.44%
  • 2
#WeeklyShare
Ethereum is entering a critical weekly decision zone. ETH is trading around $2,510, with the market still digesting a sharp September move and the latest macro pressure. Current market data places Ethereum near a $2.61T total crypto market, while ETH remains one of the strongest large-cap altcoin stories despite the recent pullback.
THE WEEKLY STRUCTURE
The bigger picture is still constructive. ETH recently rallied roughly 37% in only 10 days, reaching around $2,564 before entering consolidation. That creates a clear technical battlefield: buyers need to defend the recent breakou
post-image
ETH-0.44%
BTC+0.15%
Live trading - Analysis hot crypto coin
live-cover
LIVE948
Filecoin Cuts New Supply by 75%: How to Buy the 24%-Surging FIL on a Pullback
The blockbuster news an hour ago—Filecoin’s two institutional unlocks expire on October 15, cutting new supply by approximately 75%. $FIL Rallied first to show respect🔥: +23.9% in 24 hours, current price 0.9945. The direction is clear—don’t chase longs; only buy the dip on a pullback.

The transmission is strong—first, on the supply side, unlocks stopping cuts off the supply of cheap tokens, causing selling pressure to structurally disappear; second, the chart confirms it: nine consecutive bullish 1-hour candles br
FIL+25.27%
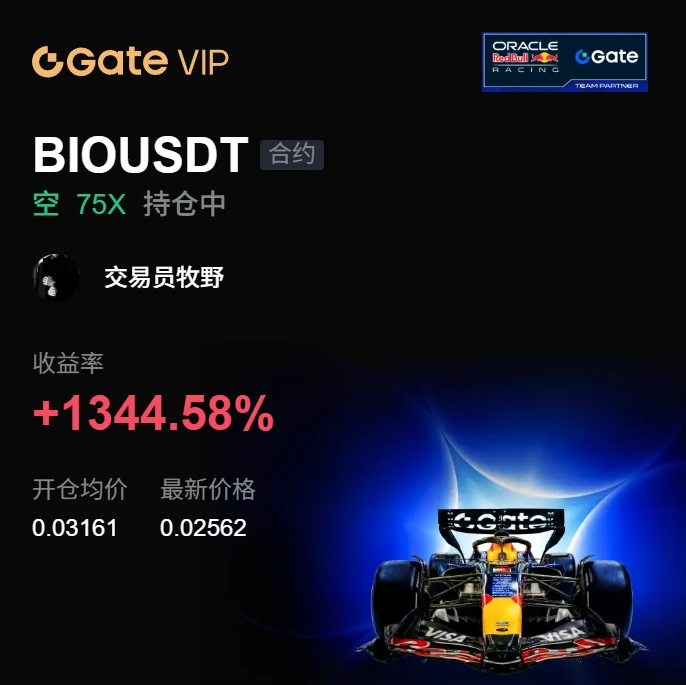
Is this really a rebound, or CPR for my empty account? When I opened the charts this morning, I even rubbed my eyes twice, afraid I was seeing things wrong. 😎
During the repeated intraday fluctuations, $BIO kept hovering around 0.03161. On the surface it looked like a bottoming formation, but in reality, every rebound was out of breath—once it touched a key level, its legs went weak. A textbook case of a weak rebound. I thought to myself that this kind of sideways movement was most likely waiting to choose a direction downward, so I placed a short order to test the waters.
After entering at
post-image
BIO+0.47%
BTC+0.15%
BNB-0.84%
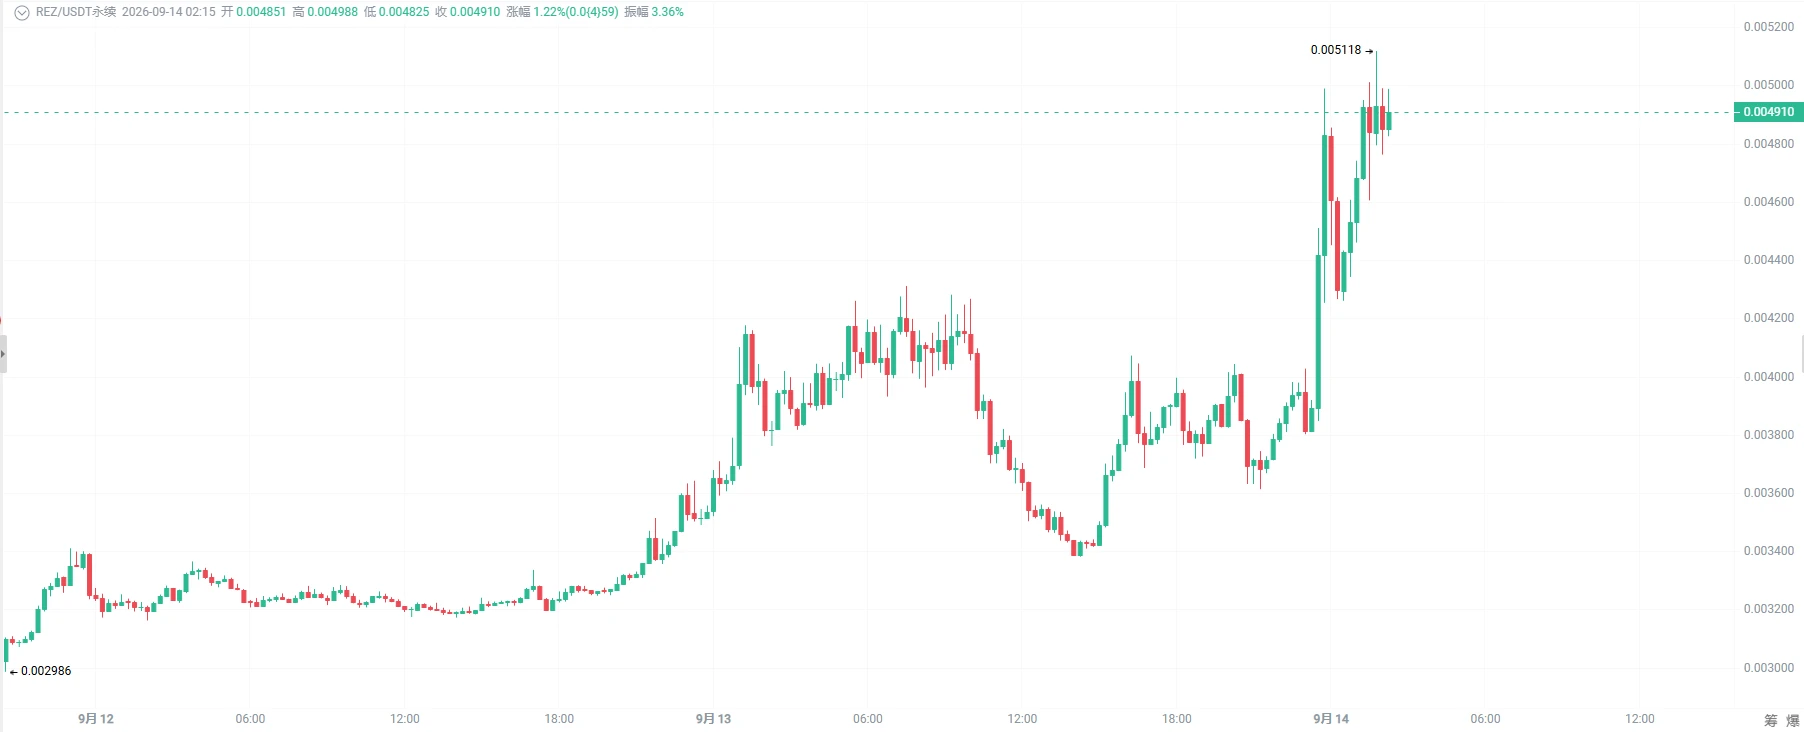
REZ was 0.0040 yesterday and 0.0048 today. Restaking tokens have been in the green for two consecutive days, while ETH has not surged in tandem, indicating a catch-up rally among second-tier assets.
$REZ
post-image
REZ+28.51%
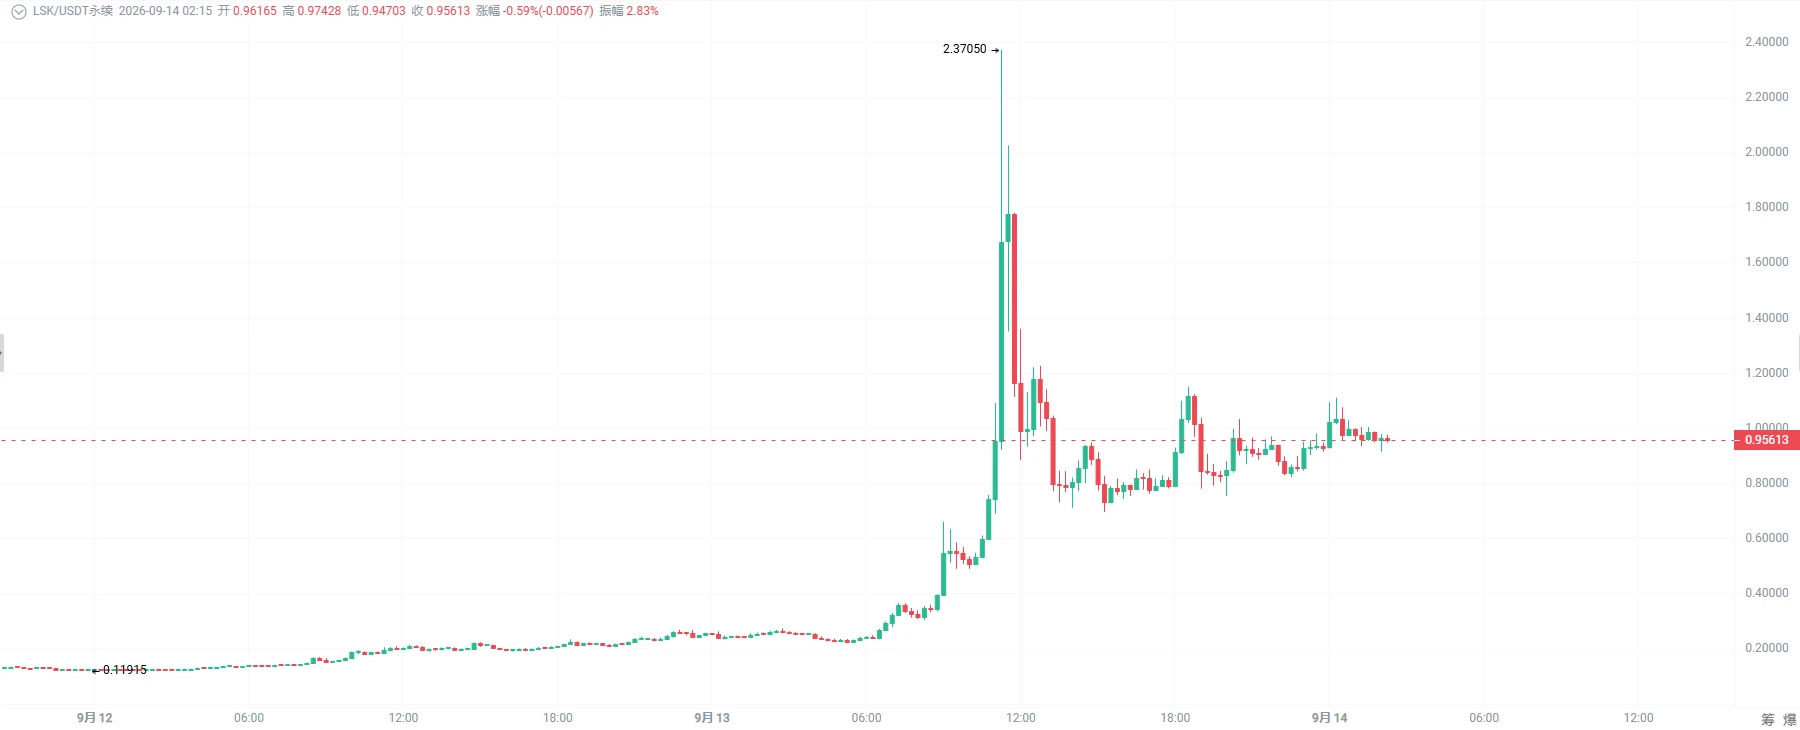
LSK was at 0.24 yesterday, touched $2 intraday, and is now at 0.96. The only three verifiable developments are: the chain plans to shut down on October 31, pivot toward enterprise stablecoins/payments, and a proposal to burn 100 million tokens (reducing the total supply from 400 million to 300 million, not yet approved by a vote). Liquidations over the past 24 hours totaled approximately $41.13 million, including about $33.68 million in short positions—the core driver of the surge is a short squeeze, not fundamentals suddenly causing a fivefold increase overnight. Trading volume is absurdly hi
post-image
LSK+253.59%
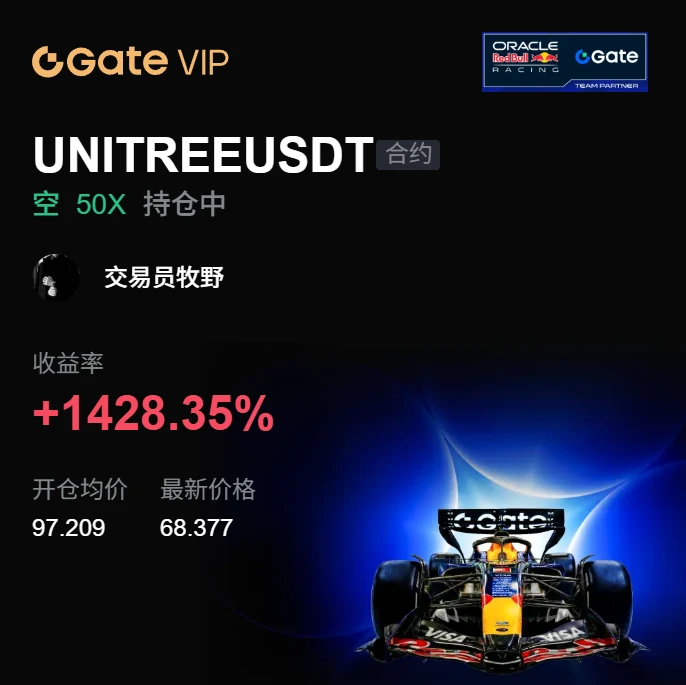
No action, no analysis, just relying on sheer luck—this track record is embarrassing even to talk about. 😂

When I checked the chart after lunch, I found it had stalled again around 97.209. The large bearish candle above was pressing down, and no one dared to catch the bounce. I didn’t think much of it and casually placed a short order.

The market did the work for me, grinding all the way down to 68.377 and giving me +1428.35% in unrealized profit. That felt amazing. The short sellers who were already aboard must be thrilled.

When managing profits, I’m someone who fears giving them back:
post-image
BTC+0.15%
XRP-0.70%
My hand trembled slightly when I set the stop-loss a few days ago, only to find this morning that the filial piety was unnecessary. During the repeated intraday fluctuations, I only confirmed one thing: the pullback held, with no breakdown, meaning the bulls still had conviction.
So after entering around 0.08349 a few days ago, I never expected it to surge too high in one go. Today it went straight to 0.08444, with unrealized gains of +105.84%. The whole process was actually very steady—nothing worth bragging about.
Profit you can take away is the only real profit. I’m not greedy for the last
post-image
SOL-0.60%
SNDK-3.47%
Everyone is ignoring the bearish daily trend, but SYMBOL might be about to flip.

$ESPORTS /USDT - LONG

Trade Plan:
Entry: 0.01016 – 0.01022
SL: 0.00976
TP1: 0.01052
TP2: 0.01073
TP3: 0.01106

Why this setup?
Why now? The 1h price is holding near the entry zone, the 15m RSI is deeply oversold at 34.89, and the 1h ATR is compressed to 0.000139, signaling a potential explosive move. The higher-timeframe trend remains bearish, making this a low-risk reversal setup against the crowd. A break above the entry zone targets TP1 at 0.01052, with TP2 at 0.01073 in clear sight. The line in the sand i
ESPORTS-8.17%
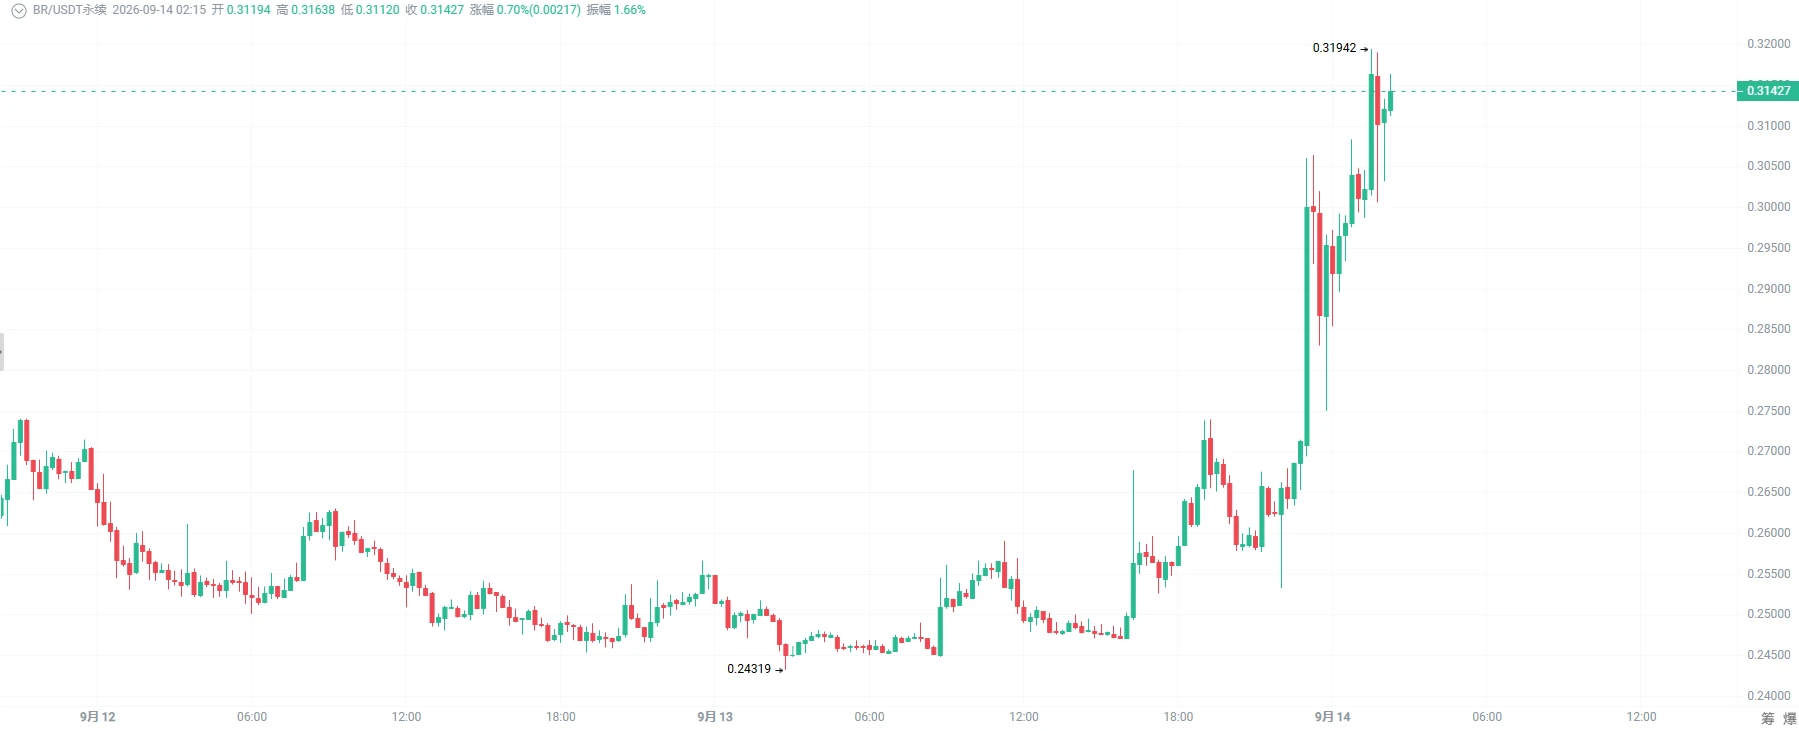
BR’s old high-beta token was mentioned again, with no new story.
$BR
post-image
BR+27.76%
I did absolutely nothing—just went to the restroom, and when I came back, the candlesticks had already done the work for me. I stared blankly at the screen for three seconds, then quietly said: To the moon.
During the intraday bottoming phase, I kept looking at that sideways action at the bottom. Trading volume had contracted cleanly; it couldn't be pushed down further, nor was it falling deeply. I knew then that this was either the bottom or the end of the consolidation, with the odds favoring the upside. I mentioned it at the time too: just be a little more patient.
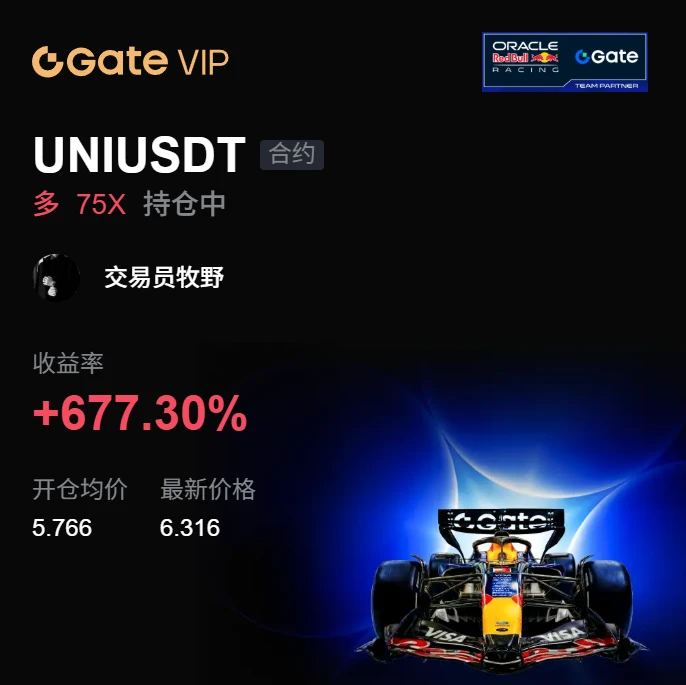
The long entry price was
post-image
SOL-0.60%
SNDK-3.47%
Load More

Join 40 M users in our growing community

⚡️ Join 40 M users in the crypto craze discussion

💬 Engage with your favorite top creators

👍 See what interests you