
Square
Following
Hot
News
Notifications
Profile
Share your thoughts
placeholder
Article
Bitcoin continues to slide, leaving the market gripped by panic, but on-chain data shows an unusual divergence: long-term holders are beginning to loosen their grip, while short-term holders remain relatively calm.

Data from November 5 showed that realized losses transferred to exchanges by long-term holders (LTHs) reached $139 million, enough to indicate that some long-time holders can no longer withstand the current market pressure. But short-term holders (STHs) have not seen a comparable wave of panic selling. After substantial turnover in the preceding period, the cost basis of short-term
post-image
BTC-0.65%
$BTC
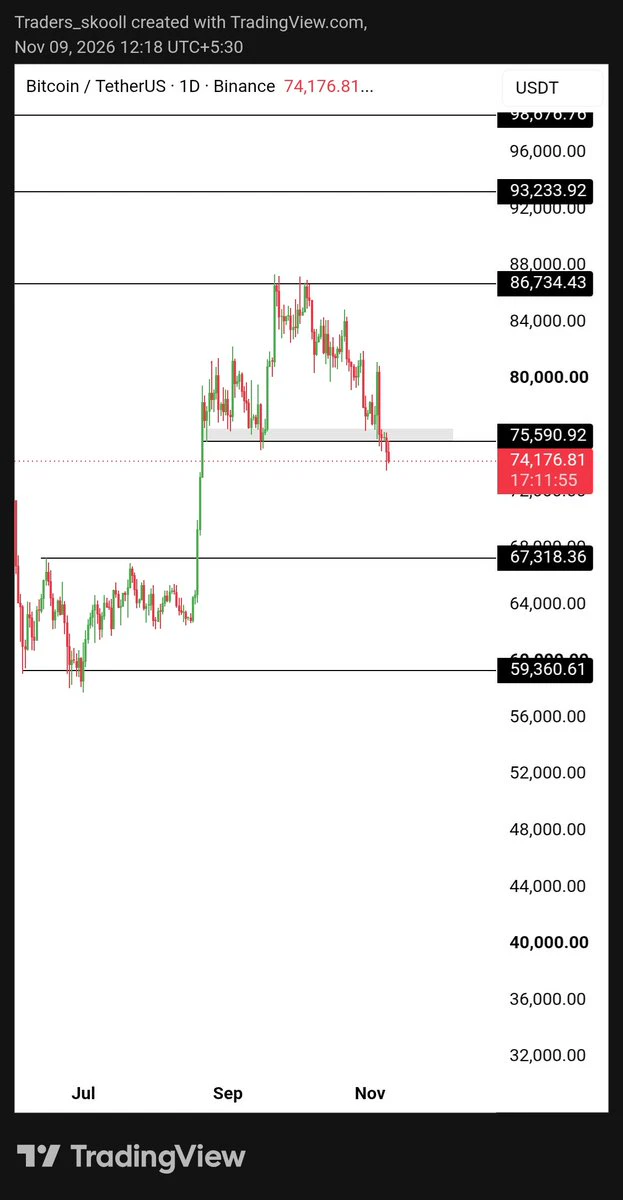
Need to see flip of that zone to become bullish again
Till then it's a indecisive zone for me
post-image
BTC-0.67%
Trenches
牛逼
牛
bade
b
牛逼
0x96...7777
Market Cap
$.
Change
.
24h Vol
$.
Holders
.
ZIG
Z
bade
b
ZIG
0x8c...1145
Market Cap
$.
Change
.
24h Vol
$.
Holders
.
BTC
B
bade
b
BTC
C5xp...pump
Market Cap
$.
Change
.
24h Vol
$.
Holders
.
STONK
S
bade
b
STONK
6GmA...UNgx
Market Cap
$.
Change
.
24h Vol
$.
Holders
.
fxUSD
f
bade
b
fxUSD
0x08...d8f6
Market Cap
$.
Change
.
24h Vol
$.
Holders
.
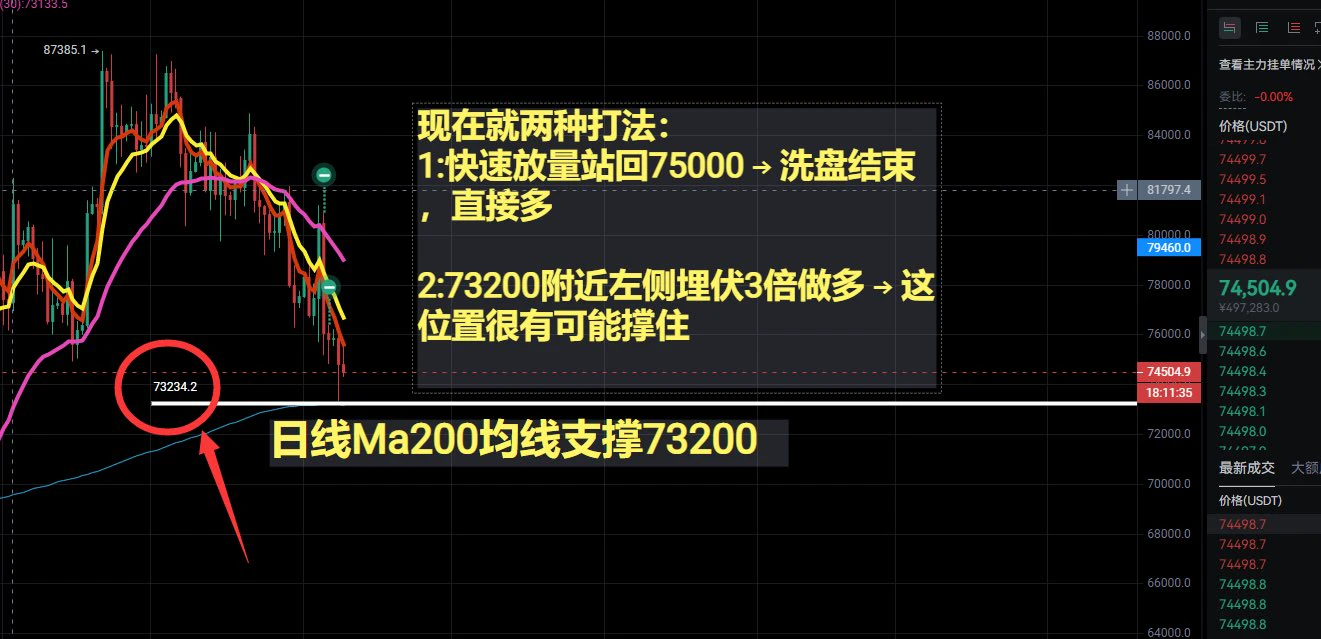
$BTC Get ready to place limit orders to go long at $73637 and $72895, everyone. These two price levels are liquidation prices for some whales.
BTC-0.65%
BREAKING:
This is insane—could one decision by Jensen’s wife determine $NVDA ’s stock price going forward.
post-image
NVDA+2.80%
  • 6
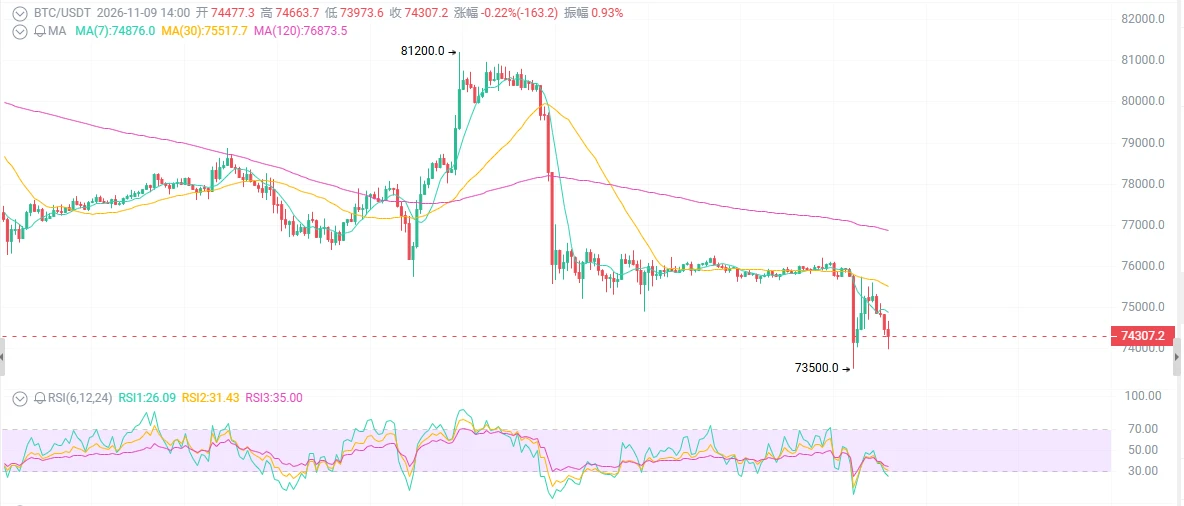
BTC at $74,300—would you still dare to buy the dip?
ETFs saw $1.28 billion in outflows in one week, over $1 billion in longs were liquidated, and the weekly chart posted five straight down weeks—everyone is shouting, “The bear market is here.” But is the $73,000 level really institutions’ cost-basis floor, or the next meat grinder?

First, the surface picture: the drop looks ugly, but it hasn’t collapsed.

It fell 1.5%-2% in 24 hours, hitting a low of 73,500. The daily chart has posted consecutive bearish candles, the weekly chart its fifth straight red candle, and price has broken below the 5
post-image
BTC-0.67%
ETH-1.26%
SOL-0.77%
$AIN BOOM🤑🤑 is going according to plan. What a beautiful drop—the guys made a killing. Hurry and check if the money has arrived, haha$JCT $AIOT
post-image
AIN+3.85%
JCT-3.26%
AIOT-2.28%
BTC MARKET UPDATES
live-cover
LIVE1,757
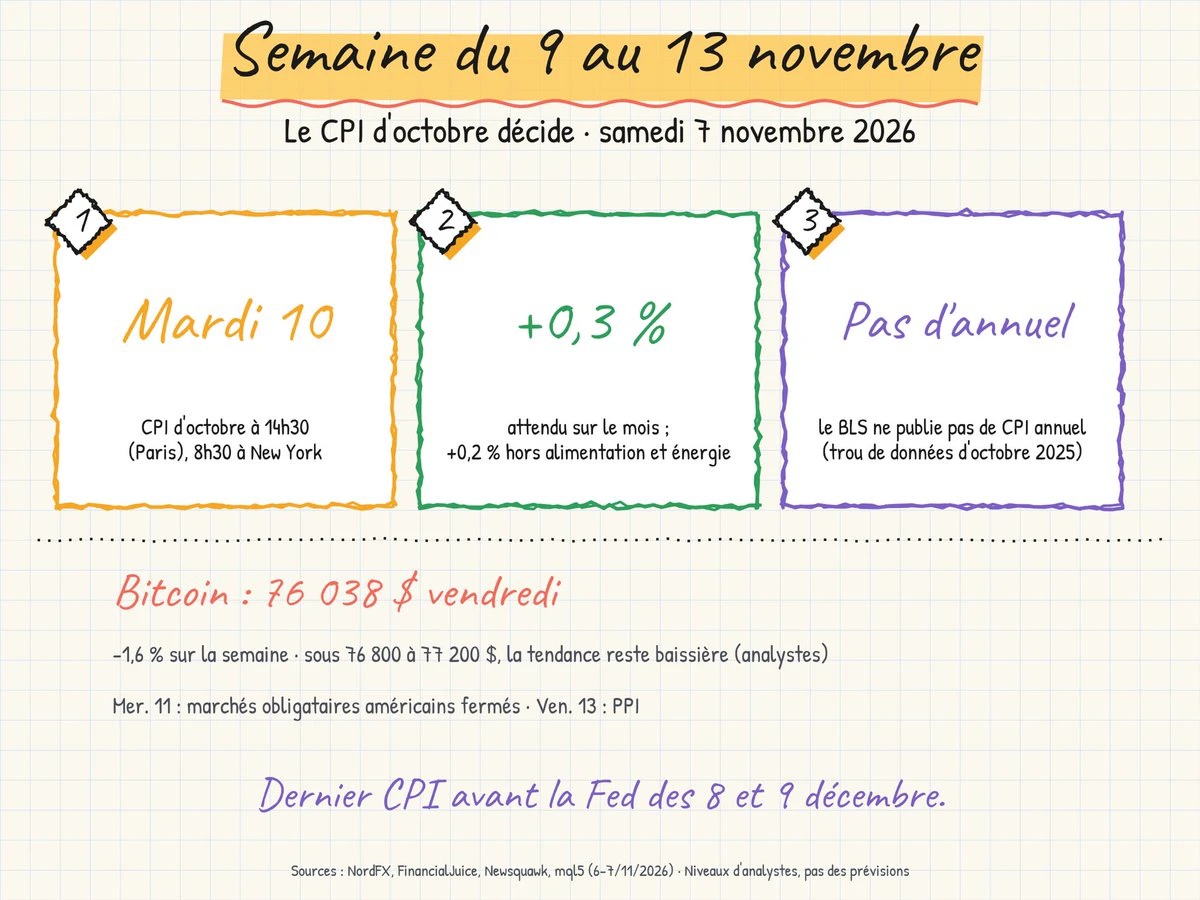
Week of Nov. 9–13: October CPI, Tuesday at 2:30 p.m. (Paris).
→ Expected: +0.3% month over month, +0.2% excluding food and energy
→ No year-over-year figure (October 2025 data missing)
→ Fri.: PPI
Bitcoin: $76,038 Friday.
What figure are you expecting?
post-image
BTC-0.67%
BTC is too closely tied to U.S. stocks to make an independent move. In a word, it’s at the mercy of external forces. Keep reading below and look for opportunities to go long
BTC-0.67%
‼️K-God has shared trading levels nonstop for nearly 5 years, rain or shine. Long-term, precise levels + direction calls have maintained a stable 90% win rate📈5gt The lowest promotion of the year ends tomorrow‼️Apple users can click below⬇️

https://www.gate.com/zh/profile/波段王k神

‼️The fourth wave is in the bottoming-out phase; the direction + levels have been clearly shared‼️ Last week, shorted the tops at 2395/79700 and took profit at 2080/73500📉This morning, reversed into a long at 2080 and took profit#BTC闪崩插针
BTC-0.67%
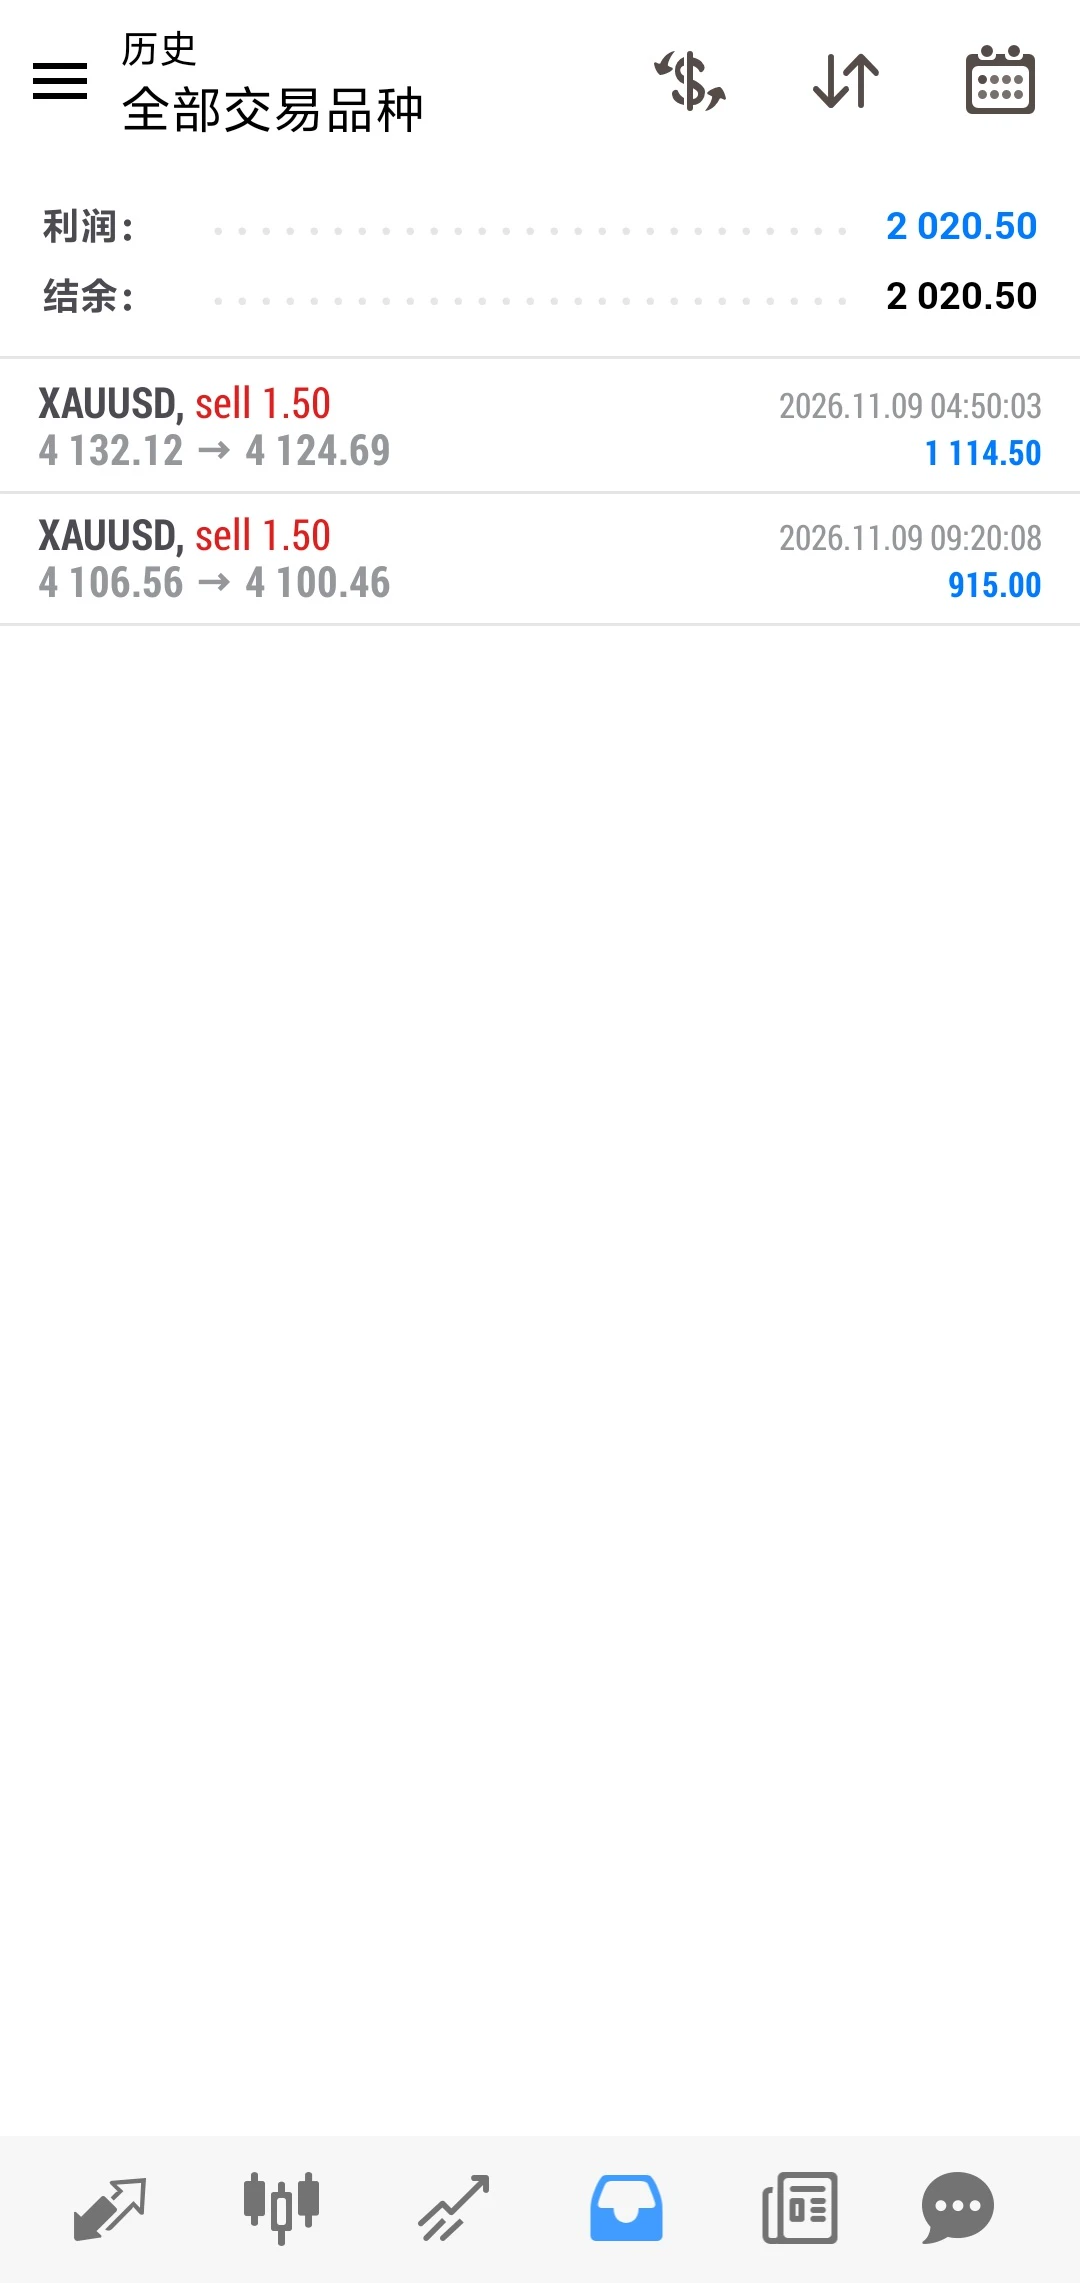
Two consecutive wins on intraday gold shorts!
Short at 4106, exit at 4100, 6 points, 915🔪$XAUT
post-image
XAUT+0.30%
#晒出我的合约收益 #Gate24小时净流入全球第三 Earn 0.01U every day, passing the time doing nothing.
post-image
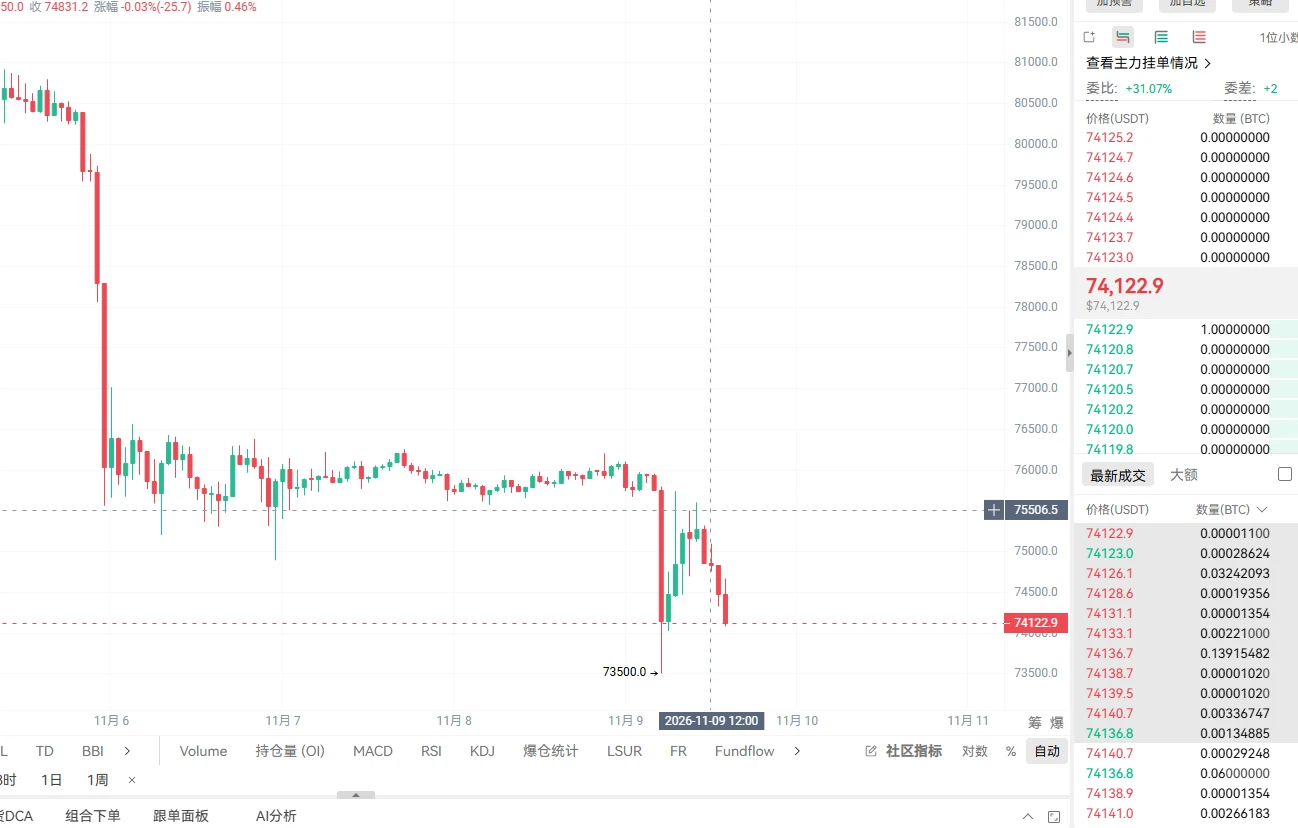
Bitcoin is at 74,100 now, after hitting a low of 73,980 this afternoon—just shy of breaking below 74,000.
It’s been falling for five straight weeks, with not a single bullish weekly candle. The Nasdaq fell 3.4% last week, led lower by AI chip stocks, and Bitcoin followed U.S. stocks. Until U.S. stocks stop falling, Bitcoin won’t stop either.
Bad news has also been piling up this weekend. Binance was hacked, Democrats won the midterm elections, Huang’s affair made headlines, and interest rates are set to rise again next month. Right now, money just wants to flow out, and nobody’s willing to buy
post-image
BTC-0.67%
NAS100-0.30%
A master said this name was bringing me bad luck, so I changed it. Just so you know!!
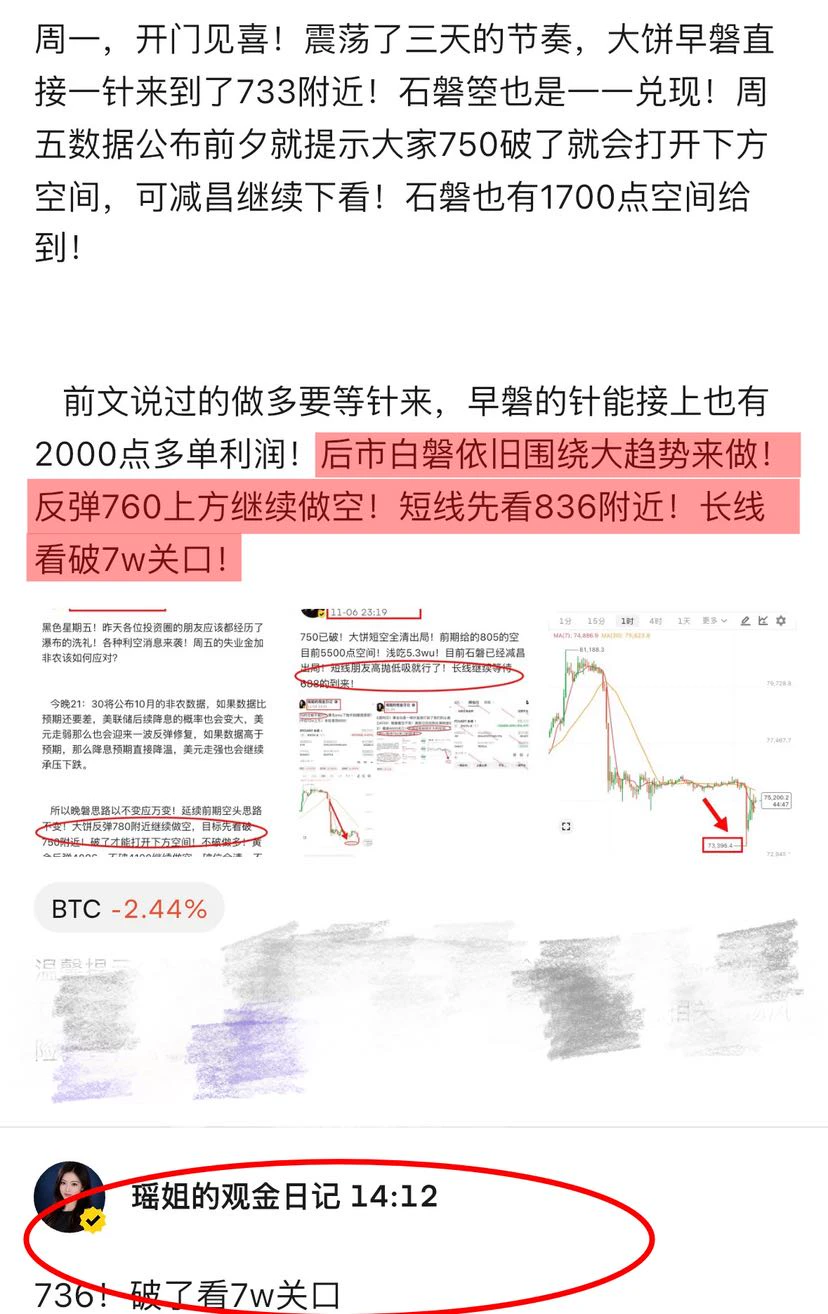
Keep shorting the Monday daytime-session rebound! We’re now just one step away from 736! 2000 points in the bag! In the long term, patiently await 68888!
post-image
Me just waking up: "Good morning!! New week, new opportunities. The crypto market is down, but we stay positive. This is temporary. Trust the process.." 🙏☀️
Opens X:
post-image
BTC | ETH | Gold | Crude Oil
live-cover
LIVE3,774
Ethereum forecast played out as expected, with all targets hit✅
Previous setup: short on a rebound into the 2250-2280 range, with the first target at 2200 and a break below opening the way to 2150-2100.
After facing resistance at the highs, the market fell all the way down, hitting a low of 2050 and delivering a 203-point move, breaking straight through the lower end of the expected range.

Market moves are never random. Understand the cyclical structure, position with the trend, and the entire scenario plays out as planned—every part of the analysis is validated.$ETH
ETH-1.23%
Load More

Join 40 M users in our growing community

⚡️ Join 40 M users in the crypto craze discussion

💬 Engage with your favorite top creators

👍 See what interests you

Trending Topics

USCPIDataIncoming

30.01k Views1.85k Discussing

The U.S. October CPI report will be released on November 10 at 8:30 a.m. ET. September CPI came in at 3.7% year over year, and markets will be watching closely for signs that inflation is cooling, especially in core CPI. A softer-than-expected reading could strengthen rate-cut expectations, while hotter inflation may pressure risk assets through higher Treasury yields and a stronger dollar. How do you think this CPI print will move $BTC, U.S. stocks and gold?

RedBullDoublePodiumInBrazil

2.28k Views30.52k Discussing

BTCFlashCrash

86.66k Views66.24k Discussing

View More