Share your thoughts
placeholder
Article
U.S job report market impact
live-cover
LIVE1,774
Returning once again to the crypto world's major platform to witness the eighth wonder of the crypto world!
An 11-year crypto trading veteran! #美国8月非农超预期 #美国8月非农超预期 #BTC收复8万美元 #BTC #ETH
post-image
BTC-1.67%
ETH-2.36%
  • 1
#GateEventContractTradeSharingChallenge #ETH
ETH is currently around $2,452, and this is becoming a very important decision zone for ETH traders. After recovering from the lower levels of the recent seven-day range, ETH is now approaching the psychological $2,500 level and the much more important $2,550–$2,560 resistance zone. From $2,452, a move to $2,500 would give roughly +2.0%, while a breakout toward $2,560 would mean around +4.4%. The real question now is whether ETH can finally break this ceiling and start another powerful upside leg.
The seven-day chart is showing a recovery and cons
post-image
ETH-2.36%
  • 7
  • 2
$ETH Signal】Go long + 4H momentum expansion/buy-side depth skew
$ETH RSI 4H 67.07, 1H MACD histogram -1.53 narrowing, with price pinned at 2523. The 4H MACD histogram is 13.26, with bullish momentum expanding; the upper Bollinger Band is 2543, and price is near but has not broken away from the upper band. Order book depth imbalance is 65.26%, with a bid-ask ratio of 4.76, and buy-side depth clearly dominant. The 2500 round-number level has held for four consecutive 4H candles.
🎯Direction: Go long
⚡Entry/limit orders: Place staggered orders in the 2516.029 - 2523.600 range
🛑Stop-loss: 2461.6
post-image
ETH-2.35%
BTC-1.67%
SOL-2.02%
Should I make a “U.S. stocks crashed today” post?
post-image
#BE# is the leading stock in “solid oxide fuel cell” power generation. It rose 7% today. The upside target is getting closer, with only 5% remaining. Figure 2 shares my view. 【Important change: On September 5, BE was added to the S&P 500 Index】 $BE
BE+11.50%
$NVDA Nvidia May Reclaim the “Iron Throne”
Share prices of U.S. tech giants are once again nearing record highs—and this time, Nvidia is clearly the player leading the bull-market charge.
After falling behind other surging semiconductor stocks earlier in 2026, Nvidia has recently been reestablishing its position as the “king of the AI trade.”
On Thursday, the first and largest U.S. ETF tracking the “Magnificent Seven”—the Roundhill Magnificent Seven ETF—surged nearly 2.5% to close at $70.43, just below its record closing high of $70.94 set in May this year. The ETF holds equal positions in the
post-image
ThisIsTranslateContent:
$NVDA Nvidia May Reclaim the “Throne”
US tech giants’ stock prices are once again approaching record highs—and this time, Nvidia is clearly the player leading the bull market charge.
After falling conspicuously behind other surging semiconductor stocks earlier in 2026, Nvidia has recently begun reasserting its position as the “king of the AI trade.”
On Thursday, the first and largest US-listed ETF tracking the “Magnificent Seven”—the Roundhill Magnificent Seven ETF—surged nearly 2.5% to close at $70.43, approaching its record closing high of $70.94 set in May this year. The ETF holds equal-weight positions in the seven tech giants—Microsoft, Apple, Nvidia, Alphabet, Amazon, Meta, and Tesla—and rebalances quarterly.
In recent months, the “Magnificent Seven” stocks have shown clear divergence. Of the seven constituents, Nvidia and Apple are closest to their record highs, with both less than 3% below their all-time highs. Meanwhile, Alphabet, Meta, and Tesla have fallen by double digits from their record highs.
Nvidia’s stock has recently gained strong momentum, boosted by its robust earnings report last week. In its latest earnings report, the company said it expected revenue for the fiscal year ending January 2028 to grow by more than 70%.
Joe Tigay, portfolio manager at Equity Armor Investments, wrote in a report last week that the earnings results showed “the buildout of AI infrastructure remains endless.”
Overnight, Nvidia received its latest piece of good news with the announcement that it would acquire Hugging Face, a popular open-source AI developer platform. In a report on Thursday, Forrester Vice President and Principal Analyst Jeff Pollard said the deal would help the chip giant gain greater control and visibility over the open-source software layer, thereby deepening Nvidia’s AI ecosystem.
Nvidia returns to the spotlight Nvidia’s market leadership once again marks a reversal in the industry landscape from earlier this year. At that time, as semiconductor stocks such as Micron Technology and Advanced Micro Devices (AMD) drove the iShares Semiconductor ETF to a record high, Nvidia was left far behind. Some analysts speculated that Nvidia had become too large, and investors were seeking differentiated semiconductor plays.
Data shows that although the iShares PHLX Semiconductor ETF (SOXX) has risen 67% year to date, the semiconductor sector as a whole has recently significantly underperformed Nvidia as investors recalibrated their expectations for some fast-growing chip stocks. Over the past three months, Nvidia’s stock has risen 7%, while SOXX has fallen 18%.
Despite shifts in market sentiment and competition from rivals, Nvidia has once again demonstrated its irreplaceability in the AI wave through strong earnings expectations and strategic reinforcement of the open-source ecosystem. As hardware infrastructure buildout continues and the software ecosystem matures, whether Nvidia can lead the “Magnificent Seven” to new highs will become a key indicator of the direction of US tech stocks. $NVDA
repost-content-media
NVDA+0.87%
MSFT-2.03%
AAPL-2.51%
AMZN-0.15%
META+0.99%
  • 1
SanDisk $SNDK 1800 won't let me take profit. Fine, fine, fine—I'll hold until 2300 before taking profit.
post-image
SNDK+12.30%
Your setup can be right and still get stopped out in seconds.
DTT now alerts you 2 hours and 1 hour before NFP or FOMC—with sound—so you have time to size down or close before volatility hits.
DTT v3.9.0 is live.
today update
live-cover
LIVE1,878
Posted by an omnipotent group member.
Wait, why are the short dramas I watch different from the ones you watch??
$MARSCOIN Signal】Strong order book support + low-volume consolidation
$MARSCOIN Low-volume consolidation at high levels, with a 33.2% imbalance in buy-side depth and an order book Bid/Ask ratio of 1.99. The 1H MACD histogram turned negative, while the price continues to hold above 0.19. Funding rate: 0.0498%, OI stable.
🎯Direction: Long
⚡Entry/Limit Order: 0.1900182 - 0.1905900
🛑Stop-loss: 0.1886841
🚀Target 1: 0.1934489
🚀Target 2: 0.1948783
🛡️Trade Management:
- Execution strategy: After reaching Target 1, reduce the position by 50% and move the stop-loss up to breakeven. If the price fa
post-image
MARSCOIN+33.71%
BTC-1.67%
ETH-2.36%
SOL-2.02%
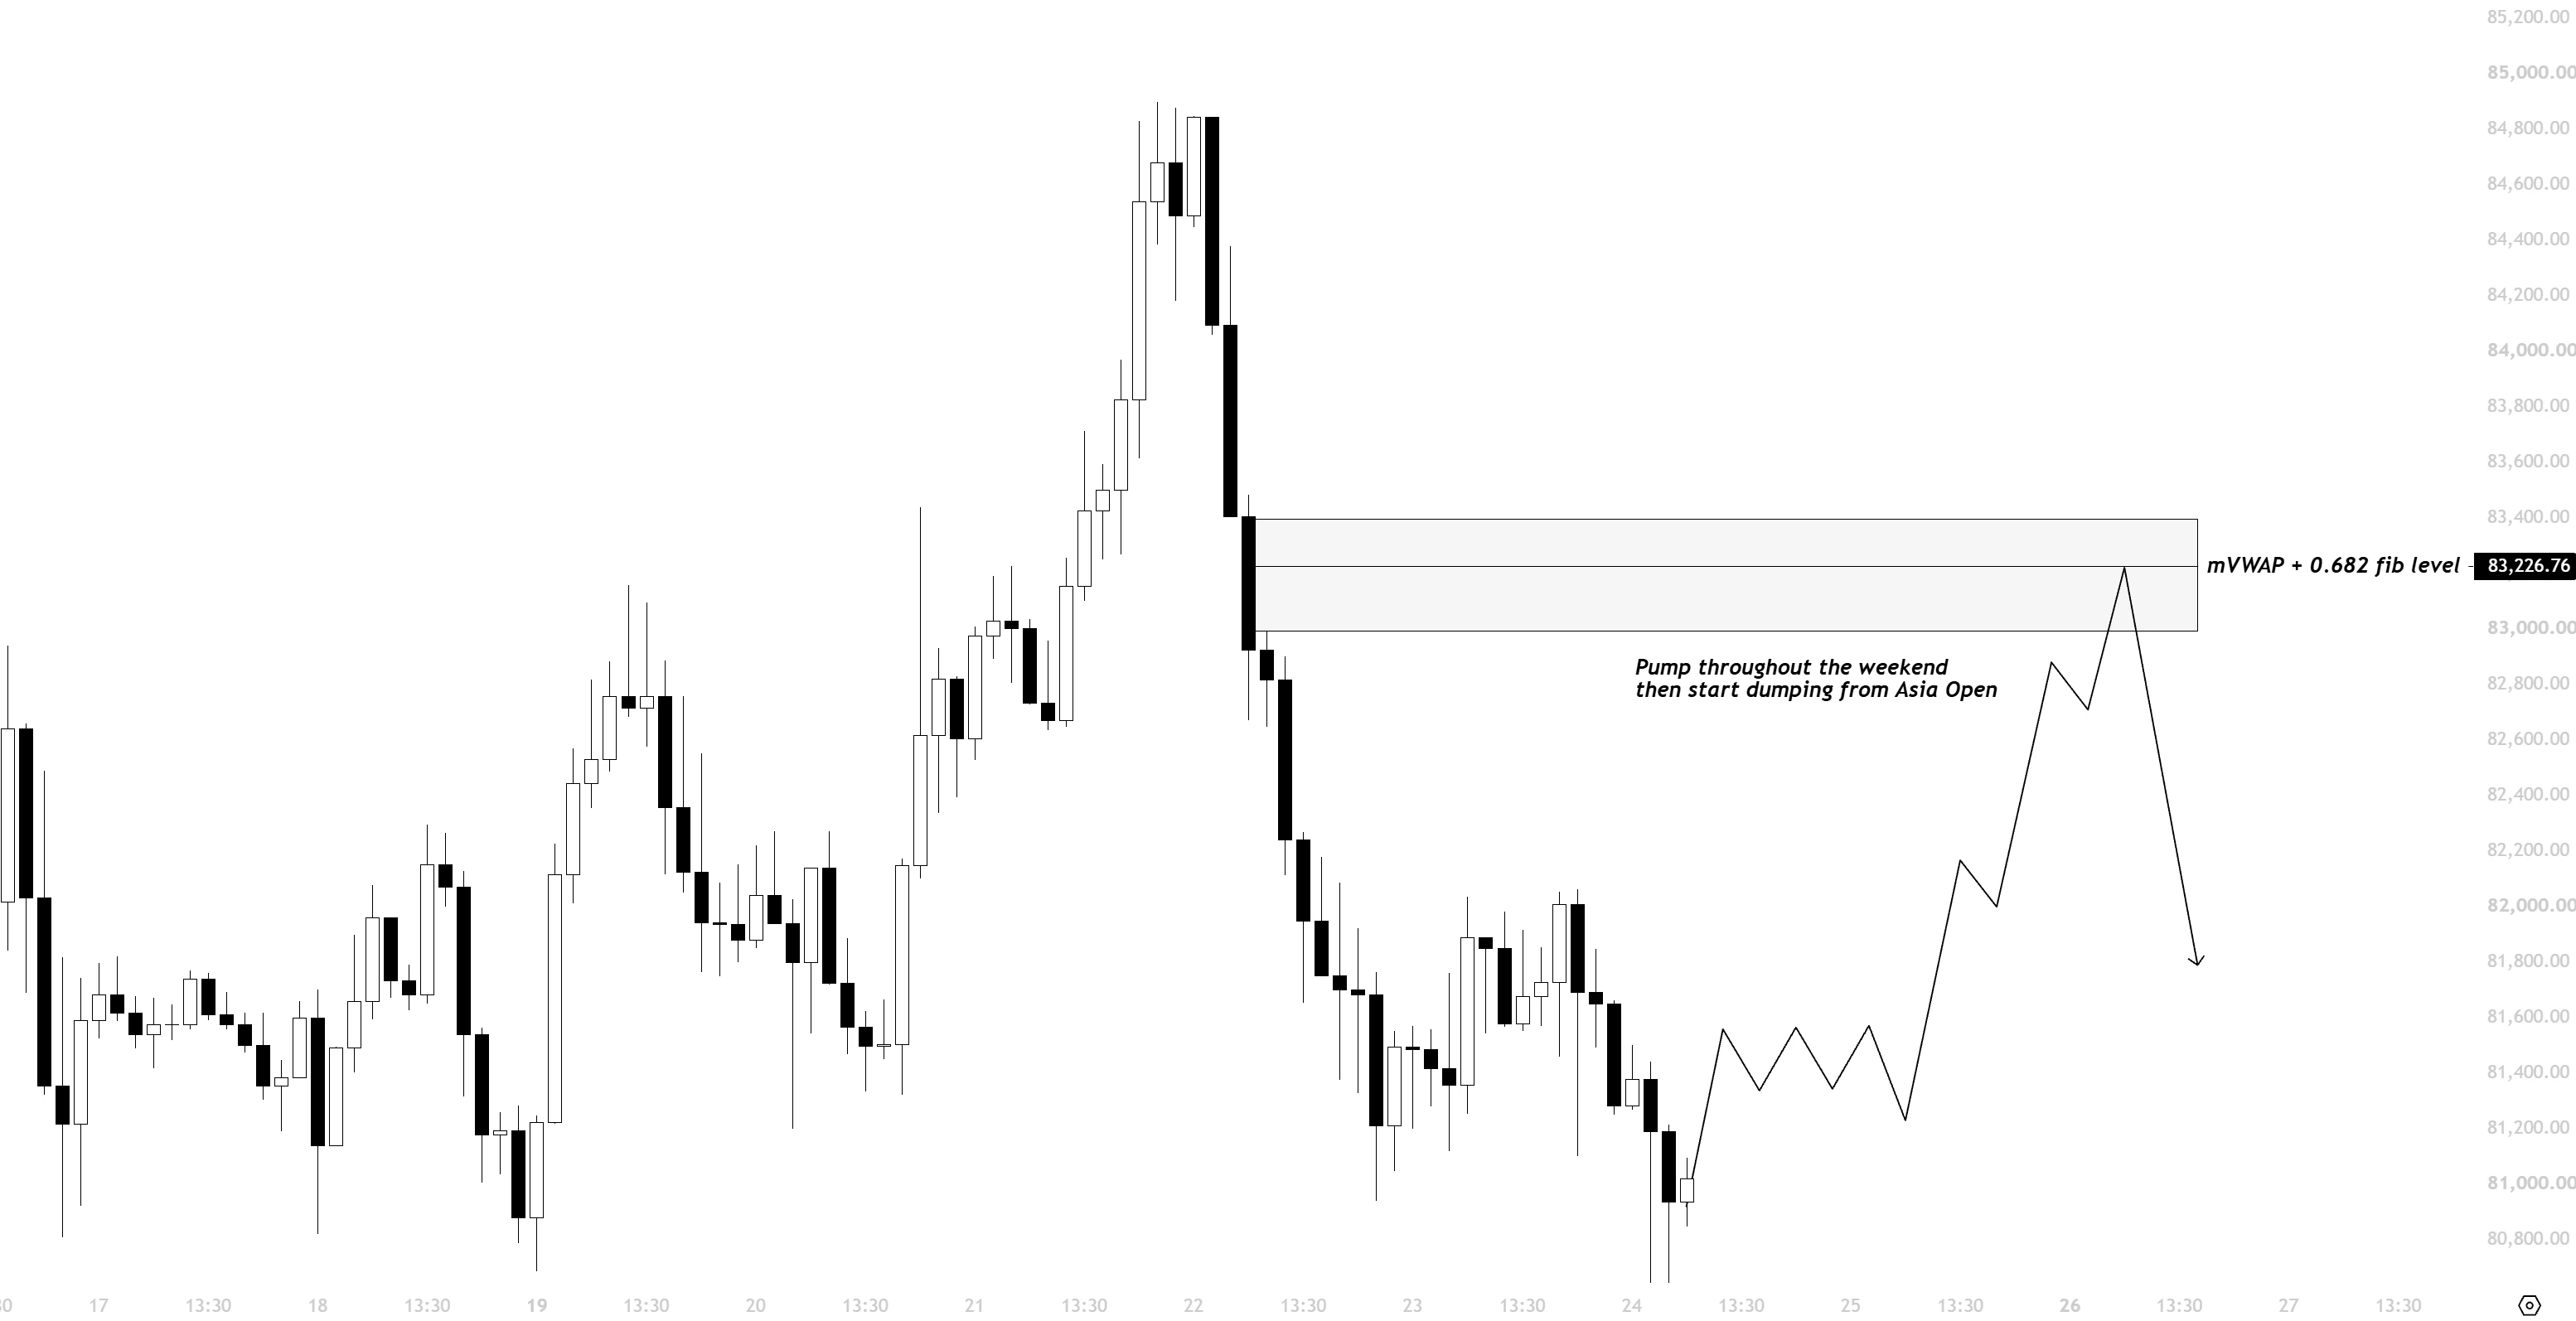
bitcoin:native Short Trade Limit
Entry: 80,503
SL: 81,584
Risk: 7/10, if we tap $76k before this then trade is invalidated.
post-image
BTC-1.69%
JUST IN: Anthropic’s IPO timeline shifted to mid-October with a target valuation up to $2T. If realized, this would be a landmark AI listing and could signal growing institutional appetite for large-scale AI plays. $ANTH not a crypto ticker, but indicates AI market sentiment i...
post-image
JUST IN: Elon Musk says you will be able to plug PlayStation or Xbox consoles directly into your Tesla.
TSLA-5.96%
One losing trade can teach more than ten winning trades. I’ve had positions where I ignored my own plan and paid the price. It wasn’t fun at the time, but those mistakes helped me become more disciplined.
#Gate60MUsers
post-image
  • 7
  • 1
$4 Signal】Long | 4H Breakout Above the Bollinger Upper Band
$4 bid-ask depth ratio 1.09, with the price breaking above the 4H Bollinger upper band at 0.0226. 4H RSI 79.45, 1H RSI 71.50, 4H MACD histogram widening and 1H histogram shortening. The current price of 0.02361 is in the upper-middle part of the 1H range, with order book imbalance at 4.19%.
🎯Direction: Long
⚡Entry/Limit Order: 0.0236100
🛑Stop Loss: 0.0233739
🚀Target 1: 0.0239641
🚀Target 2: 0.0241412
🛡️Trade Management:
- Execution strategy: After reaching Target 1, reduce the position by 50% and move the stop loss up to the brea
post-image
4+67.83%
BTC-1.67%
ETH-2.36%
SOL-2.02%
Trump vs. the Fed: A Cognitive War of “The Better the Data, the More the Market Falls”
Last night, U.S. stocks, gold, and Bitcoin all plunged.
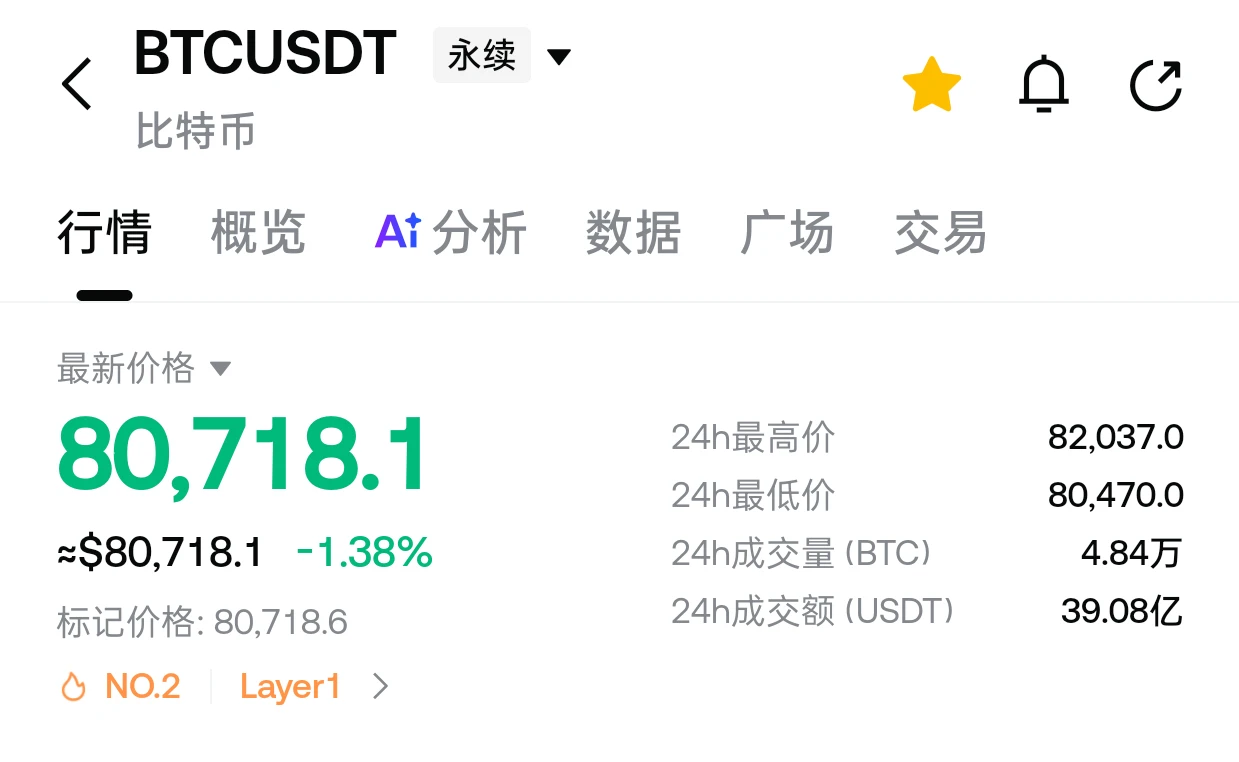
The Dow fell, gold broke below $4,400, and Bitcoin instantly crashed through $80k from $81,600.
Just after the data was released, Trump posted a message praising August nonfarm payrolls as “excellent”—up 162k, versus expectations of just 56k, nearly twice as much.
In theory, with the economy doing so well, stocks should rise.
But what happened? S&P 500 futures fell, the dollar index surged to 99.93, and the September rate-hike probability shown by CME F
post-image
BTC-1.67%
ETH-2.36%
XAU-0.87%
Focus on chart analysis and position risk management. Objectively share market views, avoid exaggerating returns, and approach every trade rationally. Let’s invest rationally together, avoid traps, and steadily accumulate. #以太坊 #比特币
post-image
ETH-2.36%
BTC-1.67%
Everyone’s staring at $MU /USDT’s 1010 level—but the 4h chart just whispered a secret nobody’s decoding yet.

$MU /USDT - SHORT

Trade Plan:
Entry: 1008.85 – 1012.91
SL: 1036.23
TP1: 991.87
TP2: 979.19
TP3: 960.18

Why this setup?
Why now? The 1D trend is *range*, but the 4h bias is SHORT at 77% confidence—that’s institutional patience, not panic.
- RSI 15m at 50.18 = zero momentum cover; price is stalling, not reversing.
- ATR 1h at 8.12 means the current 1010.88 zone is a tight coil—break below 1008.85 triggers a fast slide toward TP1 (991.87) and TP2 (979.19).
- Stop at 1036.23 is
MU+5.11%
Load More

Join 40 M users in our growing community

⚡️ Join 40 M users in the crypto craze discussion

💬 Engage with your favorite top creators

👍 See what interests you

View More