










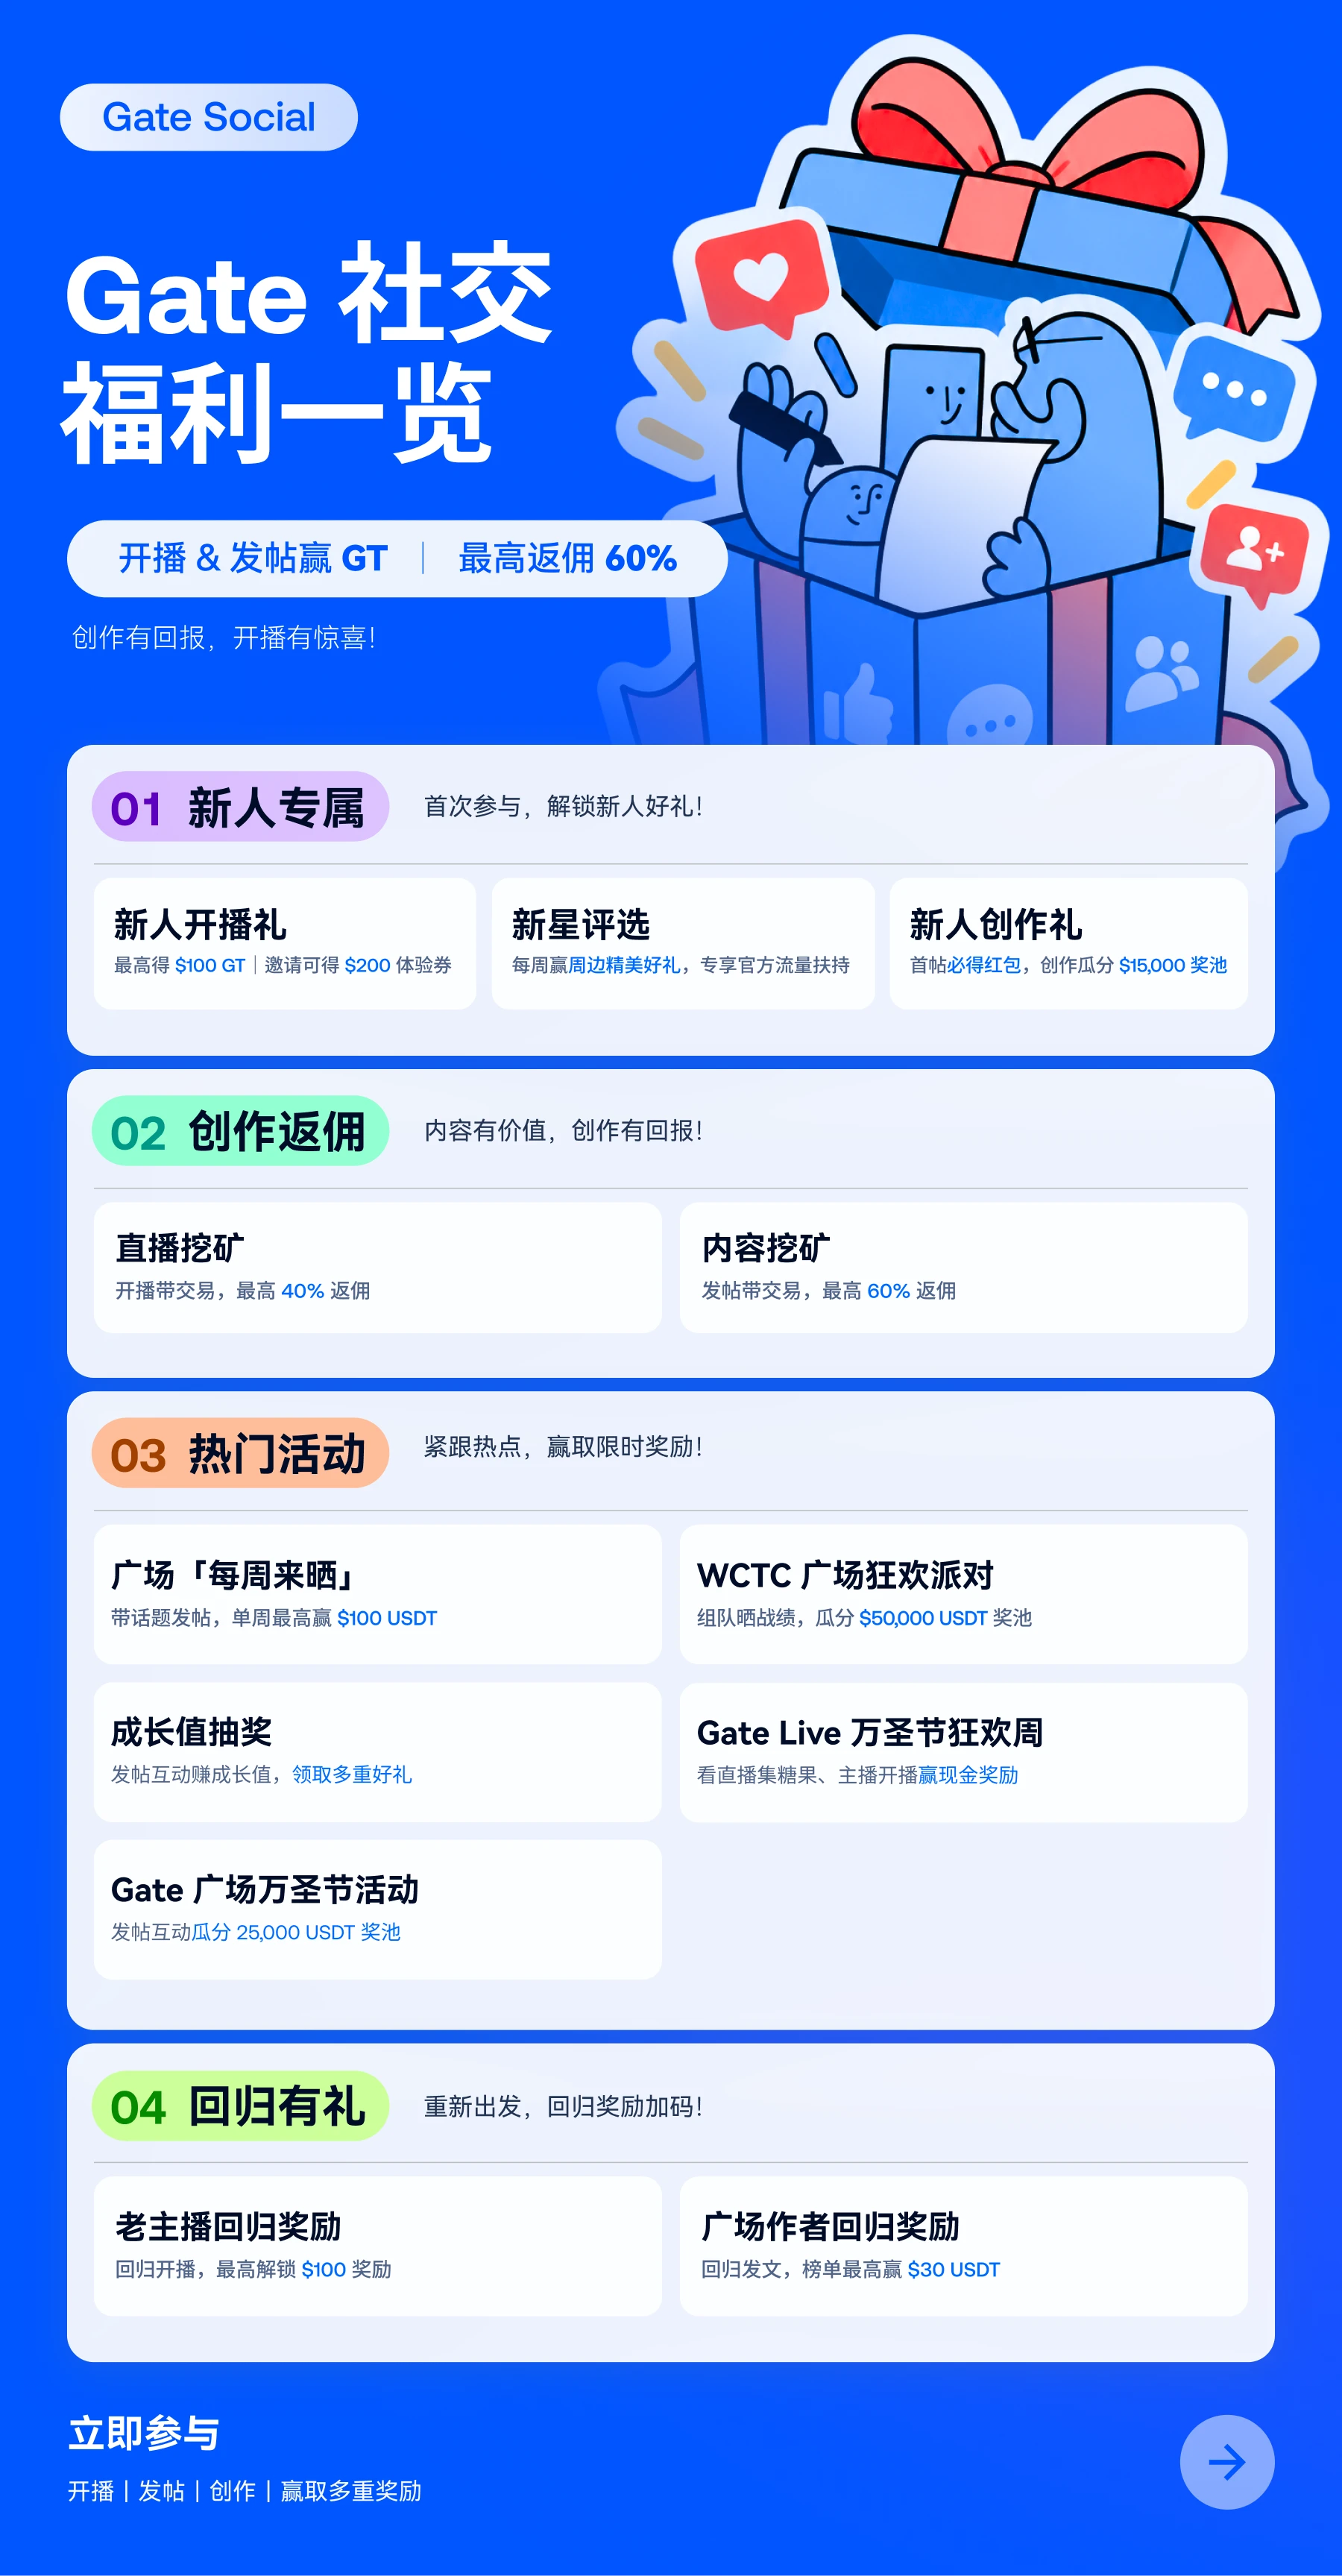
🔥Gate Social Events Overview: Multiple Benefits in One Place—Join Now to Unlock Creator Rewards!
[Newcomer Events]
🔔 New Streamer Launch Benefits + Referral Rewards
New streamers get rewards as soon as they go live, and can earn extra bonuses by inviting streamers to join
https://www.gate.com/announcements/article/102066
🎁 Weekly Rising Star Streamer Selection
New streamers can win exclusive prizes each week they go live, with dedicated official traffic support
https://www.gate.com/announcements/article/102230
🔥 New Creator Rewards
New creators are guaranteed a red packet for their first post and can share $15,000 through content creation
https://www.gate.com/announcements/article/102256
[Hot Events]
🔥Gate Live Halloween Week
Collect candy by watching livestreams, enjoy nightly red packet showers, and earn rewards by going live
https://www.gate.com/zh/campaigns/6702
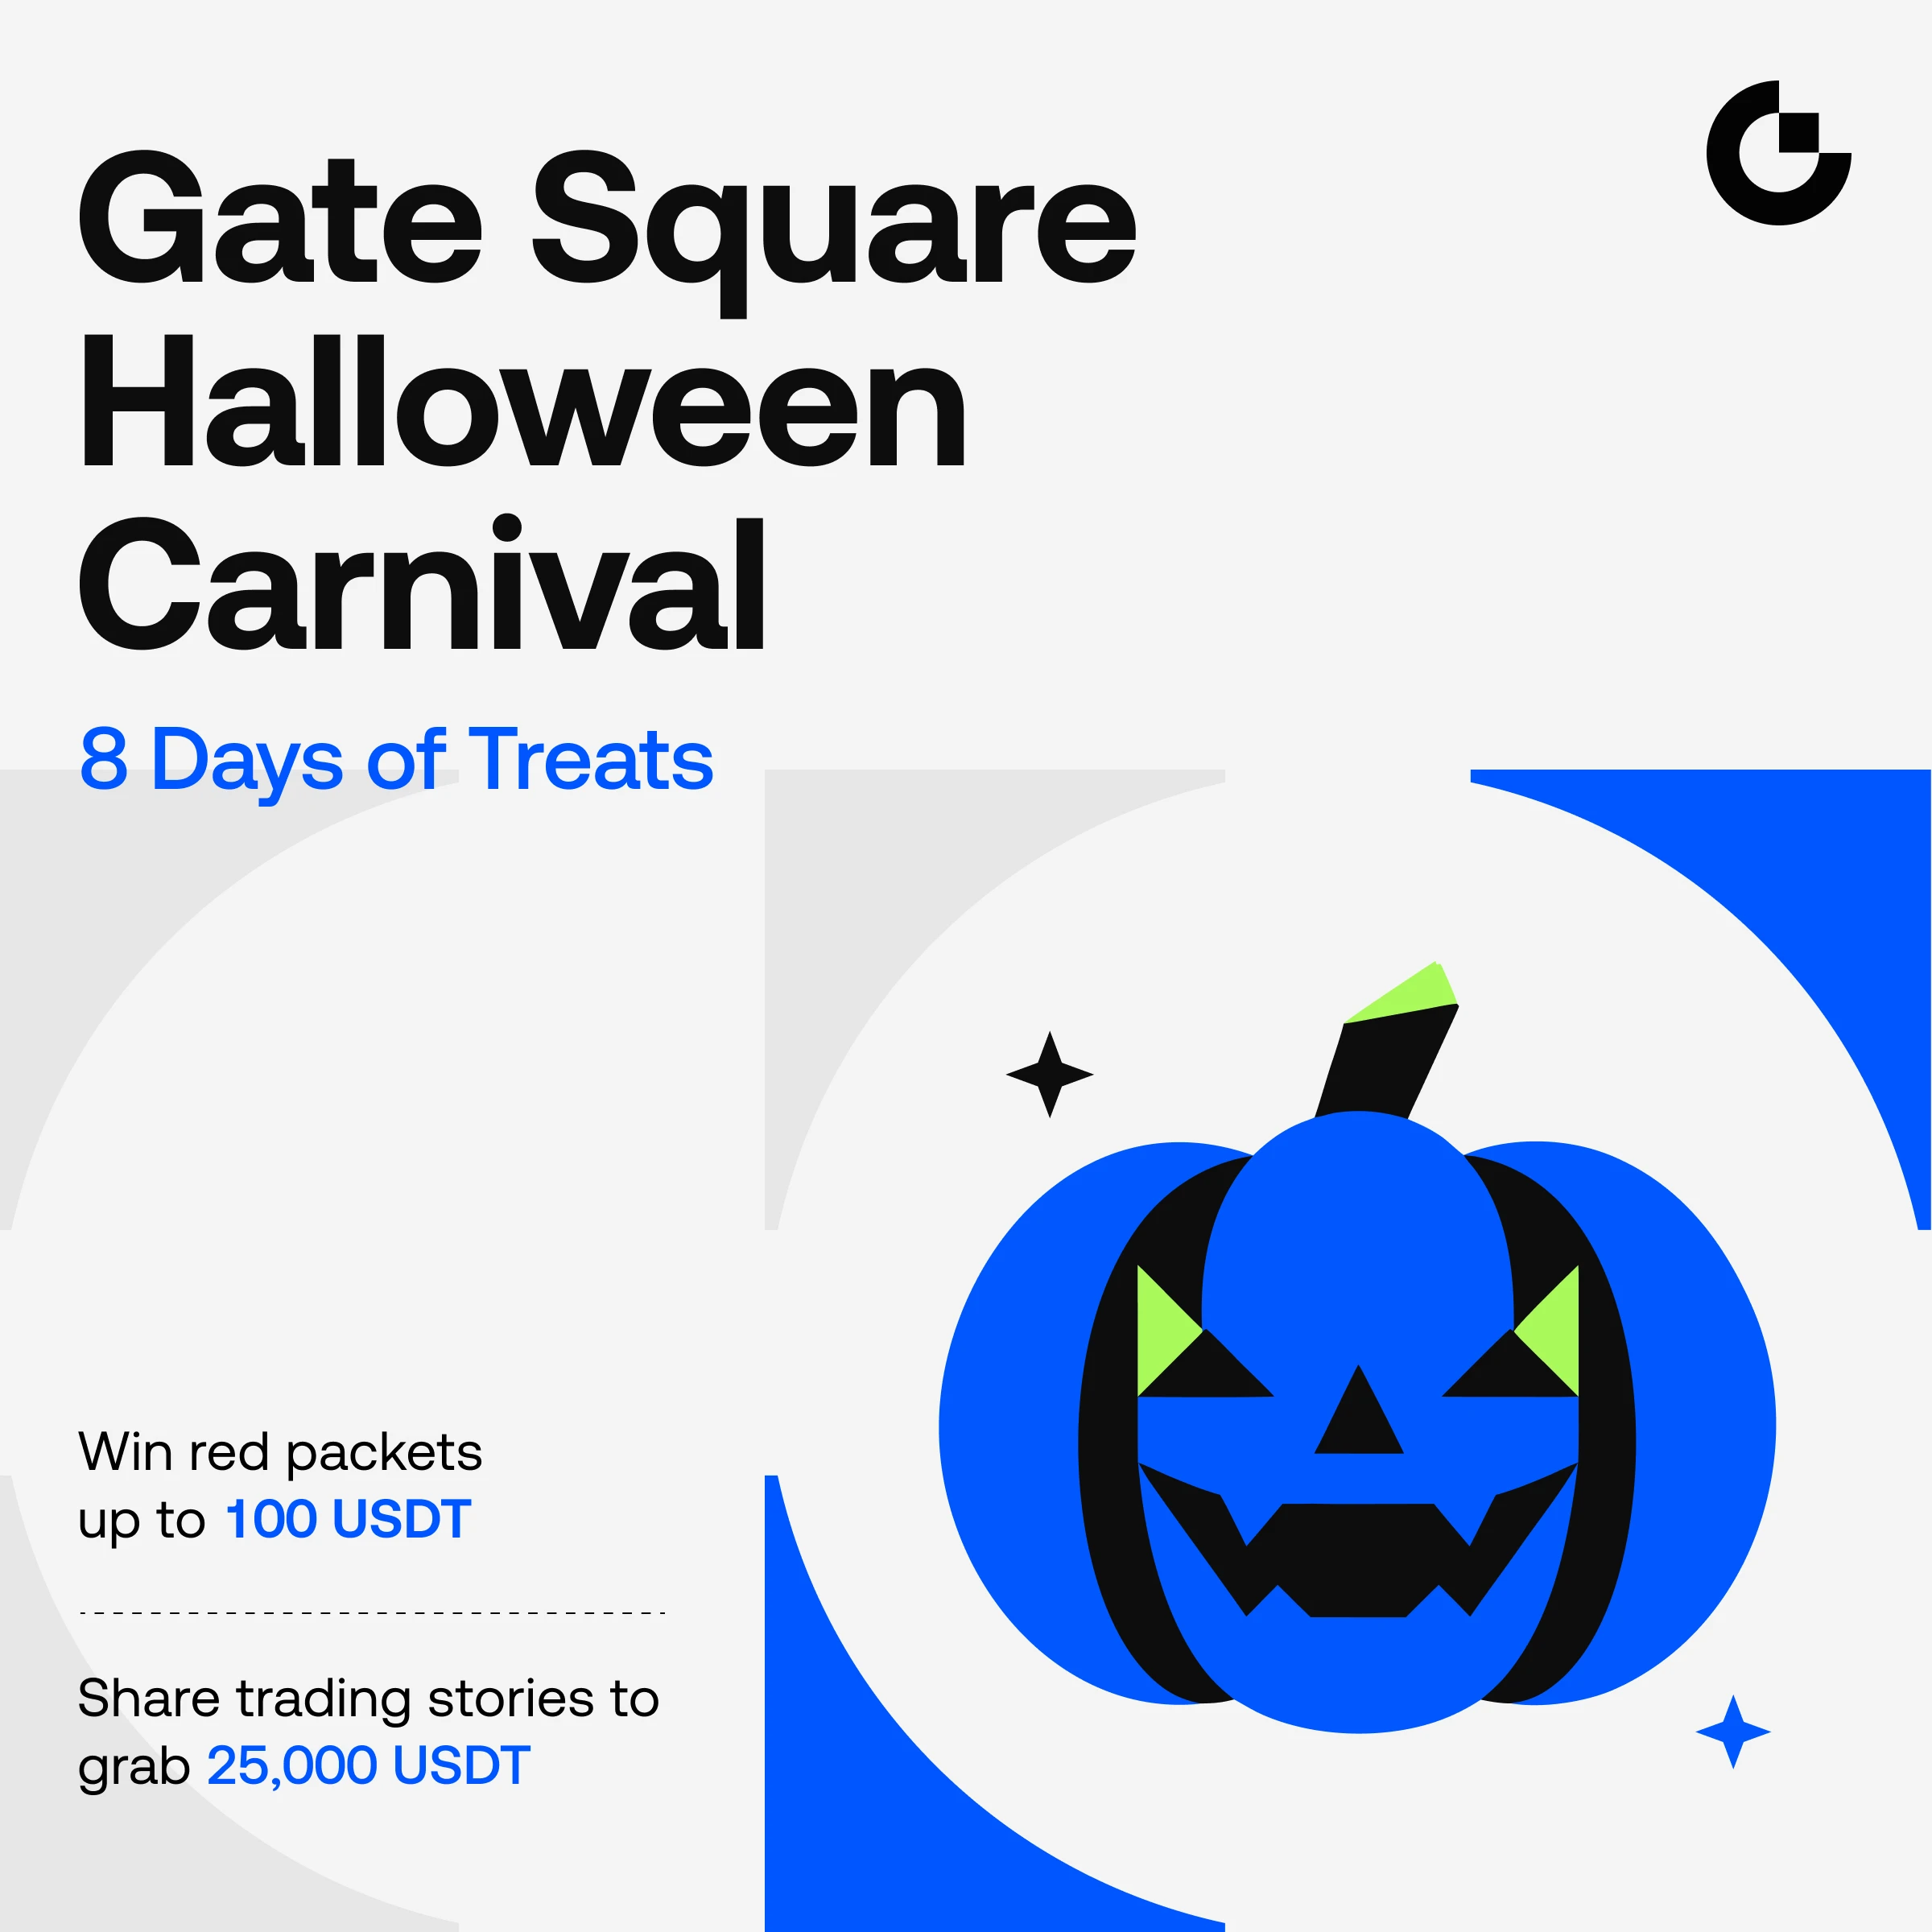
✍️Gate Square Halloween Event
Post and interact to share a 25,000 USDT prize pool
https://www.gate.com/zh/campaigns/6741
🏆 Weekly Sharing Event: Post and join the discussion
Unlock up to 100 USDT in a single week
https://www.gate.com/campaigns/6244
🎰 Social Growth Points Giveaway Extravaganza, Round 25
Earn growth points by posting and interacting, and claim prizes
https://www.gate.com/announcements/article/102280
🎁 WCTC Square Celebration Party
Share your results and discuss strategies to share a 50,000 USDT prize pool and GT prizes
https://www.gate.com/announcements/article/102143
[Mining Rewards]
🔨 Earn Commissions by Livestreaming Trades
Share trading strategies and earn up to 40% commission on trades
https://www.gate.com/announcements/article/49565
✍️ Square Content Mining
Creators can earn up to 60% in rebates
https://www.gate.com/announcements/article/49475
[Return Events]
🎤 Returning Streamer Rewards
Go live again to claim rewards, with up to $100 available
https://www.gate.com/announcements/article/102065
✍️ Gate Square Creator Return Rewards
Returning creators can earn up to $50 in GT rewards by posting
https://www.gate.com/announcements/article/102058
[Newcomer Events]
🔔 New Streamer Launch Benefits + Referral Rewards
New streamers get rewards as soon as they go live, and can earn extra bonuses by inviting streamers to join
https://www.gate.com/announcements/article/102066
🎁 Weekly Rising Star Streamer Selection
New streamers can win exclusive prizes each week they go live, with dedicated official traffic support
https://www.gate.com/announcements/article/102230
🔥 New Creator Rewards
New creators are guaranteed a red packet for their first post and can share $15,000 through content creation
https://www.gate.com/announcements/article/102256
[Hot Events]
🔥Gate Live Halloween Week
Collect candy by watching livestreams, enjoy nightly red packet showers, and earn rewards by going live
https://www.gate.com/zh/campaigns/6702
✍️Gate Square Halloween Event
Post and interact to share a 25,000 USDT prize pool
https://www.gate.com/zh/campaigns/6741
🏆 Weekly Sharing Event: Post and join the discussion
Unlock up to 100 USDT in a single week
https://www.gate.com/campaigns/6244
🎰 Social Growth Points Giveaway Extravaganza, Round 25
Earn growth points by posting and interacting, and claim prizes
https://www.gate.com/announcements/article/102280
🎁 WCTC Square Celebration Party
Share your results and discuss strategies to share a 50,000 USDT prize pool and GT prizes
https://www.gate.com/announcements/article/102143
[Mining Rewards]
🔨 Earn Commissions by Livestreaming Trades
Share trading strategies and earn up to 40% commission on trades
https://www.gate.com/announcements/article/49565
✍️ Square Content Mining
Creators can earn up to 60% in rebates
https://www.gate.com/announcements/article/49475
[Return Events]
🎤 Returning Streamer Rewards
Go live again to claim rewards, with up to $100 available
https://www.gate.com/announcements/article/102065
✍️ Gate Square Creator Return Rewards
Returning creators can earn up to $50 in GT rewards by posting
https://www.gate.com/announcements/article/102058